|
Results and Discussion
Global sectoral analysis of GHG emission from 1970 to 2004 [69] shows that CO2 is the major GHG. The per capita GHG emissions in India are still a fraction of the emissions produced by the developed industrialised countries such as US, Russia and Japan [70]. Developing countries with 80% of the world’s population account for about one fifth of the cumulative emissions since 1751; the poorest countries in the world, with 800 million people, have contributed less than 1% of these cumulative emissions [19, 71]. In order to implement appropriate mitigation and adaptation strategies at local level, knowledge of region wise estimation of GHG emissions is required along with the scope for sequestration of carbon.
Carbon emission: An attempt has been made to compile sector wise emissions from agriculture (agricultural residue burning, rice cultivation and livestock), domestic energy consumption (fuelwood and chips, kerosene and LPG), industries (cement and steel producers), electricity generation and transport.
Electricity generation is one of the major contributors of CO2 and CO emission; it contributed 35.5% of total CO2 emission in year 2010. An earlier study done in 2000 shows that CO2 emission from coal based power plants was 50.1% of the total emission [72]. The current decrease in CO2 emission could be due to a more efficient means of production and usage of electricity. Total emission from this sector is 343.3 Tg/year for CO2 and 1.2 Tg/year for CO. Largest percentage of CO2 and CO emission is contributed by Maharashtra, which is followed by West Bengal and Gujarat as shown in Figure 2.1 and 2.2.
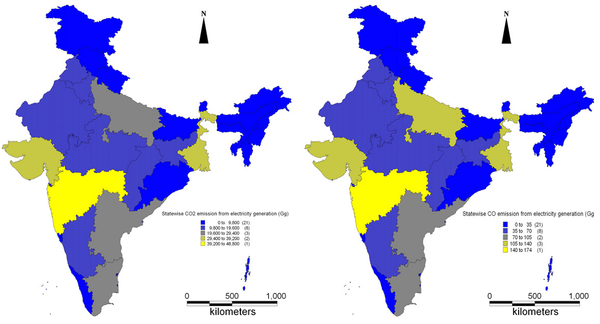
Fig 2: Statewise emission from electricity generation
Indian road transport contributed a significant quantity of 246.2 Tg CO2 and smaller quantities of CO and CH4 in the year 2004-05, as given in Figures 3.1, 3.2 and 3.3 respectively. Among the states and UT, Maharashtra’s annual contribution was the largest, amounting to 28.8 Tg of CO2, followed by Tamil Nadu (26.4 Tg), Gujarat (23.3 Tg) and Uttar Pradesh (17.4 Tg). Among all states or UT of India, gross state domestic product (GSDP) of Maharashtra is the highest (Table 10).
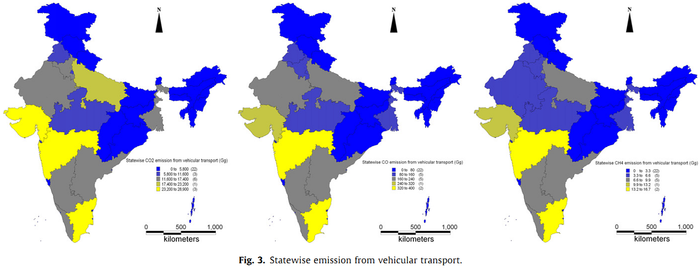
Fig 3: Statewise emission from vehicular transport
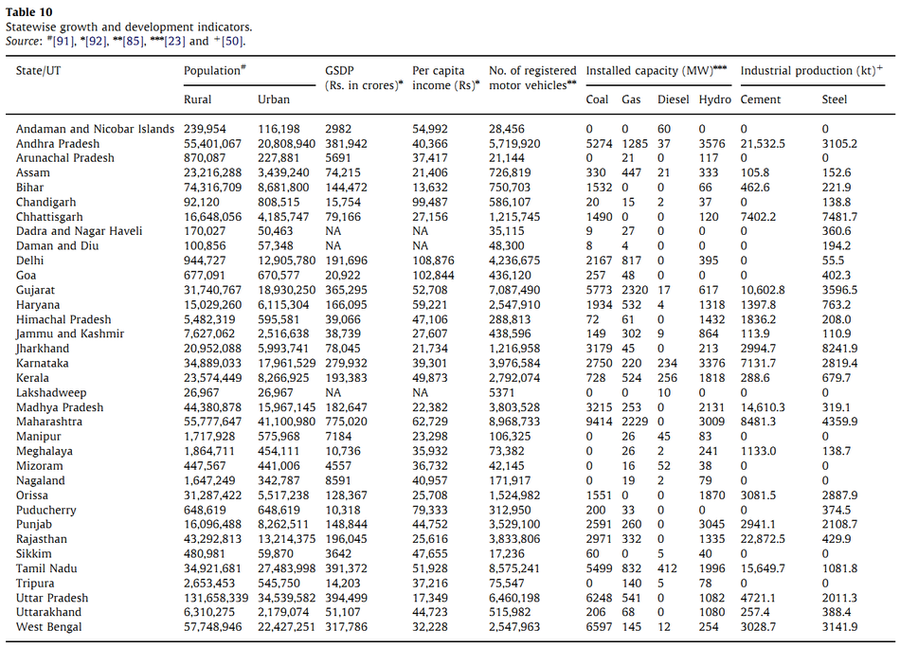
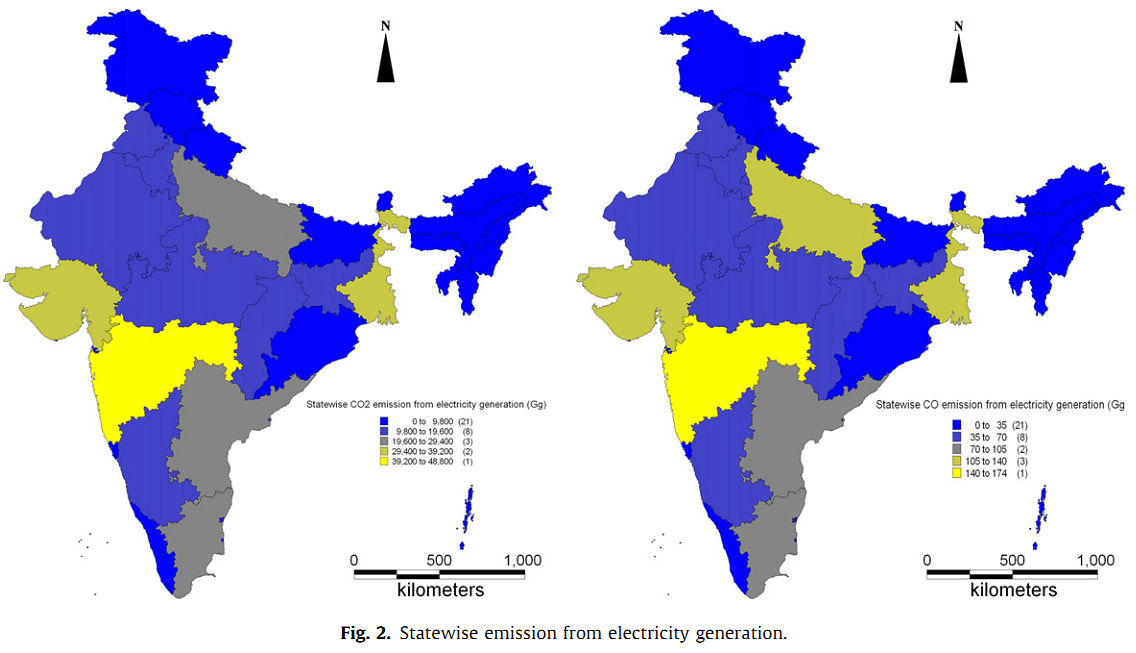
Cement and steel industries are major sources of industrial CO2 emissions. Rajasthan, Andhra Pradesh, Tamil Nadu and Madhya Pradesh are major producers of cement, accounting to about 57% of total cement produced in period Apr-Dec, 2009 [51]. Steel industries are basically distributed in Chattisgarh, Jharkhand, Maharashtra and Gujarat. In steel industries usually both types of coal: coking coal as well as metallurgical coal is used. Coking coal emits more carbon than metallurgical coal. Total contribution of this sector is 202.2 Tg/year as shown in Figures 4. Jharkhand (26.1 Tg/year), Chhattisgarh (26.1 Tg/year), Andhra Pradesh (20.1 Tg/year), Maharashtra (17.3 Tg/year) and Gujarat (16.1 Tg/year), with major cement and steel industries contribute 52% of total CO2 emission from the industrial sector.
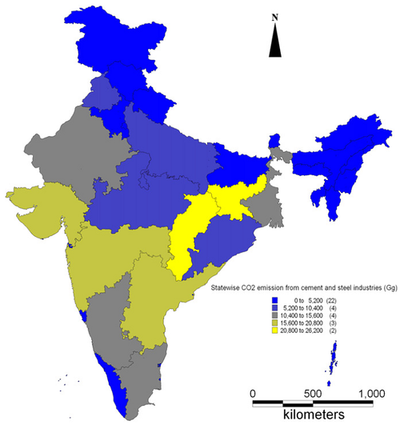
Fig 4: Statewise CO2 emission from cement and steel industries
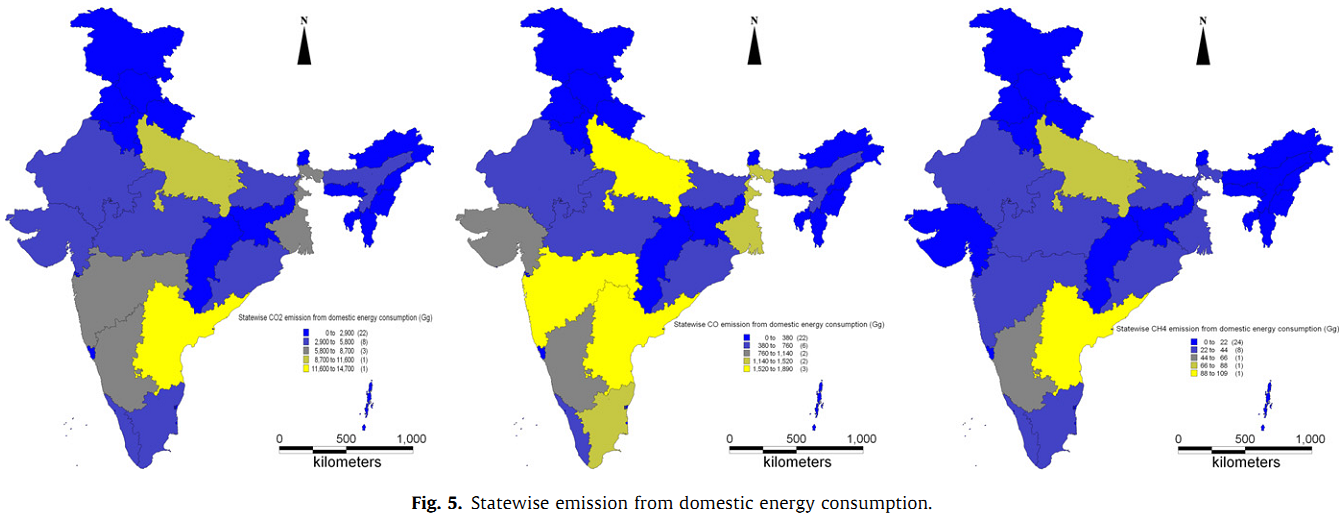
Domestic energy consumption (rural and urban consumption) contributes 88.3 Tg/year, 14.7 Tg/year and 0.6 Tg/year of CO2, CO and CH4 respectively in the year 2001, as illustrated in Figure 5.1, 5.2 and 5.3 respectively. CO2 emission is largest in Andhra Pradesh (14.6 Tg/year) followed by Uttar Pradesh (9.9 Tg/year), and Maharashtra (6.5 Tg/year). Census of India, 2001 shows that Andhra Pradesh, Uttar Pradesh and Maharashtra have highest population as compared to other states of India. Similarly, CO emission is highest in Maharashtra (1.8 Tg/year), followed by Andhra Pradesh (1.6 Tg/year) and Uttar Pradesh (1.6 Tg/year).
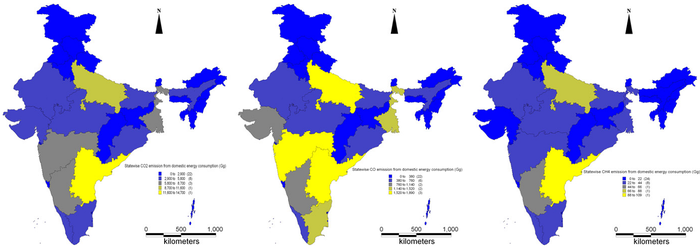
Fig 5: Statewise emission from domestic energy consumption
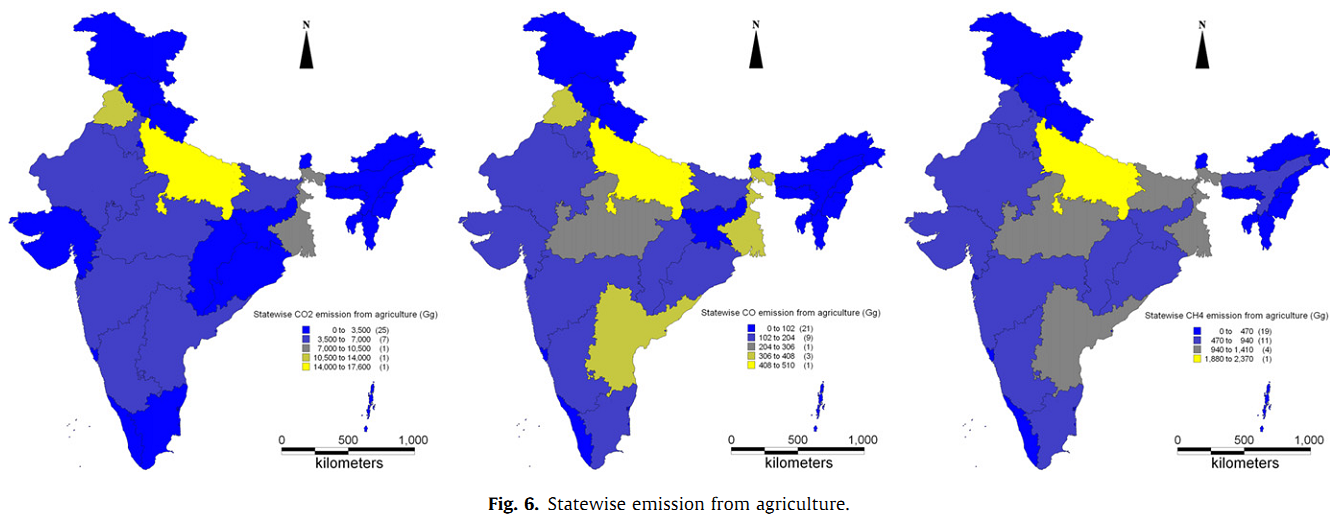
Indian agriculture contributes to significant quantities of 85.8 Tg CO2 and smaller quantities of CH4 and CO. Annual CO2, CH4 and CO emission in the agriculture sector, quantified based on agricultural area and production and number of livestock, is given in Figures 6.1, 6.2 and 6.3. It illustrates that agriculturally dominant states are Uttar Pradesh, Punjab, West Bengal, Madhya Pradesh, and Andhra Pradesh. Emission from agricultural residue burning, livestock and rice cultivation are computed for the years 2005-2006, 2003 and 2004-2005. Uttar Pradesh is contributing a maximum of 17.5 Tg/year of CO2, followed by Punjab (11.6 Tg/year), West Bengal (7.2 Tg/year), Madhya Pradesh (6.9 Tg/year) and Andhra Pradesh (6.6Tg/year). These states account for 58% of the CO2 emissions from agriculture. Agricultural residue burning is a major contributor of CO2 emission in Agriculture. Livestock and rice cultivation are major cause of methane emission. Uttar Pradesh (2.3 Tg/year) leads in contributing methane followed by West Bengal, Andhra Pradesh and Madhya Pradesh. Similarly, carbon monoxide emission is largest in Uttar Pradesh (0.5 Tg/year), which is followed by West Bengal, Andhra Pradesh and Punjab.
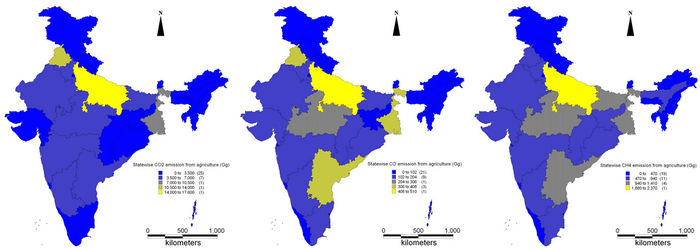
Fig 6: Statewise emission from agriculture
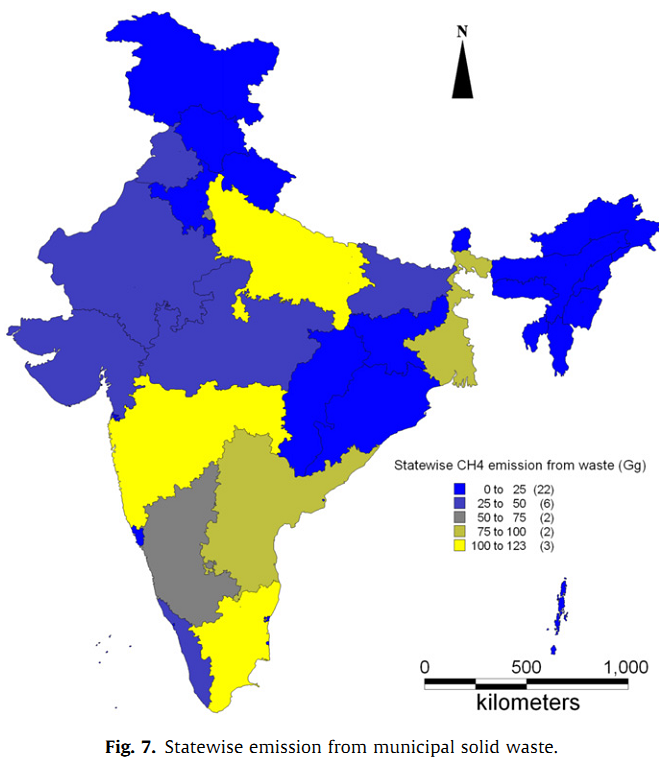
The total methane emitted from municipal solid waste accounts to 0.9 Tg/year. Uttar Pradesh is contributing the largest fraction of 0.1 Tg/year, followed by Maharashtra and Tamil Nadu (Figure 7). The greater contribution of Uttar Pradesh is because it has an urban population of 34 million and 131 million of rural population (Table 10), which is second highest population in Indian states/UT.
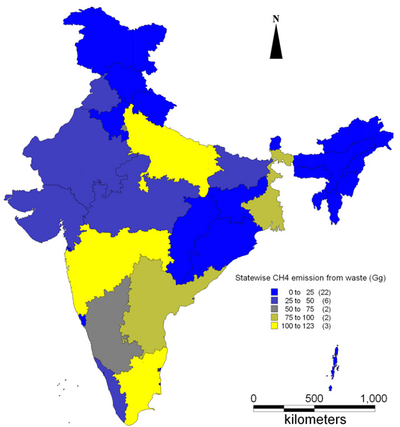
Fig 7: Statewise emission from municipal solid waste
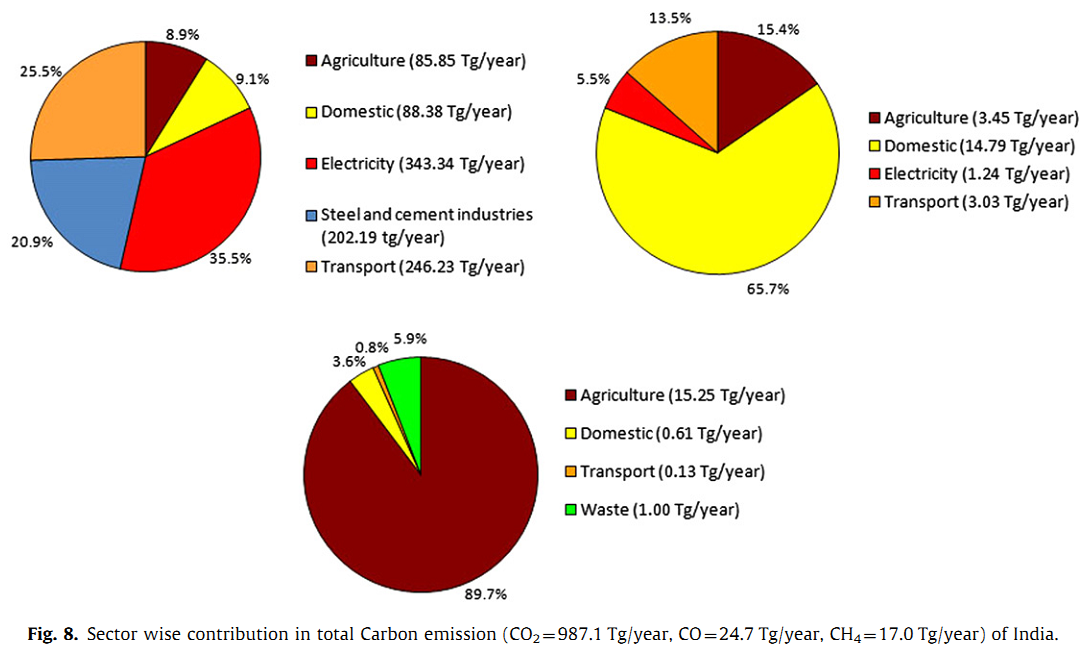
Sector wise analysis of global GHG emission highlights that energy is the major sector of CO2 emission (25.9%) followed by industries (19.4%) [19]. The current Indian sector wise analysis shows a similar type of trend with the highest contribution of 35.5% from electricity production followed by transport (25.5%) and steel and cement industries (20.9%). During the last two decades, number of registered motor vehicles has also increased dramatically from 5.4 million in 1980-81 to 72.7 million 2003-04 [73]. This has also enhanced the demand of energy. India is following the global urbanization trend and consequent to this, CO2 emissions have doubled between 1990 and 2008 and a large share is taken by the electricity and heat sector, which represented 56% of CO2 in 2008 which was 42% in the early nineties [74, 75]. The net GHG emissions from India (emissions with LULUCF) were 1727.71 million tons (mt) of CO2 equivalent in 2007. Current analysis reveals that, India emits around 965.9 Tg of CO2, 22.5 Tg of CO and 16.9 Tg of CH4 annually from different sources. Compared to this, an earlier study (1994) reports of 817 Tg/year CO2, 18 Tg CH4 emissions [76] and 69 Tg/year CO emissions of [77]. A similar study in 2005 [78] indicates emissions of 1229 Tg/year of CO2 and 20.08 Tg/year of CO considering coal mining, aviation and navigation in addition to the sources considered in the present study. This study, nevertheless, provides a decentralized picture of emissions and the ability for sequestration. Sector wise percentage contribution of CO22, CO and CH4 are shown in Figure 8 and Table 11 lists sector wise contribution of CO2, CO and CH2 Among all federal states and UT, Maharashtra’s contribution is largest in CO2 and CO emission of 105.2 Tg/yr and 2.6 Tg/yr, respectively and Uttar Pradesh.has higher CH4 emission of 2.5 Tg/year.
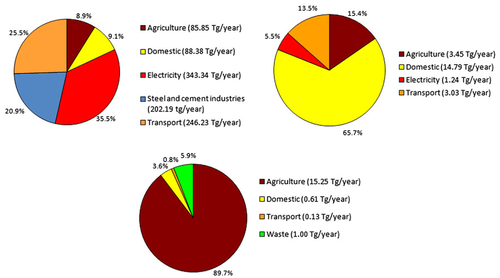
Fig 8: Sector wise contribution in total Carbon emission (CO2= 987.1 Tg/year, CO= 24.7 Tg/year, CH4= 17.0 Tg/year) of India
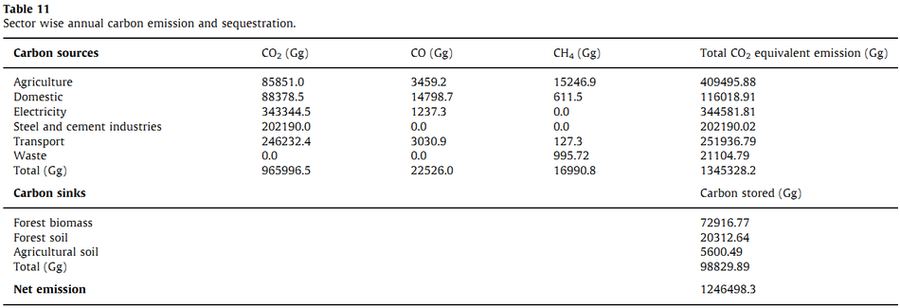
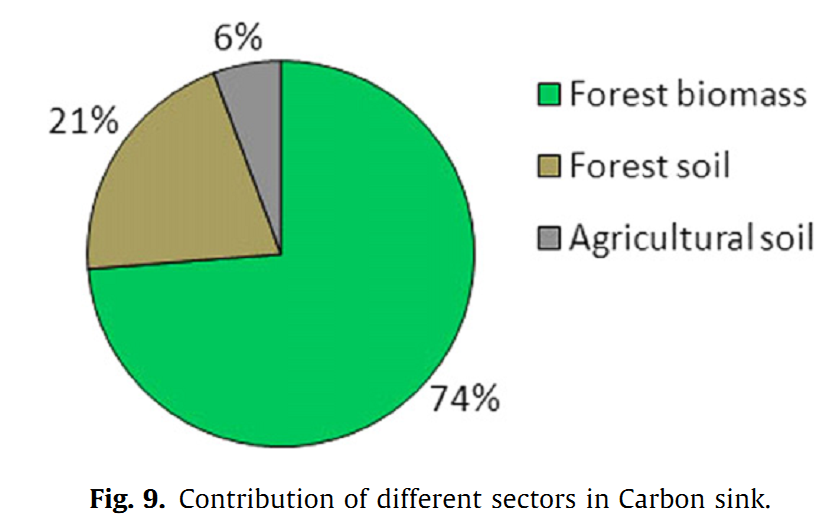
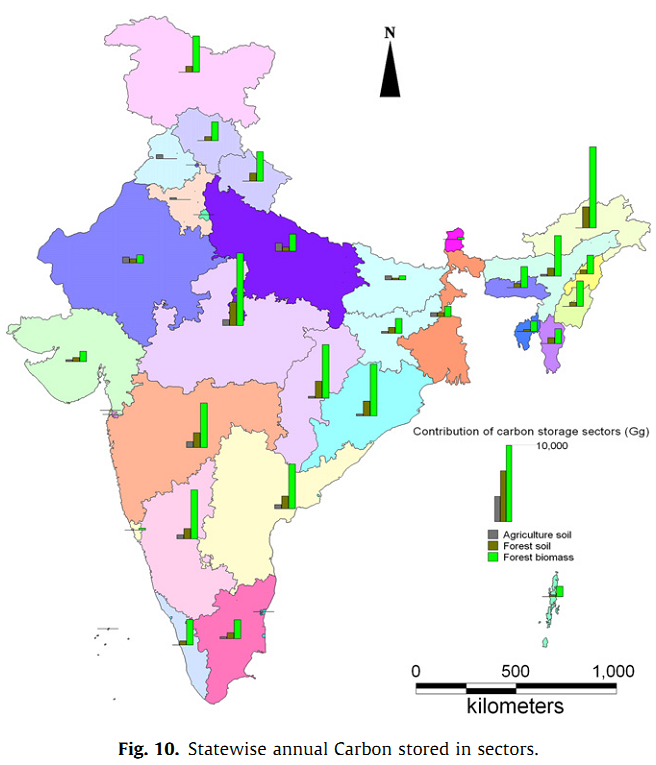
Carbon sequestration: Forest vegetation and soil sequester carbon and Figure 9 highlights the relative share of forests (vegetation, soil) and agriculture (soil) sectors. Base year for the current estimation is 2005 for forest biomass and soil, and 2008 for agricultural soil. During 1995 to 2005, carbon stocks in forest vegetation have increased from 6,245 to 6,662 mt, registering an annual increment of 38 mt of carbon or 138 mt of CO2 equivalents. Estimates reveal that forests have neutralised about 11.25 % of total CO2 equivalent GHG emissions in year 1994 [79, 80]. This is equivalent to offsetting 100% emissions from all energy in residential and transport sectors; or 40% of total emissions from the agriculture sector. Forest biomass store around 74% of total carbon stored. India has a large spread of forest in an area of 67,708 thousand ha. Annually, it accumulates 72.92 Tg of carbon. Arunachal Pradesh and Madhya Pradesh have the largest capacity of 7.99 Tg/year and 7.04 Tg/year of carbon. Forest Soil has second largest potential to accumulate organic carbon. It accumulates 20.31 Tg/year. Madhya Pradesh and Arunachal Pradesh’s forest soil have largest capacity of 2.28 Tg/year and 2.03 Tg/year of carbon. Statewise carbon storage potential in agricultural soil, forest soil and forest biomass is given in Figure 10 and total stored carbon is shown in Figure 11. Indian agriculture covers 112,009 thousand ha of land area for cultivation of food grains and pulses. Annually it sequesters 5.6 Tg of carbon in soil. Uttar Pradesh has the largest capacity of 0.92 Tg/year of sequestered carbon. Earlier study estimates that organic carbon stored in Indian soil at depths of 0 to 0.3 m is 9500 Tg [81]. Total carbon stored in India is 98.8 Tg/year (Table 12). Among all the states and UTs, Arunachal Pradesh’s contribution is the largest of 10 Tg, it is 10% of total carbon stored, followed by Madhya Pradesh and Chhattisgarh.
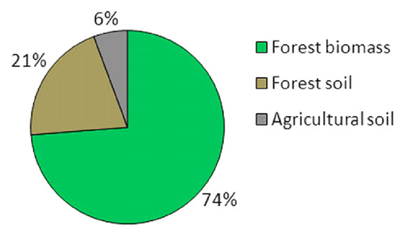
Fig 9: Contribution of different sectors in Carbon sink
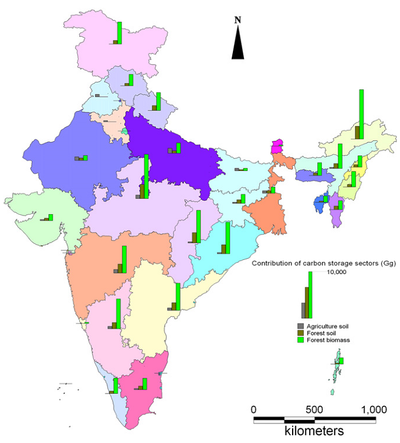
Fig 10: Statewise annual Carbon stored in sectors
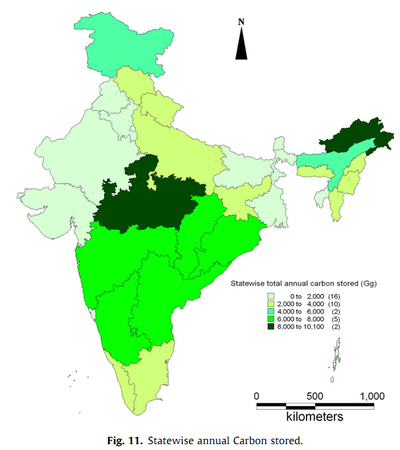
Fig 11: Statewise annual Carbon stored
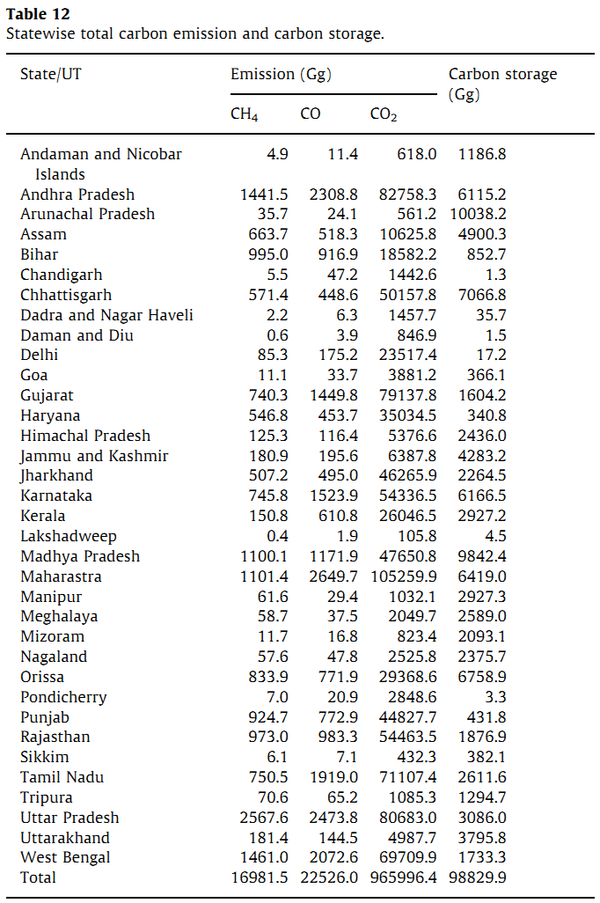
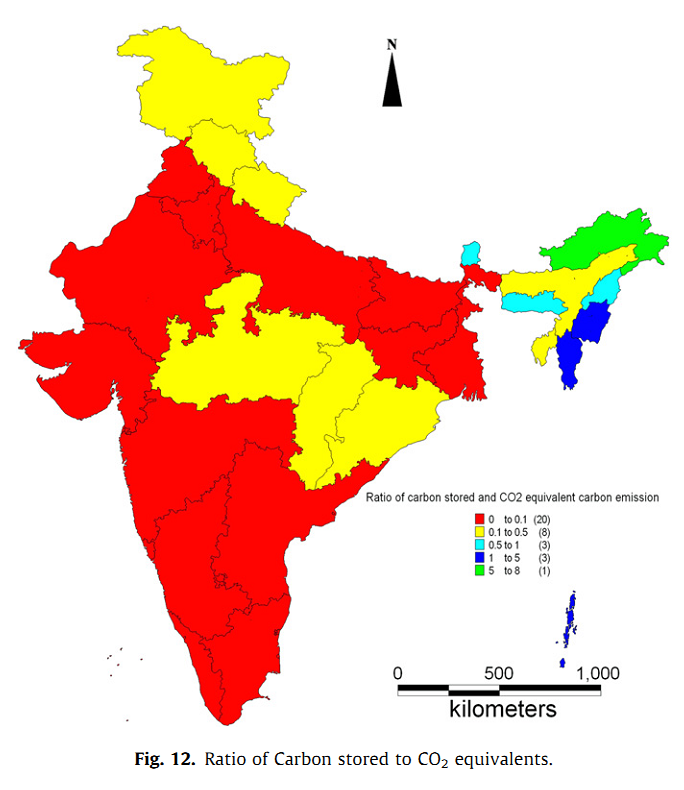
Carbon status (CS): Statewise Carbon status illustrates the quantity of carbon sequestered compared to the emissions in each federal state or UT. Basically, it is the ratio of carbon sequestered to total carbon emitted, given in Figure 12, which highlights that Arunachal Pradesh (CS: 7.5), Mizoram (CS: 1.9), Andaman and Nicobar Islands (CS: 1.6) and Manipur (CS: 1.2) are places where the carbon ratio (carbon status) is more than one, indicating higher carbon sequestration than carbon emissions. Arunachal Pradesh has a large spread of forest area in 6.8 mha (million hectare) and total standing biomass is 939 mt, followed by other states like Madhya Pradesh, Orissa and Chhattisgarh with standing biomass of 817 mt, 634 mt and 600 mt, respectively. Carbon ratio of these states is less than one, which highlights that annual carbon emission from all sectors is higher than annual carbon sequestration potential.
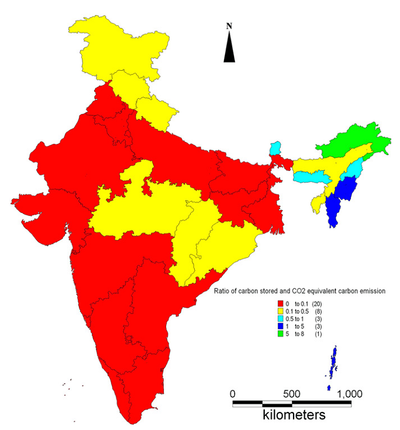
Fig 12: Ratio of Carbon stored to CO2 equivalents
Carbon status of a region can be reduced through carbon sequestration. Species of carbon is naturally captured from the atmosphere through biological, chemical or physical processes. Vegetation plays a prominent role in maintaining the balance [80]. Improvements in energy economy has to be through improvements in energy efficiency, use of renewable sources of energy , CO2 capture and sequestration (CCS) on a massive scale and development of carbon free transport. Use of low carbon footprint biofuels and improvements in the efficiency of vehicles will reduce the carbon from the transport sector [82]. Decarbonsiation in the consumer sector include the design of environment friendly green building (depending on the region’s climate), heat pumps, solar heating, use of high efficiency appliances and lighting (CFL: Compact fluorescent lamps, LED: Light emitting Diodes) shifting to renewable (like solar, wind, hydro, bioenergy, etc.), low-carbon electricity, etc. [42, 80, 82]. Renewable energy resources, which the country has in abundance, such as solar, wind, biomass, small hydro, etc. can effectively meet energy demand and are environmentally benign. About 5200 MW of power generating capacity based on renewable energy sources has been installed in the country so far [17, 83]. This constitutes about 3.8% of the total installed capacity. It is observed that nearly 58% of the country receives annual average Global insolation of 5 kWh/m2/day which if exploited could meet power requirements in a decentralized, efficient and sustainable manner [84].
|

