|
Methods
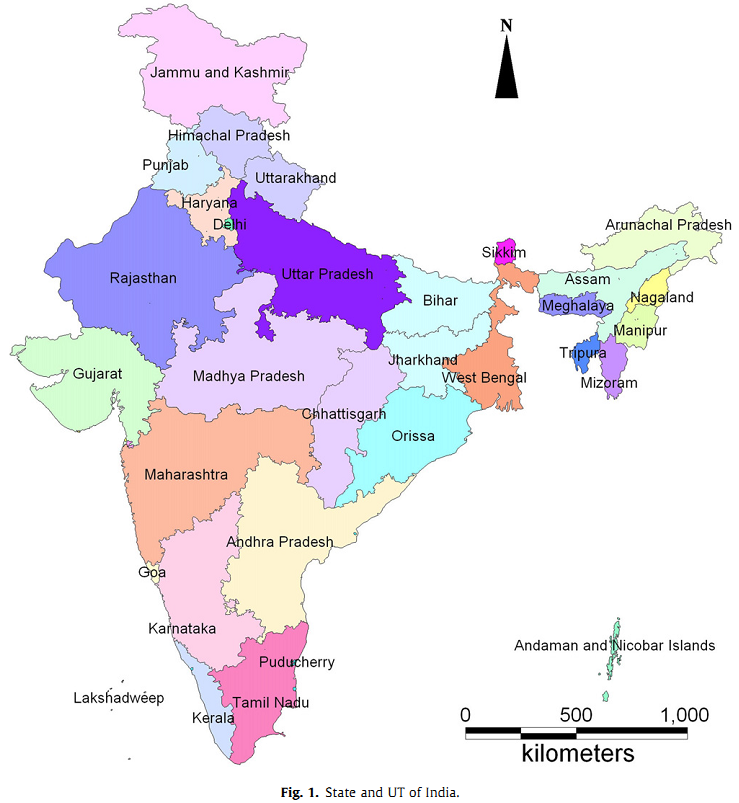
Sector wise emission factors: Data pertaining to the sector wise activities for each state were compiled from published literatures and also respective government agencies. The sector wise carbon status has been computed for all federal states in India (Figure 1). Sector wise total emission for a particular GHG is computed by considering activity level and emission coefficient as given by equation 1 [1, 20, 21].
Fig 1: State and UT of India
Total emissions = ∑ ∑ ∑ [activity level × emission coefficient]
State Source Sectors (1)
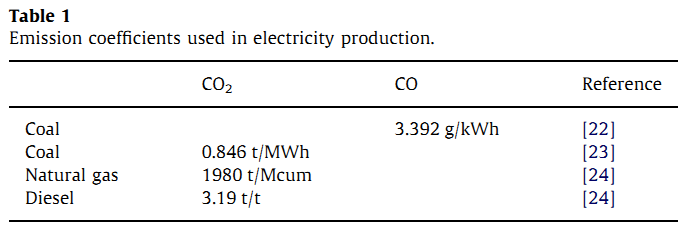
- Electricity generation: Region specific emission factors for coal thermal power plant were compiled from published literatures [22, 23]. However, emission factor specific for gas and diesel thermal power plants are not available and hence region specific factor combustion of natural gas and diesel have been used as listed in Table 1 [24].
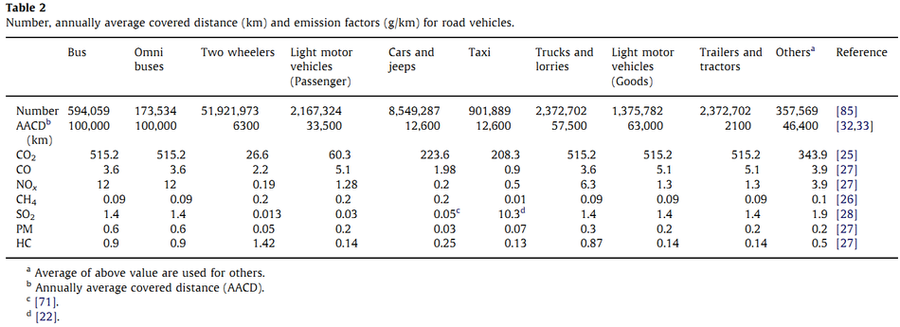
- Transport: Region specific emission factors of road transport, based on the type of vehicle are listed in Table 2 [25, 26, 27, 28, 29, 30]. As per the automobile technology prevalent in India, diesel is used as fuel in buses, mini buses, taxi, trucks, lorries, light motor vehicles (goods), trailers and tractors, while two wheelers, light motor vehicles (passenger), car and jeeps use unleaded petrol . In Delhi, most of the buses and mini buses and 5% of total cars and jeeps also use CNG (Compressed Natural Gas) [31]. CO, HC, NOx and PM emission coefficients from CNG based buses were 1.77, 0.88, 2.81 and 0.032 g km-1 and for cars and jeeps, it were 0.78, 1.55, 0.92 and 0.02 g km-1, respectively [27]. Table 2 lists vehicle type-wise annual average distance travelled [32, 33]. Annual utilization of buses, minibuses, two-wheelers, light motor vehicles (passenger), cars and jeeps, and taxi were assumed to be 100000, 100000, 6300, 33500, 12600 and 12600 km, respectively [32]. Similarly, for trucks and lorries, light motor vehicles (goods), trailers, and tractors 25000 to 90000, 63000 and 21000 km per year were assumed [33].
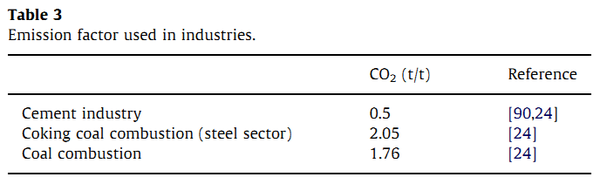
- Industries: Based on consumption of coal and its type, region specific emission factor for computing CO2 emission from cement and steel sector (Table 3) has been used.
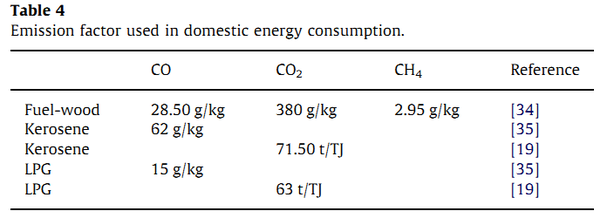
- Domestic energy: Emissions from the domestic energy consumption depend on the type and quantity of energy consumption. Fuelwood and bio-residues, kerosene, LPG and electricity are generally used in the Indian domestic sector. Electricity is not considered here to avoid the double counting of emission from electricity. Region specific emission factors [34, 35] were used to compute emission from fuelwood and bio-residues. Net Calorific Value (NCV) was used to compute CO2 emissions from kerosene and LPG [19] and emission factors are given in Table 4.
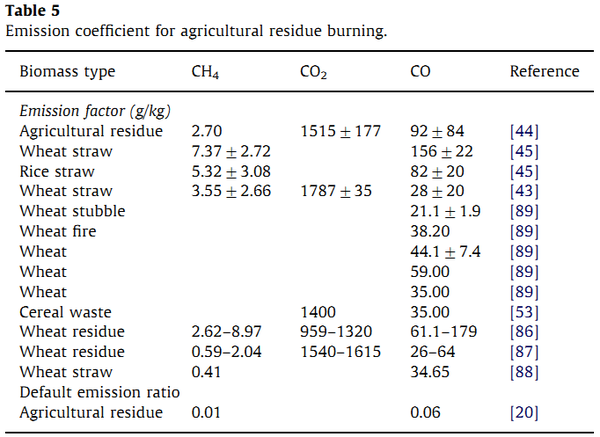
- Agriculture: Agricultural residue burning, livestock and rice cultivation are three activities which contribute in carbon emission. Emissions from agriculture sector were quantified based on IPCC approaches [20] as listed in Table 5. Emissions from agricultural residue burning for the year 2005/06 were computed based on the crop data considering standard crop residue ratio [20, 36, 37], dry matter fraction [20, 38, 39, 40], fraction actually burned [20, 21, 41, 42], fraction oxidized [20], CH4 emission factor [43, 44, 45], CO emission factor [43, 44, 45] and CO2 emission factor [43, 44].
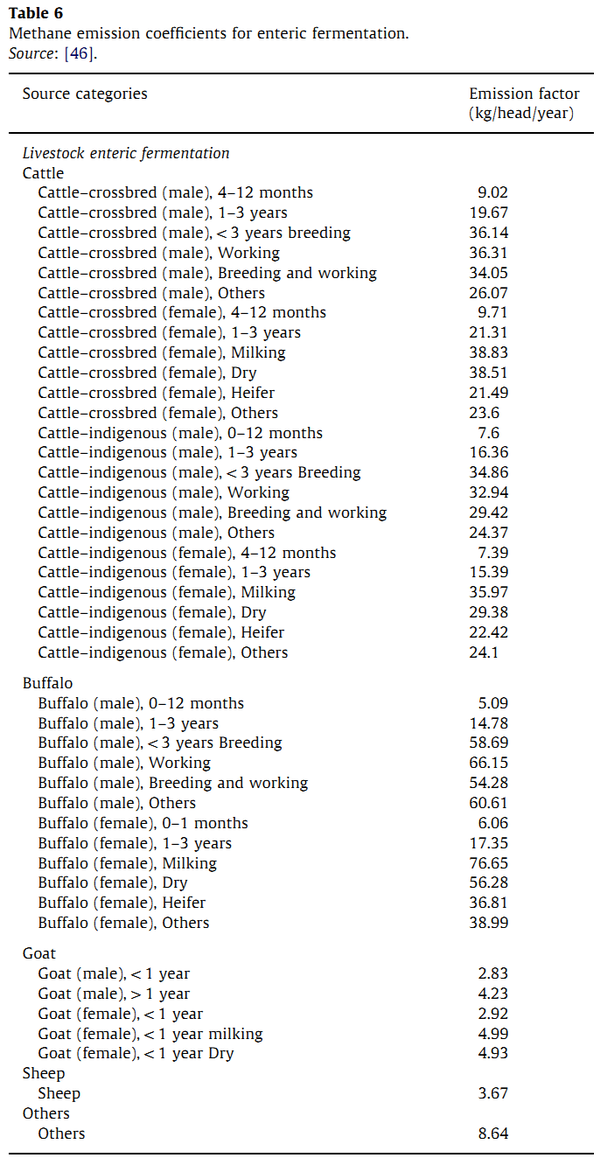
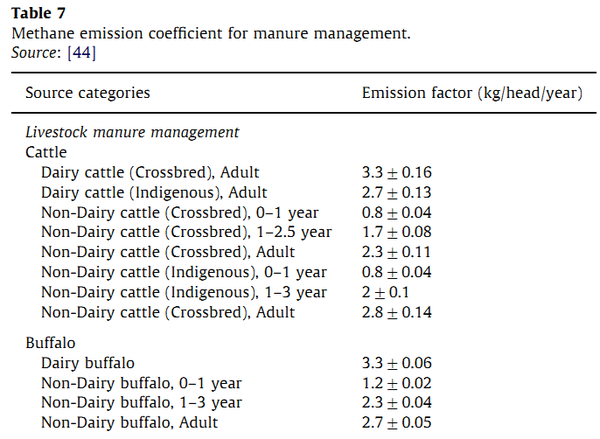
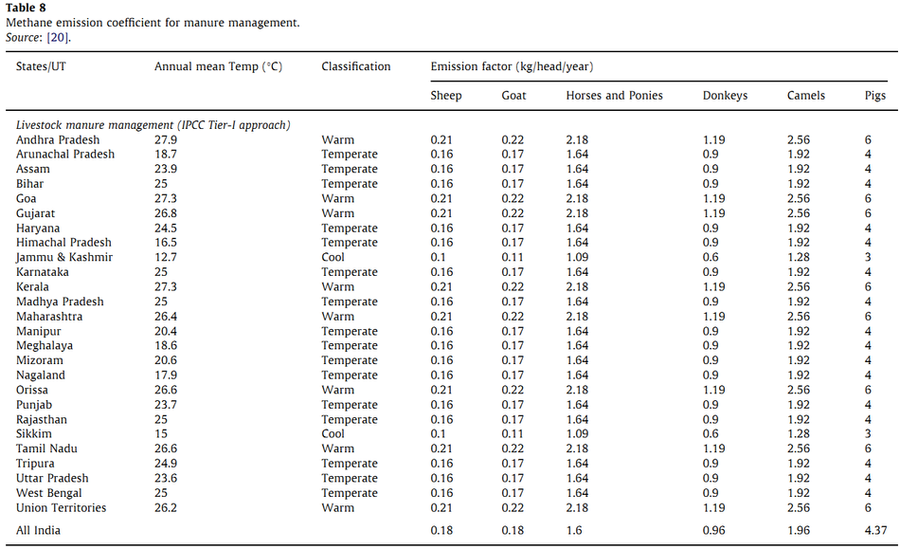
- Livestock: Emission from livestock was calculated using region specific emission factors for enteric fermentation and for manure management of bovines compiled from various literatures [46, 47] for 2003 are listed in Table 6, Table 7 and Table 8. Emission factor (EF) of 2.83 to 76.65 kg/head/year for enteric fermentation, 0.8 ± 0.04 to 3.3 ± 0.16 kg/head/year for manure management of bovines and 0.1 to 6 kg/head/year for manure management of non-bovines were recorded.
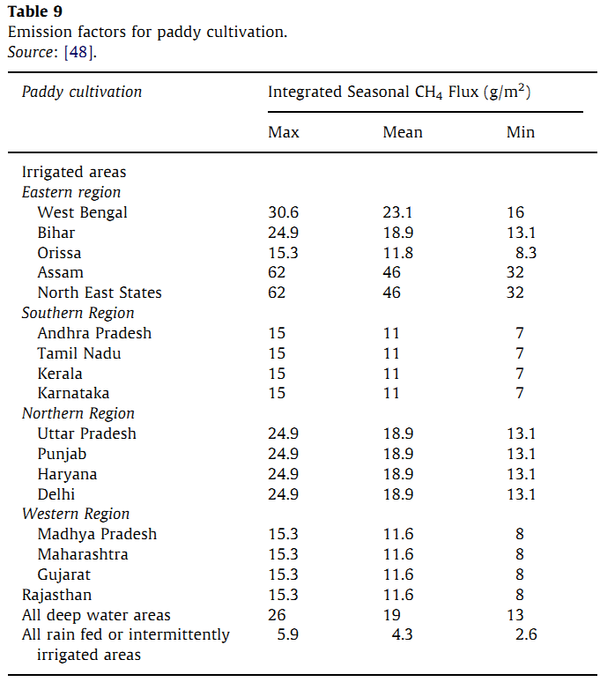
- Rice cultivation: Methane emission from rice cultivation is estimated for year 2004-05. Emission from rice cultivation was estimated using average zone specific emission coefficients for different types of cultivation [48]. Table 9 lists the emission factors used for this sector.
- Waste: Emissions from municipal solid waste depend on the quantity of organic waste. The main GHG emitted from waste is CH4. Methane emission from organic waste is computed for the year 2001. IPCC guidelines have been used to estimate emission as an average of 70% of the waste is reaching the landfill site [49]. Further, IPCC default factors of methane correction factor, fraction of degradable organic carbon, fraction of degradable organic carbon converted to landfill gas, fraction of methane and carbon fractions are used in estimation. The amount of recovered methane and oxidation factor are assumed to be zero.
Quantification of emissions
Electricity production: Electricity installed capacity in the year 2010 [14] and generation (for 2007-08) have been used to compute the emission from coal based thermal power plants. Emissions from gas and diesel based thermal power plants of India were computed based on the total consumption of natural gas and diesel [50] as given in equation 2 and 3:
Ei = ∑ Elegen × Ei,coal (2)
Where, Ei = Emission of compound (i); Elegen = Electricity generation; Ei,coal = Emission of compound (i) from coal thermal power plant.
Ei = ∑ Enej × Ei,j (3)
Where, Ei = Emission of compound (i); Enej = Consumption of energy per type (j); Ei,j = Emission of compound (i) from type (j).
Transport: Emissions from road were quantified based on the number of vehicles and distance travelled in a year per unique vehicle type [29, 32, 33]:
Ei =∑ (Vehj × Dj) × Ei,j,km (4)
Where, Ei = Emission of compound (i); Vehj = Number of vehicles per type (j); Dj = Distance travelled in a year per unique vehicle type (j); Ei,j,km = Emission of compound (i) from vehicle type (j) per driven kilometre.
Industries: Statewise production data of cement and steel industries have been used to compute emission from cement and steel industries for the year 2009 [51]. This is based on the assumption that 1 ton production of steel requires 0.6 ton of coking coal and 1 ton of metallurgical coal. The methodology to estimate the total emission of particular gas from cement and steel industries are given below:
Ei = ∑ Cemp × Ei,cement (5)
Where, Ei = Emission of compound (i); Cemp = Cement production; Ei,cement = Emission of compound (i) from cement industry.
Ei = ∑ Stecoal,j × Ei,j (6)
Where, Ei = Emission of compound (i); Stecoal,j = Consumption of coal per type (j) in steel production; Ei,j = Emission of compound (i) from coal type (j).
Domestic energy: Per capita domestic energy consumption values were used for knowing the consumption of energy in cooking activities. As per Census, 2001, Fuelwood and chips are used in 75% of rural and 22% of urban population, similarly 5% of rural and 44% of urban population use LPG. Also, 3% of rural and 22% of urban population use kerosene in their houses [14]. The total emission of GHG from domestic energy consumption is given by equation 7:
Ei = ∑ Enej × Ei,j (7)
Where, Ei = Emission of compound (i); Enej = Consumption of energy per type (j); Ei,j = Emission of compound (i) from type (j).
Agriculture: Agricultural residue burning: During 2005-06, production of rice, wheat, maize, groundnut, potatoes, soybean and barley are 91.79, 69.35, 14.58, 7.99, 23.91, 8.27 and 1.22 mt respectively [50, 52, 53]. Around 332.90 mt of agricultural residues are generated from these seven major crops of India. The methodology to estimate the total emissions of a particular gas from agricultural residue burning is given below:
Ei = ∑(Agrj × R1,j × R2,j × Dj × F1,j × F2,j × Ei,j,kg) (8)
Where, Ei = Emission of compound (i); Agrj = kg production from agriculture per type (j); R1,j = Residue ratio of crop (j); R2,j = Residue burning ratio of crop (j); Dj = Dry matter fraction; F1,j = Fraction of crop (j) actually burned; F2,j = Fraction actually oxidized in crop (j); Ei,j,kg = Emission of compound (i) from crop type (j) per kg.
Livestock: Livestock includes all sizes of cattle, buffaloes, sheep, goats, pigs, horses, mules, donkeys and camels. As per district census livestock provisional data of 2003, India has 179.82 million cattle, 97.92 million buffalo, 61.47 million sheep and 124.36 million goats [52]. The methodology to estimate the total emission of methane from livestock is given by equation 9:
Ei = ∑(Livj × Ei,j) (9)
Where, Ei = Emission of compound (i); Livj = Number of livestock per type (j); Ei,j = Emission of compound (i) from livestock type (j) per head
Rice cultivation: The area for Indian rice cultivation was about 41.91 Mha during 2004-05 [54] and it was divided into three categories, namely, irrigated, deepwater and rainfed [55]. Emissions from rice cultivation are computed by equation 10:
Ei = ∑(Paddyj × Ei,j,sqm) (10)
Where, Ei = Emission of compound (i); Paddyj = Area of rice cultivation per type (j); j = Type of cultivation (Irrigated, deepwater and rainfed); Ei,j,sqm = Emission of compound (i) from rice cultivation type (j) per sqm.
Waste: The rate of municipal solid waste disposal varies from one state to another state. Statewise waste generated is computed using population statistics and average rate of statewise city waste generation. Emission from waste is estimated by equation 11:
Ei = ∑(Wastej × F1 × M × F2 × F3 × F4 × C) (11)
Where, Ei = Emission of compound (i); Wastej = kg waste generated in year (j); F1 = Fraction of waste disposed at landfill site; M = Methane correction factor; F2 = Fraction of degradable organic carbon; F3 = Fraction of degradable organic carbon converted to landfill gas; F4 = Fraction of methane; C = Carbon fraction
Quantification of Carbon Sequestration Potential:
Carbon sequestration refers to the withdrawal of atmospheric carbon dioxide through soil and trees, and storing the carbon in soil in the form of soil organic matter or as tree biomass in trees. Soils in the forest and agriculture sector have been considered as a potential option to mitigate enhanced level of GHG. Estimates indicate that globally soils store about 16×105Tg of carbon and organic matter constitutes about 5-8% in most soil types depending on the rooting depth.
Agricultural soil: Indian agricultural fields used for growing cereals and pulses cover an area of 112.01 Mha [14] and annually, 0.05 mg/ha of carbon is stored in agricultural soil. This value has been considered to compute the total carbon stored in agricultural soil [56].
Forest soil: Indian forest had covered an area of 67.71 Mha in 2005 [16], which is used to deduce the carbon storage in the year 2005. Annual carbon stored in one hectare was 0.3 t. This value is used to compute the carbon stored in forest soil [57].
Forest biomass: Indian forest covers an area of 67.71 Mha in 2005, which is categorized into 14 different groups based on the statewise forest area available for 1987 [16]. The standing biomass [58, 59, 60, 61, 62, 63, 64, 65, 66] and average crown cover of different groups of forests are used to calculate total standing biomass. Annual net biomass accumulation and carbon uptake is computed based on the percentage of net primary productivity [58, 64, 67, 68] of different forests as per equation (11):
Sj = Forestj × SBj × CCj × NPPj × C (11)
Where, Sj = Annual carbon stored in (j) type of forest; Forestj = Forest area occupied by (j) type of forest; SBj = Standing biomass of forest type (j); CCj = Crown cover of forest type (j); NPPj = Net Primary Productivity of forest type (j); C = Carbon content of biomass.
Carbon Status:
The carbon status, which is the ratio of annual carbon storage and carbon emission for each federal state, is computed. Emission of carbon in the form of CO2, CO and CH4 are converted into its equivalent of CO2. Global warming potential of CH4 is 21 times greater than CO2. Emissions of CO2, CO and CH4 converted into its equivalent of CO2 was used to compute the carbon status of each state and union territory.
|