|
Result and Discussion
1. Wastewater Characteristics
Water samples collected from wastewater pond were rich in nutrients. Euglena species were abundant in wastewater with Amm.-N level of 20 mg/l with higher BOD and COD values of 224 and 362 respectively out of which 50 % i.e. 115 mg/l was only algal BOD (Table 1). These species contributed to higher TSS load of 389-465 mg/l. The TKN values were 44 mg/l with a very minimal nitrification occurring with, nitrate and nitrite values of 0.18 and 0.01 mg/l respectively. It was observed that Euglena sp. were responsible for BOD removal of ~60%, TSS removal of 80% and Amm-N removal of 35%. The wastewater of the treatment ponds showed an algal count of 4.78 X 10⁵ cells/ml. Higher algal cell densities were found on the top 40 cm layer of the treatment plant. Earlier studies have been performed on Scenedesmus sp., Botrycoccus sp., Chlorella sp., Chlamydomonas sp., Micracitinium sp. etc. from primary or secondary treated municipal wastewaters for their lipid content (Table 2).
Table 1: Growth environment of the selected algal species
|
|
Sampling Locations (1,2&3) |
| Parameters |
Units |
Euglena(1) |
Spirogyra(2) |
Phormidium(3) |
| pH |
|
7.78 (+0.43) |
8.4 (+0.35) |
8.3 (+0.23) |
| Temperature |
°C |
28.1 (+1.60) |
24.5 (+0.08) |
23 (+0.75) |
| Salinity |
mg/l |
566 (+18.19) |
423 (+14.2) |
428 (+12) |
| Total Diss. Solids (TDS) |
mg/l |
968 (+62.36) |
792.85 (+17) |
736.75 (+8) |
| Total Suspended Solids (TSS) |
mg/l |
389 (+153.17) |
103 (+24.5) |
277 (+34.6) |
| Turbidity |
NTU |
176 (+24.5) |
81.1 (+8.4) |
104.8 (+12.7) |
| Electical Conductivity(EC) |
µS/cm |
1138 (+32.96) |
888 (+14) |
862 (+22) |
| Dissolved Oxygen(DO) |
mg/l |
5.8 (+3.72) |
18.2 (+2.8) |
0 (+00) |
| Chemical Oxy. Demand(COD) |
mg/l |
362.7 (+90.88) |
104.44 (+7.7) |
122.22 (+3.85) |
| Filterable COD |
mg/l |
109.3 (+14.84) |
74.7 (+12.2) |
88.4 (+14.4) |
| BiochemicalOxy.Demand(BOD) |
mg/l |
224 (+78.50) |
62.64 (6.08) |
86.58 (+3.69) |
| Filterable BOD |
mg/l |
36.2 (+4.59) |
18.6 (+4.16) |
31.6 (+8.09) |
| Nitrates |
mg/l |
0.181 (+0.01) |
0.77 (+0.01) |
0.33 (+0.02) |
| Nitrites |
mg/l |
0.0138 (+0.03) |
UD |
UD |
| Ammoniacal-N |
mg/l |
20.54 (+.23) |
9.54 (+3.42) |
16.66 (+1.27) |
| Total Kjeldahl Nitrogen (TKN) |
mg/l |
43.68 (+10.96) |
22.4 (+3.75) |
18.6 (+4.68) |
| Inorganic Phosphates |
mg/l |
6.75 (+0.41) |
3.06 (+0.24) |
2.39 (+0.41) |
| Total Phosphates (TP) |
mg/l |
7.81 (+1.72) |
13.1 (+0.75) |
9.92 (+1.46) |
| Alkalinity |
mg/l |
560 (+30.55) |
346.67 (+5.77) |
326.67 (+5.6) |
| Carbonates |
mg/l |
40 (+23.09) |
20 (+10.5) |
20 (+0) |
| Bicarbonates |
mg/l |
520 (+41.6) |
326 (+24.5) |
306 (+17.2) |
| Ca |
mg/l |
56 (+3.51) |
66.35(+1.15) |
68.08 (+3.46) |
| Mg |
mg/l |
36 (+2.52) |
24.14 (+1.07) |
28.16 (+2.43) |
| Total Hardness |
mg/l |
288 (+2.31) |
193.33 (+1.5) |
225.33 (+1.15) |
| Na |
mg/l |
208 (+3.51) |
152.8 (+2.4) |
151 (+4.6) |
| K |
mg/l |
44 (+2) |
38.3 (+0.5) |
34 (+0.5) |
| Chlorides |
mg/l |
122 (+1.73) |
104.13 (+0.82) |
112.18 (+1.42) |
| Sodium Absorpt’n Ratio (SAR) |
|
30.66 (+2.5) |
22.71 (+14.2) |
21.76 (+7.6) |
| ORP |
mV |
58 (+10.6) |
28 (+8) |
-178 (+24) |
| Total Organic carbon (TOC) |
mg/l |
65 |
6 |
14 |
Table 2: Algal lipid dry weight content in different wastewaters
| Municipal Wastewater |
Algal species |
Lipid (%dry wt.) |
Reference |
| Primary treated |
mixed sp. |
28 |
[60] |
| Secondary treated |
Scenedesmus obliquos |
31.4 |
[62] |
| Secondary treated |
Botryococcus brauni |
17.85 |
[65] |
| Primary treated + CO2 |
Micracitinium sp., Actinastum
sp. Chlorella sp. (mixed) |
9 |
[66] |
| Centrate |
Chalmydomonas reinhardtii |
25.25 |
[61] |
| Facultative pond(STP) |
Euglena sp. |
24.6 |
Present study (2011) |
| Varthur Lake |
Spirogyra sp. |
18.4 |
Present study (2011) |
| Varthur Lake |
Phormidium sp. |
8.8 |
Present study (2011) |
Blooms of Spirogyra species were observed in the shallow waters at a comparatively lower level of Amm-N (9.54 mg/l) in the wastewater fed Varthur lake (Table 1). BOD and COD of the region were moderately high (Table 1). Dissolved oxygen levels of ~18 mg/l (Mid-day) were higher due to algal photosynthesis with reasonably high phosphate levels (Table 1). Phormidium species were prevalent as floating masses and to a smaller extent attached to the substratum near the outlets of Varthur lake in a highly reducing environment having an ORP of -214 mV with a slightly higher BOD, COD and lower Amm-N values (Table 1).
2. Lipid potential and algal-biomass productivities in urban wastewater systems
In case of Euglena sp., 10 litres of the wastewater sample concentrate yielded 5.1 grams of algal biomass on a dry weight (wt.) basis. Considering the period for the peak exponential growth as seven days, and the oil content as 24.6 %, the area required for wastewater treatment as 10 hectares, the lipid potential of Euglena sp. under such high ammonia conditions is 6.52 tonnes/ha/annum (Figure 2). Similarly, from a quadrate of 1 m2 from Varthur lake 480 g wet wt. of Spirogyra sp. was collected that yielded 20.37 g of dry wt. The total lipid content observed was 18.4%. For a sampled area of 1m2 plot 3.74g of oil could be derived and the estimated lipid potential is 1.94 tonnes/ha/annum (Figure 2). Phormidium species are mostly found to be near the shallow regions and are mostly as floating masses and also with forms attached to substratum. From a plot of 1 X 1 m quadrate, 257.5 g wet wt. was collected, dry wt. content was 62 g and the total lipid content was 8.86%. Oil yield of these species is about 54.93 Kg/ha and the lipid potential is about 2.856 tonnes/ha/annum.
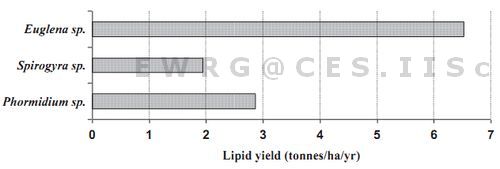
Figure 2: Annual lipid yield of the select algal species in urban wastewaters
The mean insolation for India is about 5 KWh/m2/day with the range 4-7 KWh/m2/d [35]. In terms of energy it is expressed as 6.57 X 10⁹ Joules/m2/yr. Therefore the amount of solar energy falling over each hectare of land equals to 6.57 X 10¹³ J/ha/yr. Assuming that diesel uniformly contains 42 GJ/tonnes of energy and considering the current field productivities of the wastewater samples and lipid content as 20% on a dry wt. basis the energy equivalent for the diesel component of the biomass in dry wt. figures to 2.1X10¹¹ J. Thus the photosynthetic efficiency on lipid is only 0.31 %. The algal biomass yield from the wastewater under such conditions, accounts to 26 tonnes/ha/annum and the annual productivity of lipids is around 5 tonnes/ha. The total wastewater generated in the country is approximately 1,70,000 MLD based on the national wastewater statistics along with the census data for population [36]. According to the current growth rates of algae in lagoons and treatment ponds, an area of ~8,45,000 hectares is required to convert the wastewater nutrients into algal biomass and consequently lipid for catering to the growing energy requirement. The lipid potential for the country based on the algae potential state-wise is depicted in Figure 3. Availability of wasteland throughout the country as per the data obtained from National Remote Sensing Centre, Hyderabad [37] gives scope for creating algal ponds to treat wastewater and also to generate oil. The ratio of the wasteland availability to the land requirement for algal pond construction for lipid production has been illustrated in Figure 3. The higher the value, the higher is the feasibility of the acquirement of the land for simultaneous wastewater treatment and lipid production through wastewater fed algal ponds.
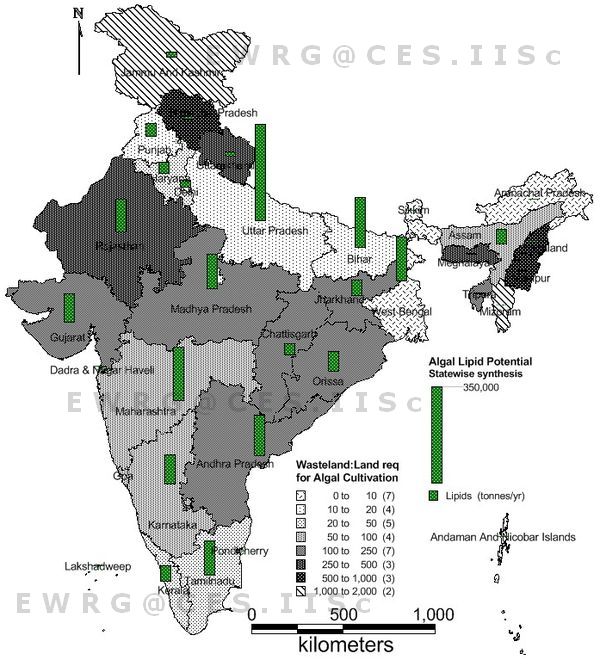
Fig. 3. Biofuel potential (t/year) of wastewater with available wasteland (for growing algae). The bar plots indicated the biofuel potential of the states a nd the shades
(legends ascribed in the region show the ration between the wasteland to land required for algal Cultivation.
It was estimated that under present environmental conditions, about 5 tonnes/ha/yr can be achieved annually from wastewater algal ponds considering ~20% lipid content on a dry wt. basis. Other studies conducted at the NREL projected 50-300 tonnes/ha in closed PBR’s [38]. However studies conducted elsewhere predicted 22.87-137.25 tonnes/ha/yr at about 30-70 % oil on a dry wt. basis [5]. Both the projections mentioned above are far higher that can be really achievable in field conditions.
3. Total Lipid content
Earlier studies have revealed varied lipid accumulation and lipid content under various environmental conditions. The lipid content ranges from 20-50% in Scenedesmus sp. at varied N and P concentrations [39] and 42% in Chlorella sp. grown in wastewater in a semi-continuous mode with effective COD, NH3-N and P removal [40]. The total lipid content of Botryococcus braunii was reported to range from 26 to 86% of the dry weight [41].
The total lipid contents for the algae analysed in this study ranged from 6.18 to 31% of the dry weight. Lipid content for Phormidium sp. (6.2-11.5%) was comparatively lower than that of Spirogyra sp. (18.4-20%). The highest lipid content was observed in the Euglena sp. (24.6-31%) that is comparable to the earlier reports [49] and higher values are reported in some studies [44]. The details of which are illustrated in Table 3. However, the lipid content of Phormidium sp. was 50 % of what was reported earlier [42], and were comparable to the other studies [43] as given in Table 3. The total lipid content in Spirogyra sp. was comparable with the values reported in earlier studies [44] and was relatively higher than many other studies [45-48].
Table 3: Fatty acid composition of select algal species. (*LP-Light phase; DP-Dark Phase)
| Algae |
Total lipids |
Major Fatty acids composition |
Source |
| Euglena |
|
|
|
| Euglena gracilis (LP) |
-- |
[18:3(55.1%)>16:1(9.1%)>18:2(9%)>16:0(8%)] |
[57] |
| Euglena gracilis (DP) |
-- |
[14:0(37.9%)>16:0(29.3%)>16:2(15.8%)>18:2(3.5%)] |
[57] |
| Euglena gracilis |
27.20% |
[18:3(31%)>16:0(25.2%)>16:4(14.8%)>18:0+16:3(7%)] |
[49] |
| Euglena gracilis |
14-20% |
-- |
[60] |
| Euglena sp. |
24.6-31% |
[16:0(24.05%)>14:0(20.25)>18:0(15.36)>18:1(6.58%)] |
Present Study(2011) |
| Spirogyra |
|
|
|
| Spirogyra sp. |
11.9-16.1% |
[18:1>16:1>16:0>18:2>18:3] |
[45] |
| Spirogyra sp. |
11-21% |
-- |
[44] |
| Spirogyra crassa |
5.60% |
[16:0>18:2>18:3] and 20:4, 20:5(minor) |
[46] |
| Spirogyra sp. |
7.30% |
-- |
[47] |
| Spirogyra sp. |
14.82% |
[18:1(33.3%)>16:0(25.25)>18:2(10.8%)>14:0(6.4%)] |
[48] |
| Spirogyra sp. |
18.4-20% |
[16:0(52%)>18:0(17%)>18:1(16%)>14:0(2%)] |
Present Study(2011) |
| Phormidium |
|
|
|
| Phormidium corium |
5.60% |
[16:0(35%)>18:1(30%)>16:2(14%)>16:1 (13%)] |
[58] |
| P jenkelianum |
4.50% |
[18:1(36%)> 16:0(29%)>16:1(19%)>18:2(11%)] |
[58] |
| P tenue |
-- |
[18:0>18:3] |
[59] |
| Phormidium sp. (LP) |
11% |
[16:0(21%)>18:0(12.7%)>18:1(11.3%)>16:1(11%)] |
[43] |
| Phormidium sp. (DP) |
9.40% |
[16:0(29%)>18:0(12.9%)>18:1(6%)>16:1(4%)] |
[43] |
| P laminosum |
-- |
[16:1Δ9(32 %)>16:0(31%)>18:1Δ9(12 %)>16:3(9%)] |
[63] |
| P tenue |
10.95% |
-- |
[64] |
| P purpurescens |
26% |
[16:0(39%)>18:2 Δ9,12(18%)>18:1Δ9(9%)>18:0(5%)] |
[42] |
| P ambiguum |
10% |
[16:0(9%)>24:0(7%)>12:0 (5%)] |
[42] |
| Phormidium sp. |
6.18-11.54% |
[16:0(40.2%)>18:0(22%)>18:1(21.7%)>18:1Δ9(8.8%)] |
Present Study(2011) |
4. Comparison of lipid extraction methods
The best yield was obtained using sonication among different extraction and cell disruption techniques. Palmitic acid, stearic acid and oleic acid were commonly dominant in all the three tested algal samples. The highest amounts of these crucial fatty acids from a biodiesel perspective were obtained using sonication (Figure 4) which is in agreement with earlier studies [25, 50-51]. A number of studies on the comparative analysis of the various extraction methods have been conducted (Table 4). Algal cell disruption by maceration is one among the common and cost-effective methods for deriving lipids and has been proved to the best among other techniques [52-53]. In the present study maceration technique proved to provide better lipid yields compared to bead-beating.
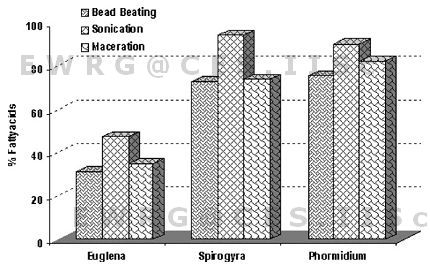
Figure 4: Fatty acids (%) from select algae species – comparative analysis of disruption techniques
Table 4: Comparison of different cell disruption techniques and the efficient method for better lipid recovery
* bacteria; # yeas
| Algae |
Approaches |
Efficient Method |
Source |
Egregia menziesii, Chondracanthus canaliculatus,
Ulva lobata |
Mechanical homogenisation |
Maceration |
[52] |
| E. coli*, B. subtilis*, S. cerevisiae # |
Mech.: Bead mill, Sonication, High press. Homogeniser, Microfluidizer homogenizer.
Non Mech.: Physical disruption, Chemical
permeabilization, Enzymatic disruption |
Bead Milling |
[23] |
| Enteromorpha intestinalis, Enteromorpha clathrata, Ulva lactuca, Codium tomentosum,Hypnea valentiae, Padina gymnospora |
Mechanical methods |
Maceration |
[53] |
| Spirulina maxima, Chlorella vulgaris, Scenedesmus obliquus, Dunaliella tertiolecta, Nannochloropsis, Neochloris oleabundans |
Soxhlet, Sonication |
Sonication |
[50] |
| Scenedesmus dimorphus, Chlorella protothecoides |
Bead-beater, French press, Sonication, Wet milling |
Wet milling |
[22] |
| Scenedesmus sp. |
Soxhlet, Vortex, Soxhelt (n-Hexane), Sonicator (CHCl3-MeOH) |
Sonication |
|
| Botryococcus sp., Chlorella vulgaris, Scenedesmus |
Autoclave, Bead beating, Microwave, Sonication, Osmotic shock |
Microwave |
[24] |
| Chlorella sp., Nostoc sp., Tolypothrix sp. |
Autoclave, Sonication, Osmotic shock, Microwave, Bead beating |
Sonication |
[25] |
| Nannochloroppsis sp. |
Microwave-assisted extraction at various cond’s |
Supercritical cond’s |
[54] |
| Synechocystis PCC 6803 |
Electroporation |
Pulsed Electric-Field |
[55] |
| Euglena sp., Spirogyra sp., Phormidium sp. |
Bead beating, Maceration, Sonication |
Sonication |
Present Study, 2011 |
Many of the other studies acquired high yields with bead milling technique. Among the various techniques applied for cell disruption as bead milling, high press homogeniser, micro-fluidiser homogeniser and methods as chemical permeabilisation and enzymatic disruption, the bead milling method was the most efficient [23]. However wet-milling was efficient among bead-beater, French press and sonication [22]. Other advanced cell disruption techniques were also employed in many studies viz. microwave assisted digestion [25] at supercritical conditions [54]; pulsed electric field [55]. A detailed comparative account of various cell disruption approaches and efficient methods of extraction is illustrated in Table 4.
5. Fatty acid composition
GC-MS analyses of the fatty acids through chromatograms illustrate peaks of the fatty-acid methyl esters in Figures 5, 6 and 7 for Euglena sp., Spirogyra sp. and Phormidium sp. respectively. Tables 3 and 4 lists the order and composition (saturates and unsaturates) of fatty acids.
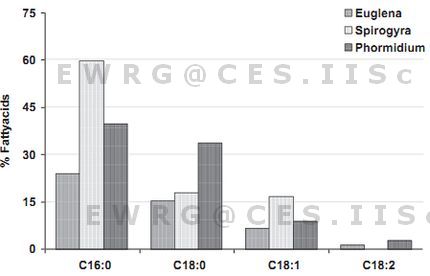
Figure 5: Fatty acids (%) through Sonication
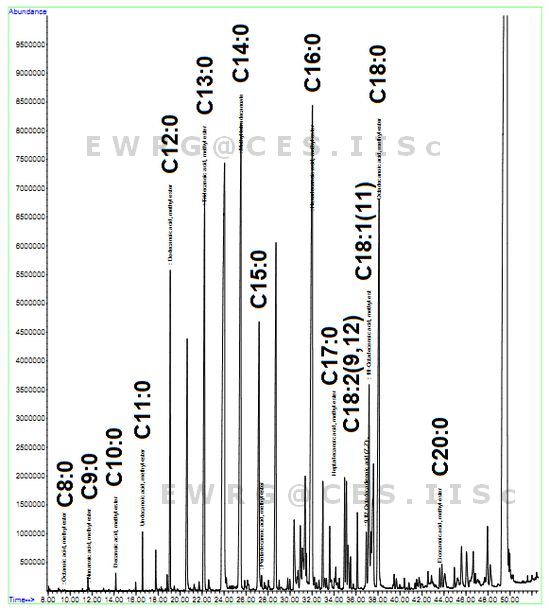
Figure 6: FAME Chromatogram- Euglena sp.
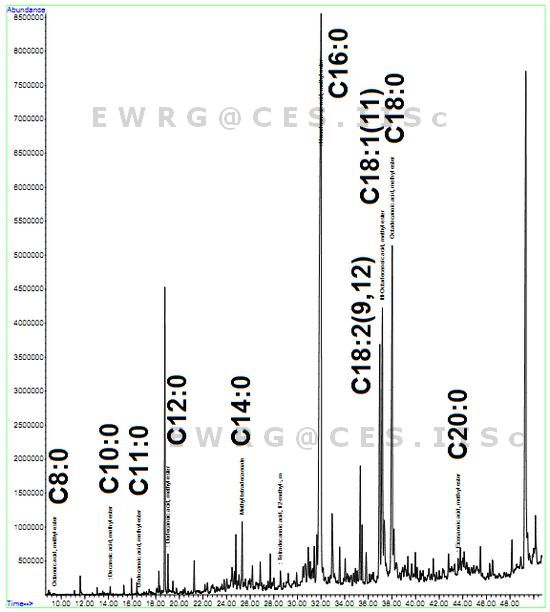
Figure 7: FAME Chromatogram- Spirogyra sp.
In Euglena sp., the yield of important fatty acids (from a biofuel perspective) was lower than 50% but in case of Spirogyra sp. and Phormidium sp.the yield approached 90% using sonication. The important fatty acids obtained from each algae using bead beating, maceration and sonication were compared and are depicted in Figure 3. The results are in agreement with earlier studies where palmitic acid (C16:0), stearic acid (C18:0), oleic acid (C18:1), linoleic acid (C18:2) were recognized as the most common fatty acids contained in biodiesel providing a reasonable balance of fuel properties [56]. Earlier studies showed the accumulation of unsaturates (18:3>18:2) followed by saturates (16:0) as the major fatty acid component [48, 57] during the light phase. However the experiments conducted in the dark phase yielded a very high proportion of saturates (14:0>16:0) compared to unsaturates (16:2>18:2) [46] the details of which are provided in Table 3. Other studies have showed higher oleic acid content followed by palmitate and lineolate in Spirogyra sp. [44, 48].
Phormidium sp. comprised higher amount of palmitate, decent amount of stearate and oleate followed by a small amount of linolenic acid (Table 5). This is in agreement with the earlier studies on Phormidium sp. in both light and dark phases [43], where the main components of the fatty acids were saturates followed by unsaturates. In most of the studies in Phormidium as in the present study, palmitic acid have been consistently the major fatty acid [58, 42-43] with few exceptions [59] where the dominant fatty acid are stearate (18:0) in P. tenue and linolieate (18:1) followed by palmitate (16:0) in case of P. jenkelianum [58]. Spirogyra sp. and Phormidium sp. with higher amount of biofuel type fatty acids has proved to be a reasonably good candidate for biodiesel production [47].
Palmitate was highest in Spirogyra sp. i.e. approximately 60% compared to Phormidium sp. (40%) and Euglena sp. (24%). Similarly, Spirogyra sp. had the highest oleic acid, followed by Phormidium sp. and Euglena sp. (Table 5). The results of important fatty acid composition in Spirogyra sp. are in agreement with earlier study where there is higher palmitate content followed by stearate [46]. The present analysis showed a total of 21 types of fatty acids and the number of fatty acids detected in Euglena sp. (Figure 5), Spirogyra sp. (Figure 6) and Phormidium sp. (Figure 7) were 16, 13 and 15 respectively (Table 5). It was observed that in majority tetradecanoic acid (C14:0), hexadecanoic acid (C16:0), octadecanoic acid (C18:0) and eicosanoic acid (C20:0) were common among saturates and 11-Octadecenoicacid (C18:1), 9, 12-Octadecadienoic acid (C18:2) were present in all the three populations, where as Docosanoic acid (C22:0) was present only in Phormidium sp. and Pentadecanoic acid (C15:0) and Nonanoic acid (C9:0) were only present in Euglena sp. members. Of the 23 fatty acids, 9 were present in all three populations. The percentage of saturates were higher followed by mono-enes, di-enes and in all the three algal species (Table 6).
Table 5: Fatty acid compositions of algal species with different cell disruption techniques
| |
|
Euglena |
Spirogyra |
Phormidium |
| CN: U (%) |
Fatty acid methyl esters |
Bead. |
Soni. |
Mace. |
Bead. |
Soni. |
Mace. |
Bead. |
Soni. |
Mace. |
| C8:0 |
Octanoic acid, methyl ester |
- |
0.002 |
- |
0.059 |
0.043 |
1.005 |
- |
0.061 |
- |
| C9:0 |
Nonanoic acid, methyl ester |
- |
0.022 |
- |
- |
- |
- |
- |
- |
- |
| C10:0 |
Decanoic acid, methyl ester |
0.128 |
0.23 |
0.081 |
0.235 |
0.183 |
2.706 |
- |
0.345 |
- |
| C11:0 |
Undecanoic acid, methyl ester |
0.565 |
0.688 |
0.407 |
- |
0.021 |
- |
- |
- |
- |
| C12:0 |
Dodecanoic acid, methyl ester |
6.05 |
6.146 |
5.351 |
1.324 |
1.221 |
13.306 |
8.297 |
1.95 |
2.778 |
| C13:0 |
Tridecanoic acid, methy ester |
14.547 |
11.963 |
13.153 |
- |
- |
- |
0.968 |
0.308 |
0.48 |
| C14:0 |
Methyl tetradecanoate |
26.435 |
20.254 |
23.78 |
2.17 |
2.501 |
9.043 |
11.443 |
2.803 |
5.511 |
| C14:0 |
Tetradecanoic acid, 12-methyl |
- |
- |
- |
0.891 |
- |
0.891 |
- |
- |
- |
| C15:0 |
Pentadecanoic acid, methyl ester |
14.244 |
10.683 |
13.169 |
0.536 |
- |
- |
- |
- |
- |
| C16:0 |
Hexadecanoic acid, methyl ester |
24.063 |
24.049 |
26.605 |
44.958 |
59.707 |
51.907 |
53.893 |
39.754 |
26.968 |
| C16:0 |
7-Hexadecanoic acid, methyl esters |
- |
- |
- |
- |
- |
- |
- |
- |
1.539 |
| C16:0 |
9-Hexadecanoic acid, methyl esters |
- |
- |
- |
1.205 |
- |
- |
- |
0.199 |
0.645 |
| C17:0 |
Heptadecanoic acid, methyl ester |
2.664 |
2.103 |
2.482 |
- |
- |
- |
- |
- |
0.767 |
| C18:0 |
Octadecanoic acid, methyl ester |
4.448 |
15.368 |
6.271 |
12.099 |
17.986 |
22.032 |
21.592 |
33.763 |
10.638 |
| C18:1 |
9-Octadecenoic acid (z)-methyl ester |
2.389 |
- |
4.901 |
21.596 |
- |
- |
- |
4.94 |
38.49 |
| C18:1 |
11-Octadecenoic acid, methyl ester (z,z) |
1.041 |
6.584 |
- |
- |
16.753 |
- |
- |
8.888 |
- |
| C18:2 |
9,12-Octadecadienoic acid (z,z) |
1.86 |
1.311 |
2.088 |
- |
15.805 |
- |
2.809 |
6.053 |
- |
| C20:0 |
Eicosanoic acid, methyl ester |
0.167 |
0.423 |
0.162 |
- |
0.694 |
- |
- |
1.362 |
- |
| C22:0 |
Docosanoic acid, methyl esters |
- |
- |
- |
- |
- |
- |
- |
2.626 |
- |
Table 6: Fatty acids with the degree of unsaturation and order of series
| Algae |
Degree of unsaturation |
Order of series |
| Euglena sp. |
Saturated > monoenes > dienes |
C16:0>C18:0>C18:1>C18:2 |
| Spirogyra sp. |
Saturated > monoenes > dienes |
C16:0>C18:1(9)>C18:0>C18:1(11)>C18:2 |
| Phormidium sp. |
Saturated > monoenes > dienes |
C16:0>C18:0>C18:1>C18:2 |
It is evident from the results that algae grown in wastewater are suitable for biodiesel production, due to their higher essential fatty acids content and biomass productivities. The present study provides an important relation of algal growth and the lipid characteristics in urban wastewaters. In this context these algae grows enormously in wastewaters and at a very high rate during the summer. They can be stated as the nature’s culture to regulate wastewater nutrients at the same time providing variety of options for biomass utilisation. It is thus possible to enhance the nature’s culture by careful optimisation of the required growth conditions for an efficient lipid recovery and sustainable energy generation from the algal biomass. Fatty acid analysis of the three species indicated the existence of the saturates as 16:0, 18:0 and unsaturates as 18:1 and 18:2 which are efficient biodiesel components (Table 7), indicating potential utilities of the wastewater algae Euglena sp., Spirogyra sp. and Phormidium sp. for better energy security together with wastewater treatment and thus foster human welfare Fig. 8.
Table 7: Saturated and Unsaturated neutral lipids in selected algae
| Type of fatty acid |
Composition |
| Saturates |
C8:0, C9:0, C10:0, C11:0, C12:0, C13:0, C14:0, C15:0, C16:0, C17:0, C18:0, C20:0, C22:0 |
| Unsaturates |
C16:1(7), C16:1(9), C18:1(11), C18:1(9), C18:2(9,12) |
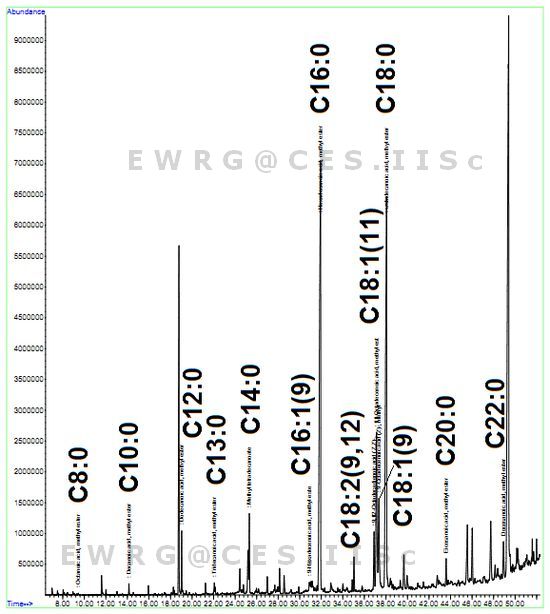
Figure 8: FAME Chromatogram- Phormidium sp.
|
