ANALYSIS, RESULTS & DISCUSSION
Annual and Seasonal Global Solar Radiation
Factors Influencing Radiation Climatology. The quantity of solar radiation reaching the earth's surface during a day is known to be influenced by solar elevation (at noon), the duration of the day as determined by astronomical and geographic factors, turbidity of the air, total amount of water vapor in the air, and type and amount of clouds. Of all these factors, solar elevation and the duration of the day are important. Turbidity and cloud amount cause relatively small variation in the quantity of solar radiation. Altitude also influences global, direct, and diffuse solar radiation (see appendix for terminologies and abbreviations) received at the ground. The solar radiation climatology of any region is determined by all six of these factors, particularly cloud type and amount. The gross solar radiation climatology follows closely the pattern of climatology of low clouds. Based on long-term data collected since 1963 in radiation stations at Goa and Mangalore, mean values of hourly global, direct, and diffuse solar radiation are computed.
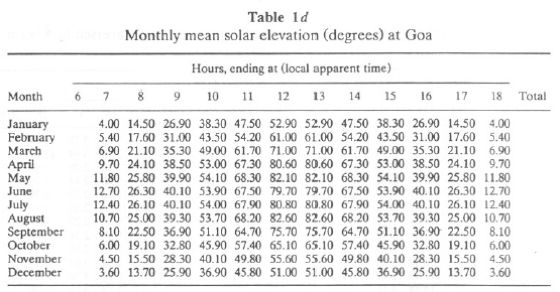
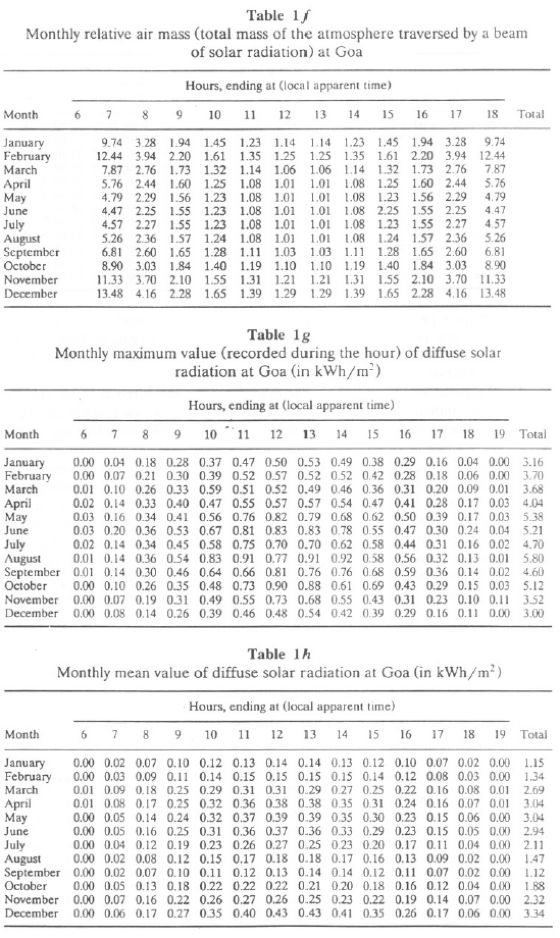
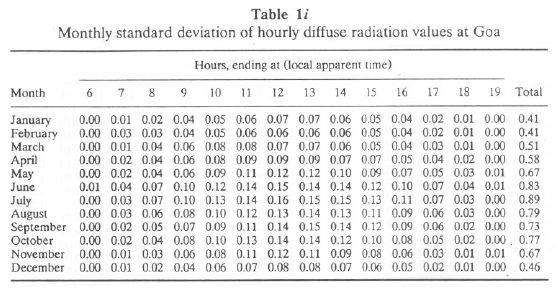
Table 1a lists monthly mean hourly global radiation at Goa, while Tables 1b and 1c list the highest value recorded during the hour, the standard deviation of hourly value. It is seen that the hourly GR is minimum during June-August at Goa. Higher values of standard deviation for the period May-August are due to large day-to-day variability (usually caused by variable cloudiness). Table 1d lists monthly mean solar elevation (in degrees) at Goa. Higher values are seen during the May-August period. Monthly mean hourly values of direct solar radiation are given in Table 1e, and monthly hourly relative air mass is given in Table 1f. Tables 1g, 1h, and 1i list monthly hourly maximum, average, and standard deviation values of diffuse solar radiation.
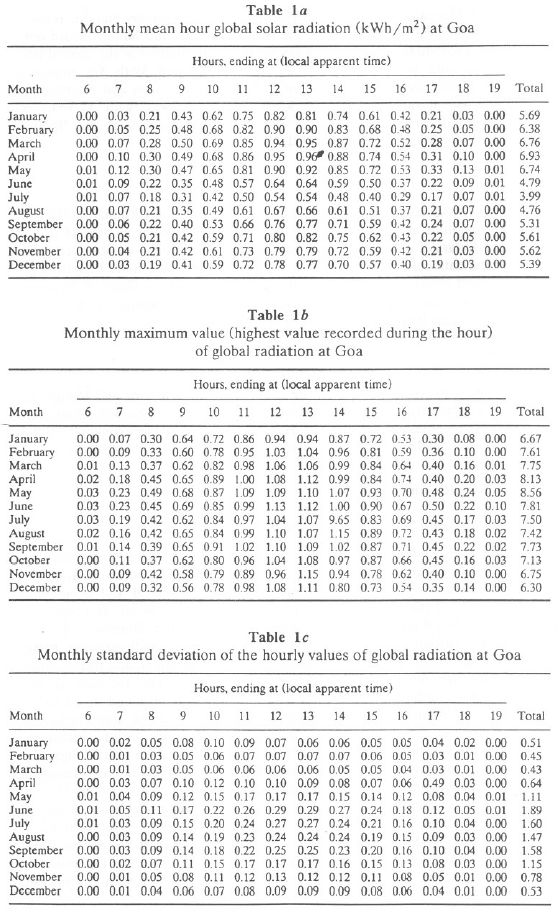
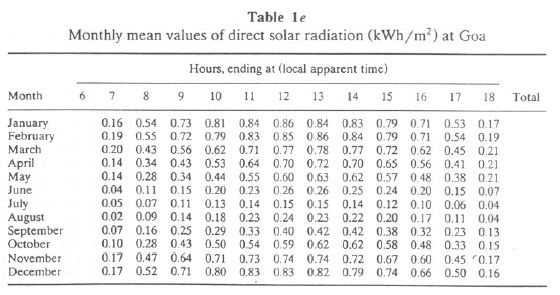
The mean values of direct solar radiation were measured at 0830, 1130, 1430, and 1730 Indian Standard Time (IST) with an Angstrom pyreheliometer. The pyreheliometer observations are recorded only when the sun's disc and surrounding sky are free of clouds.
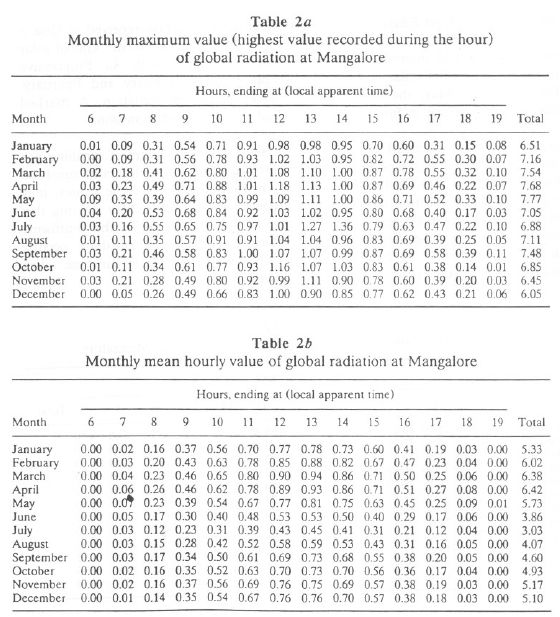
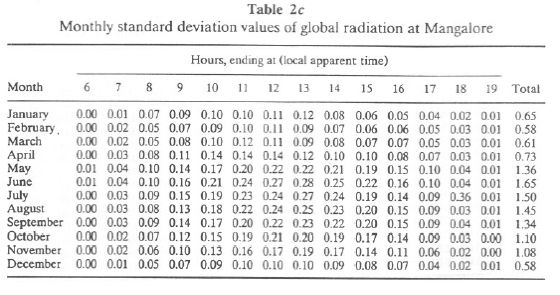
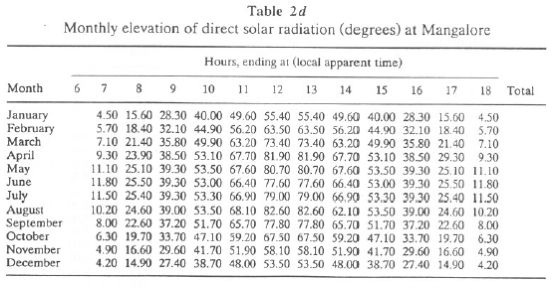
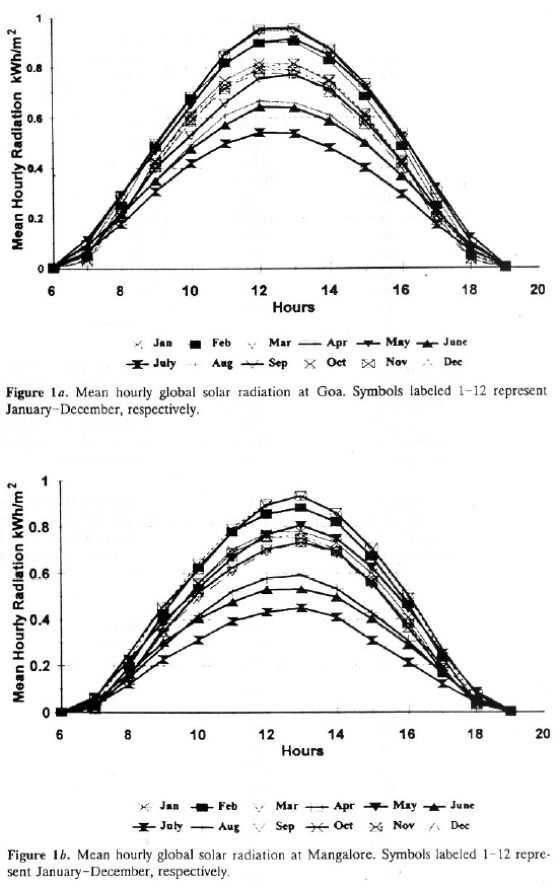
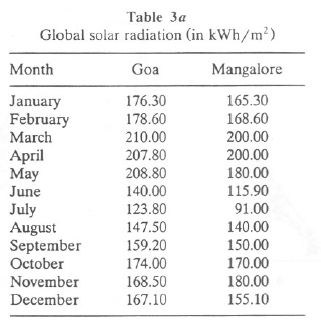
Monthly hourly maximum, mean, and standard deviation values of global radiation for Mangalore are listed in Tables 2a, 2b, and 2c, respectively. Total global radiation ranges from 5.17 (November) to 6.42 (April), while during the monsoon months, it ranges from 3.032 (July) to 4.93 (October). Higher values of standard deviation for the period May-August are due to large day-to-day variability (usually caused by variable cloudiness). Monthly elevation of direct solar radiation for Mangalore is given in Table 2d. Monthly variations in mean hourly global radiation at Goa and Mangalore are illustrated in Figures 1a and 1b, respectively.
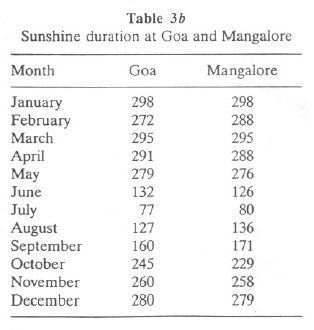
Annual Global Solar Radiation. Annual global solar radiation received at Goa is about 2064.7 kWh/m2, while at Mangalore it is about 1813 kWh/m2. Global solar radiation received monthly at these stations is listed in Table 3a. Progressive increased in global solar radiation takes place during January and February. During March-May, the coastal belt receives maximum radiation. A marked decrease takes place in June with the onset of the southwest monsoon.
Sunshine. At Goa and Mangalore, the average number of hours of sunshine are about 2665 and 2737, respectively. The monthly distribution of hours of sunshine for stations Goa and Mangalore are listed in Table 3b. From these values, it is evident that the duration of sunshine is longest for December-May. During this period, mostly clear sky prevails in the region. With the onset of the southwest monsoon during June-September, a significant reduction in sunshine occurs, dropping to a low of 70-80 hours. From October an increase in sunshine takes place in the coastal belt of Western Ghats region.
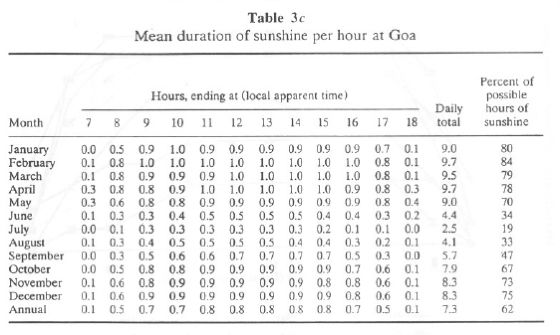
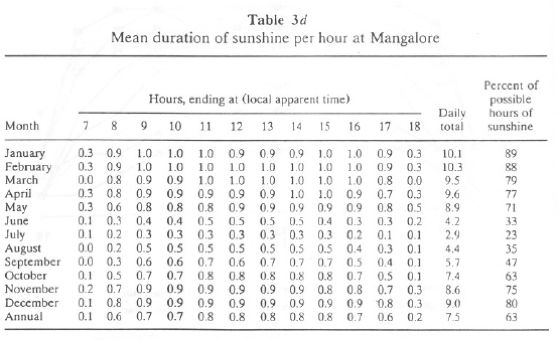
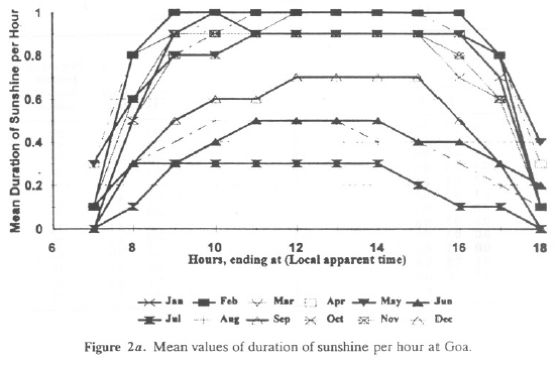
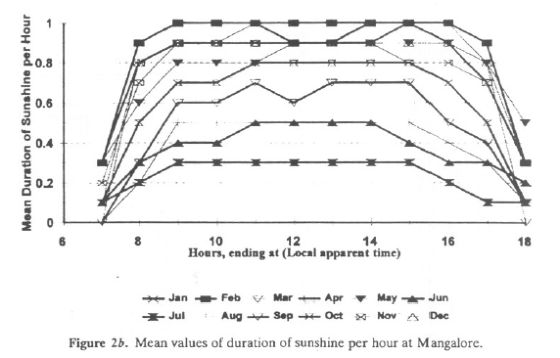
Mean hourly values of the duration of bright sunshine are given in Table 3c (for Goa) and Table 3d (for Mangalore). The daily total columns list the mean duration of sunshine. This is also expressed as a percentage of the maximum possible hours of sunshine. Mean hourly values of the duration of sunshine are illustrated graphically for Goa and Mangalore in Figures 2a and 2b, respectively. Both graphs concur with inferences drawn earlier from monthly values.
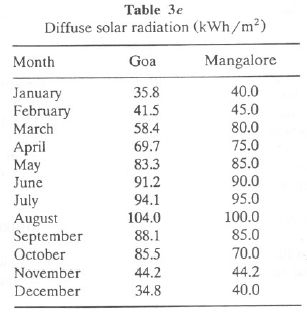
Diffuse Solar Radiation. The annual pattern shows diffused solar radiation of 809.90 kWh/m2 at Goa and 850.00 kWh/m2 at Mangalore which increases southward to 920 kWh/m2 in the extreme of south of the peninsula. This large gradient in diffused solar radiation is associated with gradients in mean annual cloudiness. The monthly distribution of diffused solar radiation is given in Table 3e. In December and January, diffused solar radiation is minimum (35-40 kWh/m2). A general increase takes place during June-August as a result of increased cloudiness and the advance of the monsoon. It reaches maximum (100-105 kWh/m2) during August. Mean hourly values of diffuse solar radiation and standard deviation for the hourly values are listed in Table 1a for Goa. It is seen that diffuse radiation is high for the period 1000-1600 hours during May-July.
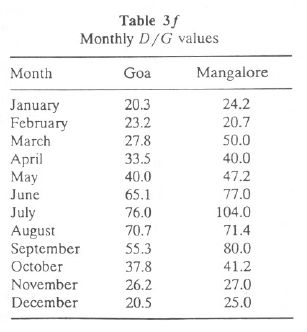
The proportion of diffuse radiation D to global radiation G varies widely, depending on the cloudiness of the sky. The maximum occurs during June-August at these stations and the minimum 20-25% occurs during November-February. During November-February, D/G values undergo characteristic diurnal variation under clear-sky conditions with minimum occurrence during noon and maximum in the morning and evening. Monthly D/G values are listed in Table 3f.
Computation of Global Radiation
Procedure. At sites where no radiation data are available, solar radiation is computed using regression techniques from (1) sunshine and cloudiness and (2) extraterrestrial radiation, allowing for its depletion by absorption and scattering in the atmosphere. There is an obvious relationship between duration of sunshine and amount of solar energy received at the earth's surface. Hence earlier researchers like Kimball (1919), Angstrom (1924), and others used sunshine data to derive empirical formulas for solar radiation estimates (Angstrom, 1924, 1956; Tasdemiroglu and Sever, 1989; Page, 1980, 1989; World Meteorological Organization (WMO), 1981). The statistical relationship formulated between the daily duration of sunshine n and the daily total global radiation G is of the form
G/Go = a + b(n/N)--------- (1)
where Go is the daily global radiation with a cloud-free atmosphere and N is the maximum possible duration of sunshine. In order to compute n/N at places where only cloud cover data are available without mean sunshine duration data, the inverse relationship between sunshine (n/N) and cloud cover (C) is used, which is given by 1 - n/N = C. Since n/N' (where N' is the maximum possible sunshine with solar elevation > or = 5°, in hours) is used for deriving G (Hoyt, 1977), the relationship between n/N' and C is given by
1 - (n/N') = 1C + 0.310(C2) + 0.476(C3) + 0.100(C4) -----------(2a)
Due to difficulties in the precise evaluation of Go in Eq. (1), Go was later replaced by the extraterrestrial radiation (ETR) on a horizontal surface, and the relationship is
(G/ETR) = a + b(n/N) -------------(2b)
Extraterrestrial radiation on a horizontal surface for any place for any day /month can be precisely estimated from the relationship
 ------------(3)
where 10.39 represents the solar constant (assumed equal to 1.36 kW/m2 multiplied by  , k is the correction factor for varying earth-sun distance,
  is latitude,
  is mean monthly declination, and
  is the sunset hour angle in radians.
Coefficient b in Eq. (2b) expresses the rate of increase of G with increase in n / N. For a clear sky, n/ N is unity, and thus the parameter (a + b) is the fraction of ETR that actually reaches the earth's surface. The magnitude of a generally depends on the thickness of the prevailing clouds, and b depends on the transmission characteristics of the cloud-free atmosphere. In the analyses of solar radiation for Canada (Hay, 1979), it was found that the surface albedo plays an important role in determining the magnitude of G in addition to the multiple reflections between the ground and the cloud base or the clear atmosphere. Also, the modified duration of day length N' was considered instead of N, to take into account the fact that the sunshine recorder sensitized card gets burned only when the sun is at an elevation of 5° or above the horizon. Hence, instead of N, N' is
computed as below:

and the relationship used to estimate global radiation at a site is
G'/ETR = a + b(n/N') -----------------(6)
where G' is the global solar radiation that first strikes the ground before undergoing
multiple reflections with the clear atmosphere and the cloud base. The relationship between G and G', assuming albedo of the cloud-free atmosphere as 0.25 and that of the cloud base as 0.60 is given by (Hay, 1979)
G - G' = GR[(0.25n/N') + 0.600 - n/N')] -----------------(7)
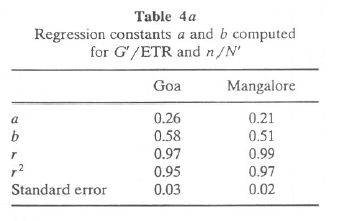
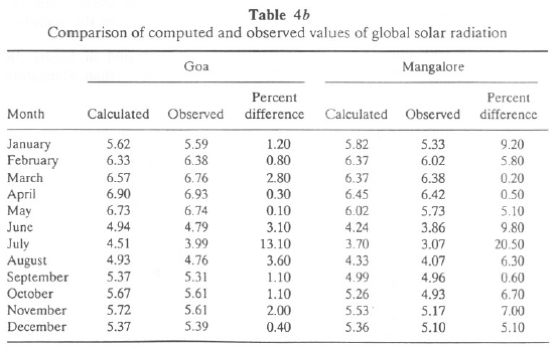
where GR is global radiation. This relationship, Eq. (6) is applied to Goa and Mangalore to see how much the observed and calculated values agree for data of Goa and Mangalore. This exercise would help in estimating global radiation at other locations in the Uttara Kannada district, where radiation data are not available. The regression constants a and b computed for G'/ETR and n/ N' are given in Table 4a, while Table 4b gives the calculated and measured values of G for Goa and Mangalore. It is seen that computed and measured values of G agree within the range of 2-5% for most months. This is shown pictorially in Figure 3a.

Computation of Diffuse Solar Radiation. As in the case of global solar radiation, diffuse solar radiation is given by (Collares-Pereira and Rabl, 1979)
D'/G' = C + D(G'/ETR)
D is computed by D = D' + GR{[0.25(n/N')] + 0.60[1- (n/N')]}.
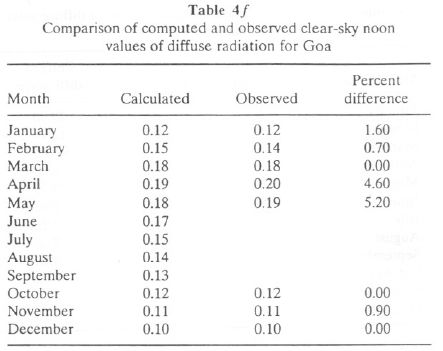
The regression constants c and d computed for D'/G' and G'/ETR are given in Table 4c. Based on this relationship, computed diffuse solar radiation and that actually measured at Goa are given in Table 4d.


Tables 5a (for Goa) and 5b (for Mangalore) list monthly mean values of G, D, IH (daily sum of direct solar radiation, given by IH = G - D), ETR, N, N', and CI (clearness index = G/ETR). CI gives a good measure of the overall transparency of the atmosphere, taking into account the clouding as well as the turbidity and water vapor content.
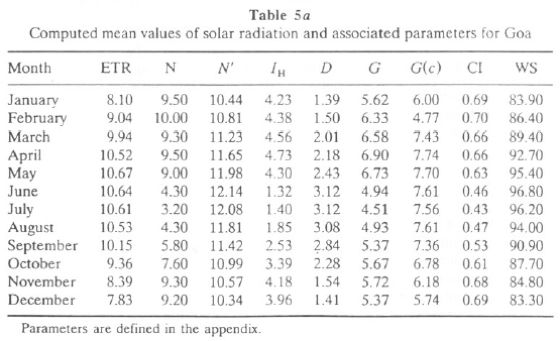
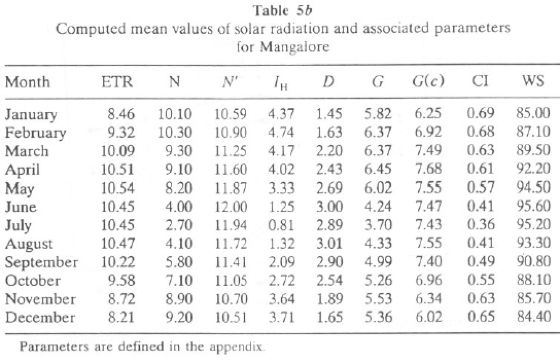
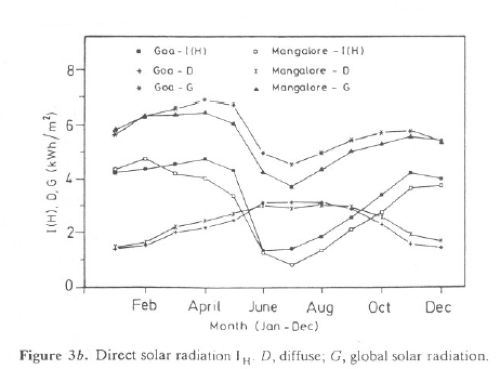
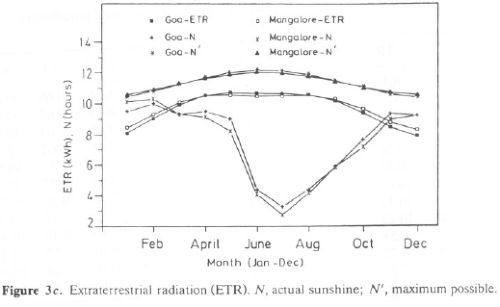
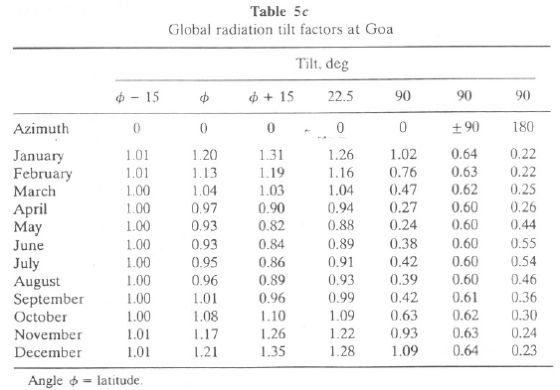
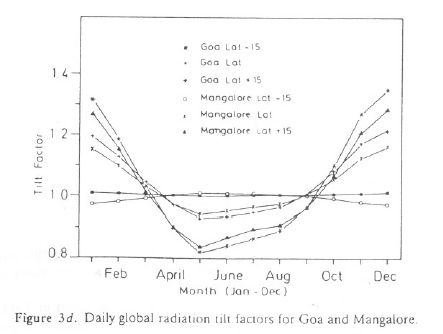
Monthly variation of G, D, and IH are also illustrated in Figure 3b for Mangalore and Goa. It is seen that Goa receives higher G than Mangalore for most months. It peaks in April and reaches its lowest value during July. Figure 3c gives monthly variations of ETR, N, and N' for Goa and Mangalore. ETR, N, and N' are higher for Goa than Mangalore for most months. CI is in the range of 0.5-0.7 during October-April, while it is less than 0.5 during the monsoon period (June-August). WS (sunset hour angle), when divided by 7.5, gives duration of the day in hours. Global radiation tilt factors computed for surfaces facing south for various tilt angles of latitude , + 15°, - 15°, 22.5°, and 90° are listed in Tables 5c (for Goa) and 5d (for Mangalore). This is also illustrated in Figure 3d for Goa and Mangalore. The tilt factors help in estimating global radiation on a sloping surface (by multiplying tilt factor with global radiation on horizontal surface).

Statistical Analyses of Global Radiation Data at Goa and Mangalore
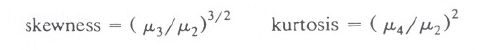
In order to get a complete picture of the solar radiation distribution, we looked at the median and the frequency distribution. For precise estimation of the degree of departure of a given frequency distribution from a symmetrical one, we used the "skewness" factor. Also, we computed "kurtosis" to determine the distortion in the intermediate ranges between the mean and extreme values. Normal distribution has a kurtosis of 3. The distribution having kurtosis < 3 is called platykurtic, has a broader modal part than the normal curve. Kurtosis > 3 is called leptokurtic, and distribution is more sharply peaked than the normal distribution. Skewness and kurtosis computed for distribution of daily global solar radiation is given by
where  = second moment = (
 xi2) / N,
  = third moment = (xi3) / N,
  = fourth moment = (xi4) / N and xi are deviations of the individual values in the series consisting of N items from their arithmetic mean.
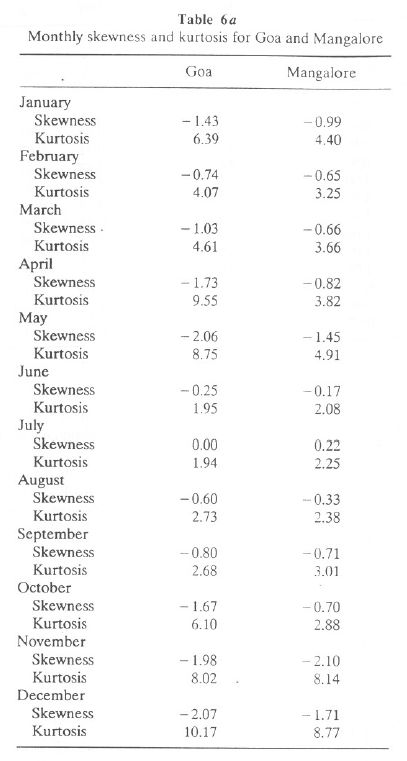
Skewness and kurtosis computed for each month for Goa and Mangalore are listed in Table 6a. It is seen that global radiation values at Goa for June-September have a broader modal distribution. while November-May with kurtosis > 3 has distribution of global radiation values more sharply peaked than the normal distribution. Also, it is seen that, except for July, the global radiation values lower than the mode occur more frequently at Goa and Mangalore.
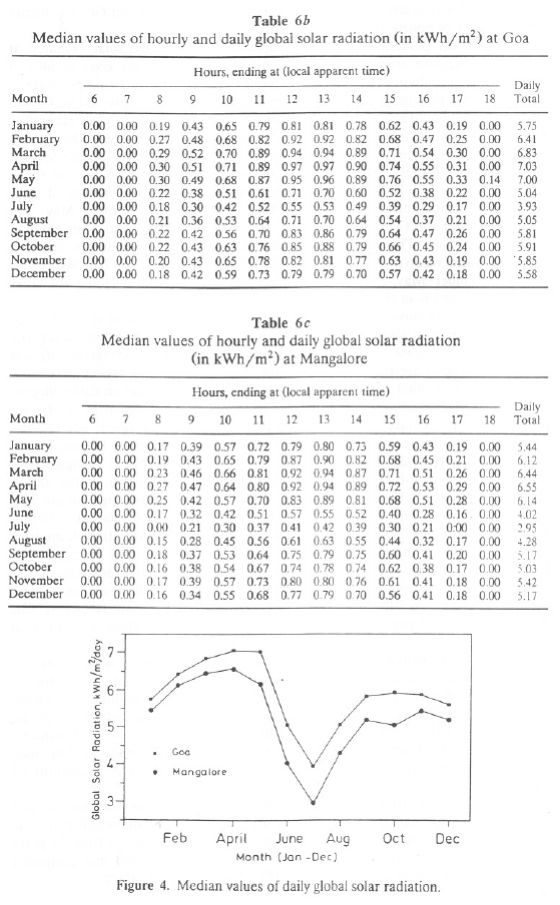
Median values of hourly and daily global solar radiation are listed in Table 6b (for Goa) and Table 6c (for Mangalore) and are illustrated in Figure 4. Figure 4 shows that the median values of hourly global radiation are higher during March-May for Goa and Mangalore. It appears from Figure 4 that Goa has higher median values of hourly global solar radiation for all months.
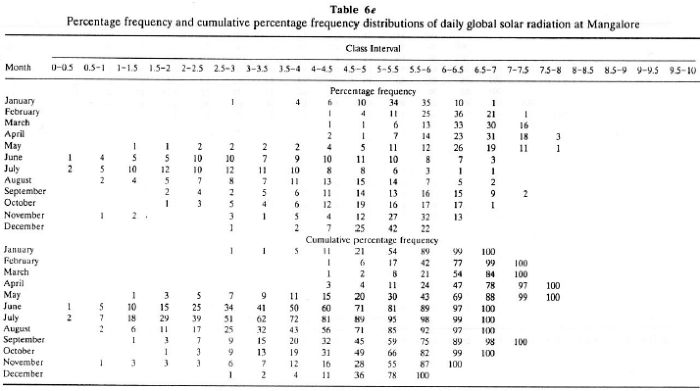
The monthly percentage frequency distributions of global solar radiation at Goa and Mangalore are given in Tables 6d and 6e. This range gives an idea of maximum solar radiation possible in a month and the design of proper backup devices to store the energy for the lean period requirement in a day. Tables 6a and 6b also list cumulative frequency distribution of solar radiation in the range 0-9 kWh/m2/d in steps of 0.5. It is seen that percentage of occurrence in the interval 5.5-7 kWh/m2/d is more during November-May (65-85%) for Goa and Mangalore. For June-August the percentage of occurrence is 55-70% in the range 2.5-5.5 kWh/m2/d.

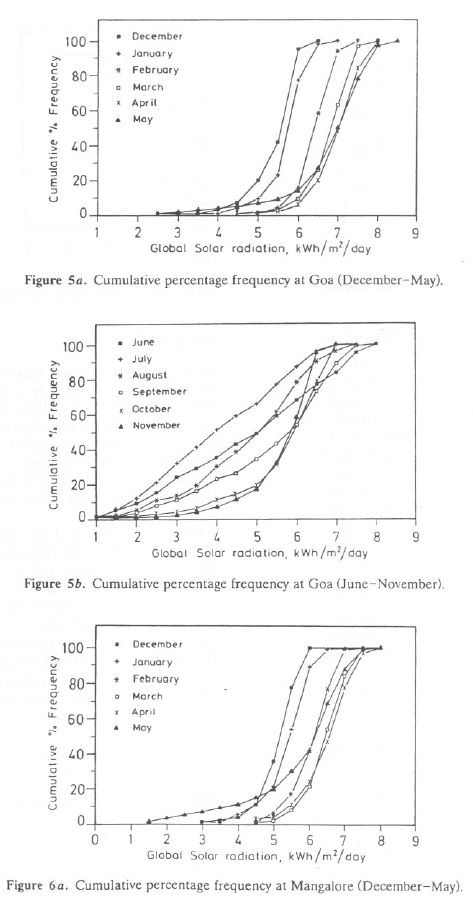
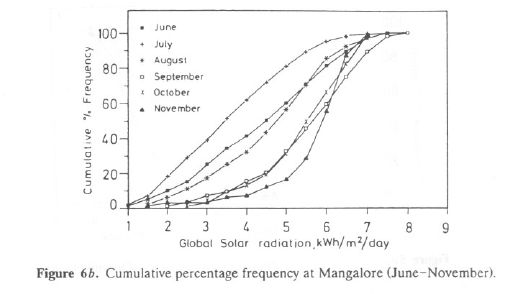
The cumulative percentage frequency distribution of daily global solar radiation is illustrated for the periods December-May and June-November for Goa in Figures 5a and 5b, respectively, and Mangalore in Figures 6a and 6b. These illustrations confirm our earlier conclusions that Goa and Mangalore receive global solar radiation in the range 5.5-7.5 kWh/m2/d during November-May. During June-August and September-October the solar radiation received is in the ranges 2.5-5 and 3.5-6.5 kWh/m2/d. These analyses show that solar potential at Goa and Mangalore is in the range 5-7 kWh/m2/d for about 9 months a year and 3.5-5 kWh/m2/d during the monsoon season. Dense cloud cover for about 10-12 days on average in July and 5-6 days in August are the lean periods for solar energy in this region. With these detailed investigations of daily global solar radiation data collected at Goa and Mangalore, we attempted to assess the solar potential in the Uttara Kannada district. Uttara Kannada consists of three distinct zones, namely, the coastal belt (consisting of the five taluks Karwar, Ankola, Kumta, Honnavar, and Bhatkal), the Sahyadrian interior (consisting of the five taluks Supa, Yellapur, Sirsi, Siddapur, and part of Haliyal), and the plains area (consisting of the taluks Mundgod and part of Haliyal).
Radiation stations at Goa and Mangalore are also in the coastal belt of the Western Ghats region and are located adjacent to Uttara Kannada (Goa is to the north and Mangalore is to the south of Uttara Kannada). The coastal line, covering a distance of 114 km, stretches from Machale near Karwar to Gorte near Bhatkal. The distance between the Goa radiation station and the Karwar climatological station (moving from north to south) is about 60 km, between Karwar and Honnavar is about 72 km, and between Honnavar and Bhatkal is about 40 km. The Mangalore radiation station is about 120 km from Bhatkal.
Karwar and Honnavar are closest to the Goa radiation station, while Bhatkal is closer to Mangalore. The India Meteorological Department has set up climatological stations at Karwar (l4°47'N latitude, 74°08' longitude, elevation 4 m, established in 1877), Honnavar (l4°17'N latitude, 74°27' longitude, elevation 26 m, established in 1935), and Bhatkal (Shirali 04°05'N latitude, 74°32' longitude, elevation 45 m, established in 1974)), where observations are made at least once per day, including daily readings of extreme temperatures and of amount of precipitation.
The computations of daily sums of global radiations at Karwar, Honnavar, and Bhatkal (Shirali) are carried out mainly by using regression relations between solar radiation and sunshine duration. These regression relations derived from 25 years of data collected at Goa and 20 years at Mangalore. It is found that computed values of solar radiation agree within 5-10% of the observed values.
Estimation of Solar Energy in the Coastal Belt of Uttara Kannada
Data for hours of sunshine mean temperature, minimum and maximum daily temperature, relative humidity, and total rainfall, all as monthly averages for Karwar (for the period of 1952-1989), Honnavar (for the period 1939-1989), and Shirali (for the period 1974-1989) provided by the India Meteorological Department (at Pune), have been analyzed and used to estimate solar radiation in the coastal belt of Uttara Kannada. With the knowledge of the regression relation between global radiation and sunshine hours at Goa and Mangalore (which agrees with observed values within 2-5%), we interpolate to determine global radiation in the coastal belt of Uttara Kannada.
Radiation data for Mangalore for the period 1963-1983 and for Goa for the period 1963-1988 obtained from the Indian Meteorological Department and Handbook of Solar Radiation of the Department of Science and Technology, Government of India (Mani, 1980; Mani & Rangarajan, 1982), show the relation between G (global radiation) and hours of sunshine (Eqs. (6) and (7) above).
In addition, in the following section, we try to investigate the influence on global radiation of other climatological parameters such as mean temperature Tm, relative humidity RH, specific humidity SH, rainfall R, and ratio of minimum and maximum temperature  in terms of either a single parameter or multiparameters. SH is used instead of RH to take care of the relatively large variations in RH (Garg & Garg, 1982) and is given by
SH = RH(4.7923 + 0.3647Tm + 0.55Tm2 + 0.0003Tm3)
The different relations obtained considering various climatological parameters are as follows:
G'/ETR = a + b(n/N') ---------------(6' )
G'/ETR = c1 + c2(n/N') + c3Tm ---------------(8)
G'/ETR = d1 + d2(n/N') + d3 ---------------(9)
G'/ETR = e1 + e2(n/N') + e3Y+ e4SH---------------(10)
G'/ETR = f1 + f2(n/N') + f3Tm + f4 SH---------------(11)
G'/ETR = g1 + g2(n/N') + g3 Tm + g4 RH--------------- (12)
G'/ETR = h1 + h2(n/N') + h3 Tm + h4 SH + h5 R---------------(13)
G'/ETR = j1 + j2(n/N') + j3 Tm + j4 RH + j5R---------------(14)
G'/ETR = k1 + k2(n/N') + k3 (n/N')2 ---------------(15)
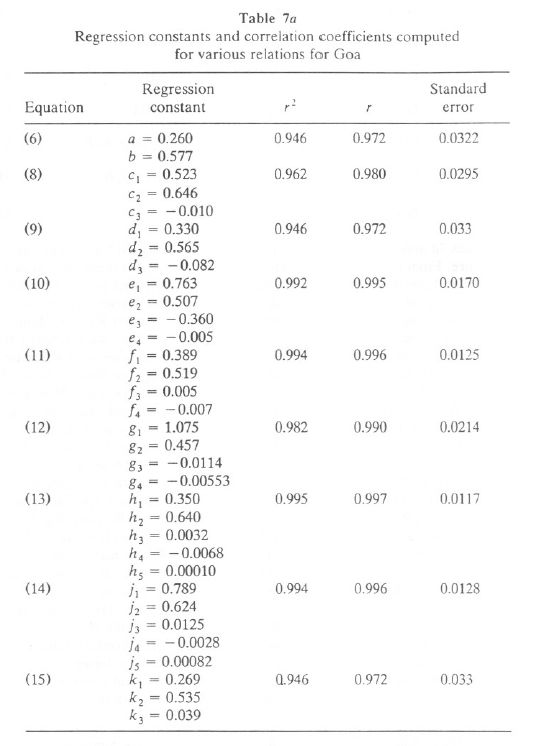
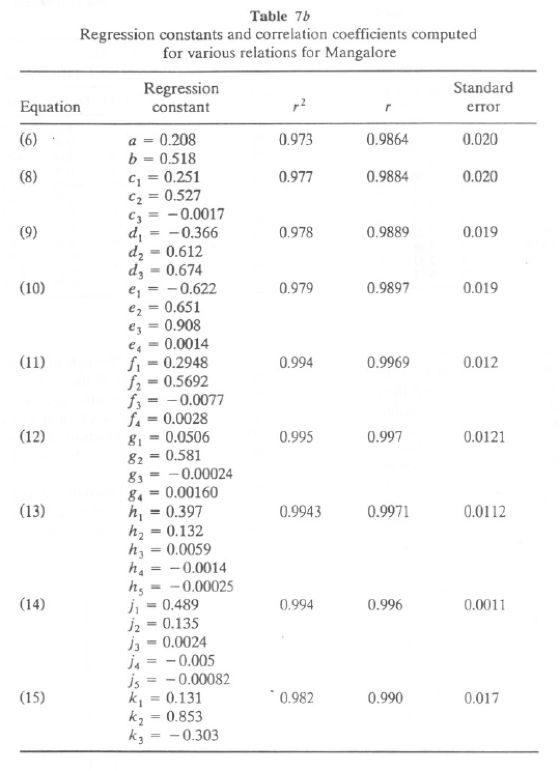
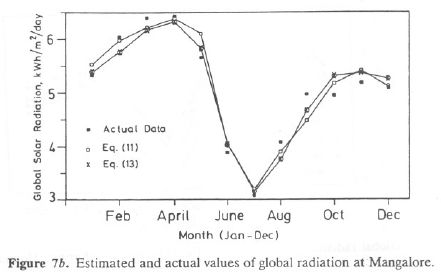
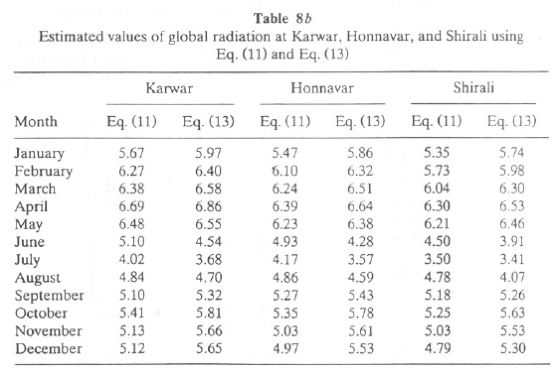
Tables 7a and 7b list the results of various relations tried for data at Goa and Mangalore. From these tables we found that Eqs. (11) and (13) are most appropriate, as they have the least error of the y estimate compared to other equations. Using these relations and climatological parameters of Karwar, Honnavar, and Bhatkal, we estimate the monthly global radiation received at Karwar, Honnavar, and Bhatkal. Since Karwar and Honnavar are close to Goa, we estimated their values based on the relation derived at Goa. For Bhatkal, we used the relation derived for Mangalore (since Bhatkal is closer to Mangalore than to Goa). The global solar radiation computed using Eqs. (11) and (13) for Goa and Mangalore is listed in Table 8a. It is seen that the computed and observed values of G agree within +/- 5% for Goa and Mangalore.
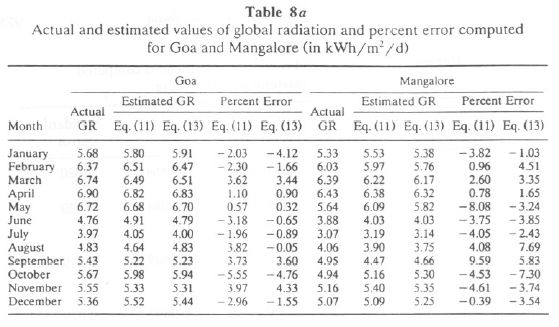
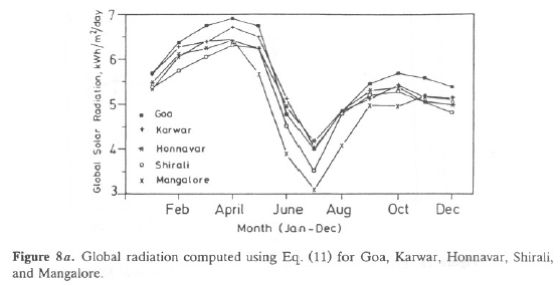
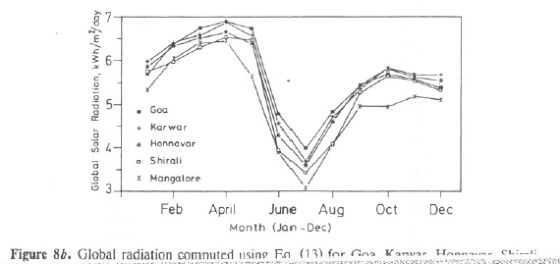
The observed and computed values are presented in Figure 7a for Goa and Figure 7b for Mangalore. Estimated values of GR for Karwar, Honnavar, and Bhatkal are listed in Table 8b using Eqs. (11) and (13). The global radiation measured at Goa and Mangalore and computed GR values using Eq. (11) for Karwar, Honnavar, and Bhatkal (Shirali) are given in Figure 8a. Figure 8b presents the same for computed GR using Eq. (13) for Karwar, Honnavar, and Bhatkal (Shirali), which clearly shows that GR undergoes the same seasonal changes as Goa or Mangalore (also the magnitude of GR at these sites falls within that of Goa and Mangalore). Karwar has GR in the range 5.7-6.9 during January-May and in the minimum range of 4-5 during the monsoon months, July-September. At Honnavar the GR range during January-May is 5.47-6.5 kWh/m2 and is minimum during the monsoon months. Thus this study is five locations of the coastal area of the Western Ghats region demonstrates that good solar energy is available in this region during most months. For only a few days in the monsoon months July-August cloud cover in this region was thick and solar radiation was of the order of 3.5-4.5 kWh/m2/d.

Solar Energy Potential Assessments in the Coastal Belt of Uttara Kannada
In determining a realistic potential for solar energy converting systems, it is quite evident that we have to take into account the availability of solar energy associated with time, such as daily variation due to day and night cycles, seasonal change due to the earth's orbit around the sun, and variation due to local weather conditions. With the detailed investigation of solar energy availability and changes at various places in the coastal area, we now try to assess the potential that could be harnessed to meet the community energy needs for light, heat, and power in the immediate future. Due to the dilute nature of solar energy flux at the earth's surface, large collecting efforts are required in many applications. This makes it necessary to look at land use patterns in a region and at land available for harnessing solar energy. Solar energy systems would be the most interesting option economically if the peak demand for electricity coincides with the highest insolation level.
With an integrated system of solar/wood based/fossil fuel (backup), peak power requirements during the evening hour could be supplied by other sources. Solar and conventional power plants are, to a large extent, based on the same principles. Numerous components identical to both systems may be integrated in one solar/wood/fossil hybrid. In this way, the total investment is significantly reduced over that required for two single plants. The hybrid system may be optimized for maximum power increase by the solar part of the system by using solar boosters if the peak load is expected in the afternoon hours. Apart from this, there are options like storage batteries (not a solution for more than a few hours), pumped storage hydro backup (location specific), and production of hydrogen through electrolysis of water (rather poor efficiency of 50% or less for the production of hydrogen and reconversion to electricity).
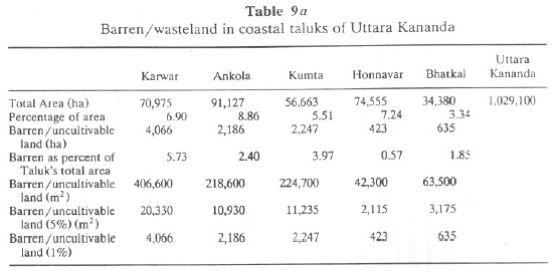
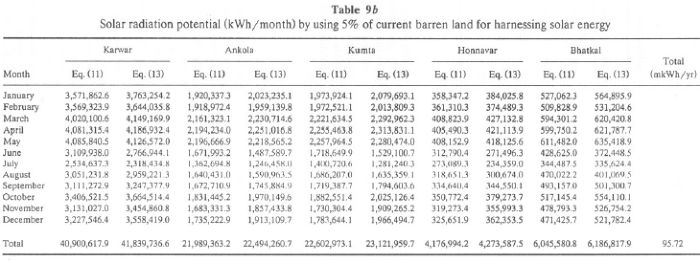
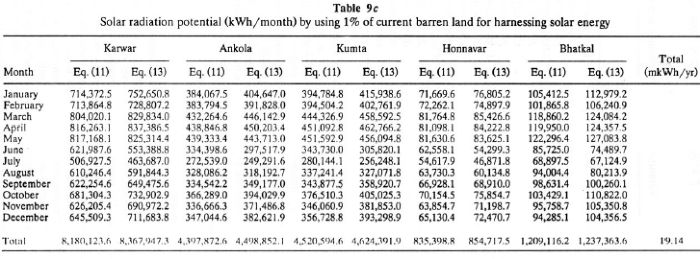
The coastal belt in Uttara Kannada is densely populated, and human influence on forests is quite evident from the barren hilltops (due to deforestation) in this area. Table 9a lists barren uncultivable wasteland by taluk. This varies from 3.34% of total geographic area (Bhatkal) to maximum of 8.86% for Ankola. For the purpose of installing solar devices to harness solar energy in this belt, we assume that 1-5% of present wasteland/barren land could be made available. With the assumption that 5% of the present wasteland in each taluk could conveniently be used for harnessing solar energy, we have computed monthly solar energy per taluk that could be harnessed either through photovoltaic or solar thermal power stations. Table 9b lists the amount of solar energy harnessed by utilizing 5% of present wastelands as solar collector areas. It is found that we can generate the order of 95.72 million units (mkWh) annually from the coastal belt (40.90 mkWh/yr at Karwar, 21.98 mkWh at Ankola, 22.60 mkWh at Kumta, 4.176 mkWh at Honnavar, and 6.045 mkWh/yr at Bhatkal. Table 9c shows that by utilizing 1% of available wasteland in the respective taluks of coastal Uttara Kannada, we can harness 19.14 mkWh/yr.
Annual electricity consumption in Uttara Kannada from various sectors is about 294.049 mkWh. By utilizing 5% of currently available wasteland in the coastal area for harnessing solar energy, at least 32.55% of the present demand of electricity could be met by the solar option.