|
Fusion of Multisensor Data: Review and Comparative Analysis |  |
 |
 |
 |
 |
 |
 |
 |
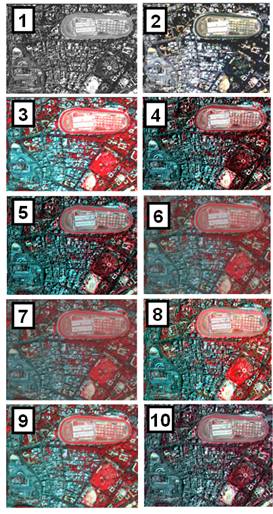
Data Analysis and Results Validation of the techniques discussed above was done using IKONOS PAN (525.8 – 928.5 μm, 1 m, acquired on February 23, 2004) and 4 m resolution MS bands (Blue, Green, Red and NIR, acquired: November 24, 2004). The size of PAN and MS images, covering a portion of Bangalore city, India, is 1200 x 1600 and 300 x 400 respectively. The pairs of the images were geometrically registered and the LR images were upsampled to 1200 x 1600 by nearest neighbour algorithm. IKONOS data were collected at 11-bits per pixel (2048 gray tones). The processing and evaluation were based on the original 11-bit and the data were converted to 8-bit for display purpose only. Fig. 1 (1 and 2) shows the PAN image and the natural colour composite of the R-G-B combination resampled at 1 m pixel size. The study area is composed of various features such as buildings, race course, buses, parks, etc. ranging in size from 1 m to 100 m. The correlation coefficients (CCs) between PAN (downsampled to 4 m pixel size) and the original Blue band was 0.41, PAN and Green was 0.44, PAN and Red was 0.47 and PAN and NIR was 0.59. CC of the NIR band is higher than CCs of other bands, indicating that IKONOS NIR band is very important to the IKONOS PAN band. IHS and BT methods can handle only three bands so G-R-NIR combination was chosen for false colour composite (FCC). The resolution ratio between the IKONOS MS and PAN is 1:4, therefore, in the HPF and HPM methods, a 5 x 5 filter was used. The FCC of the G-R-NIR bands (at 1 m) and the fused result of the IHS, BT, HPF, HPM, PCA, FT and CA methods are displayed in Fig. 1 (3-10) respectively. FT based fusion was performed in spectral domain as shown in Fig. 2. The aim of fusion here is to simulate MS data acquired at LR (4 m) to HR level (1 m), which is identical to MS images originally acquired at HR (1 m) had there been an ideal sensor that would acquire MS bands at 1 m. The performance of the techniques is evaluated in terms of the quality of synthesis of both spatial and spectral information. Visual inspection indicated that the spatial resolutions of the resultant images are higher than that of the original image as features (such as buses, trees, buildings, roads) which were not interpretable in the original image
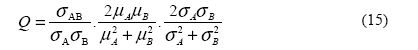
[Fig. 1 (3)] are identifiable in the resultant images [Fig. 1 (4-10)]. IHS, BT, and CA [Fig. 1 (4, 5 and 10)] produce significant color distortion, while HPF, HPM, PCA and FT methods [Fig. 1 (6, 7, 8 and 9)] produce slight colour distortion in buildings/builtup area. HPF, HPM and FT exhibit more sharpness. This is probably due to over-enhancement along the edge area because these additive methods have considered the differences in high-frequency information between the PAN and the MS bands. Overall, by visual inspection HPF, HPM, PCA and FT methods gives the synthesised result closest to what is expected with least colour distortion. The performance of these techniques were also analysed quantitatively by checking the CC that is often used as a similarity metric in image fusion. However, CC is insensitive to a constant gain and bias between two images and does not allow subtle discrimination of possible fusion artifacts. In addition, a universal image quality index (UIQI) [6] is used to measure the similarity between two images. UIQI is designed by modeling any image distortion as a combination of three factors: loss of correlation, radiometric distortion, and contrast distortion and is given by:
The first component is the CC for A (original MS band) and B (fused MS band). The second component measures how close the mean gray levels of A and B is, while the third measures the similarity between the contrasts of A and B. The dynamic range is [-1, 1]. If two images are identical, the similarity is maximal and equals 1. The synthesised HR MS images (1 m) are spatially degraded to the resolution level of the original LR MS images (4 m). UIQI are computed between the degraded HR MS images and the original LR MS images at the 4 m resolution level. Table 1 shows that the UIQI values of HPF and HPM are higher than the UIQI values of other methods. These two methods also showed higher scores in the NIR band. Since, PAN band includes the most important information from the NIR band (PAN and NIR exhibited highest correlation), therefore from the UIQI method, it is apparent that HPF is superior to all other methods but only slightly better than HPM, which is also reported in [6]. Table 1. UIQI of fused and original image
Table 2. Correlation between IKONOS HR PAN and corresponding LR PAN images from different methods
The closeness between two images was also quantified in terms of correlation function where each original IKONOS MS band was correlated with respect to each fused band obtained from the 7 techniques (except in IHS and BT where only three bands – G, R, and NIR were considered). Table 2 shows the correlation between the IKONOS HR PAN image and the corresponding LR PAN images by different methods (computed at 1 m pixel size). It can be seen from Table 1 and 2 that the degree of similarity between the HR PAN image and the LR PAN image correspond to the degree of spectral distortion of each band. The lower the similarity between the HR PAN image and the LR PAN image, the higher the spectral distortion and vice versa. HPF and HPM produce very high correlation of more than 0.9 with band 2, 3 and 4. BT has a high correlation in band 2 and 3. IHS and CA produce least correlation, while PCA and FT has medium correlation contrary to the earlier report in [1]. Statistical parameters – minimum, maximum and standard deviation were also used as a measure to examine the spectral information preservation for all the bands. HPM, HPF and PCA were closest to the minimum values of the original bands. For the maximum values, all bands from the HPF and HPM methods were very close to the maximum of original bands. All other methods induced changes in the maximum values in all the fused bands. The standard deviation values for the HPF, HPM, BT and PCA were similar to the original bands of the IKONOS. All other methods showed deviations. These parameters indicated that HPF and HPM are better compared to other methods, however, it could not clearly indicate which method among HPF and HPM is better since some values were closer to original bands in HPF while some were closer to original band values in HPM. By combining the visual inspection and the quantitative results, it was observed that the IHS, BT, and CA methods produce considerable spectral distortion, the FT and PCA methods produce slight spectral distortion and the HPF and HPM method produces the images closest to those the corresponding multisensors would observe at the HR level. However, if the contribution of the NIR band is considered in image fusion then HPF is slightly better than HPM. |
||||||||||||||||||||||||||||||||||||||||||||||||||||||||||||||||||||