|
RESULTS & DISCUSSION
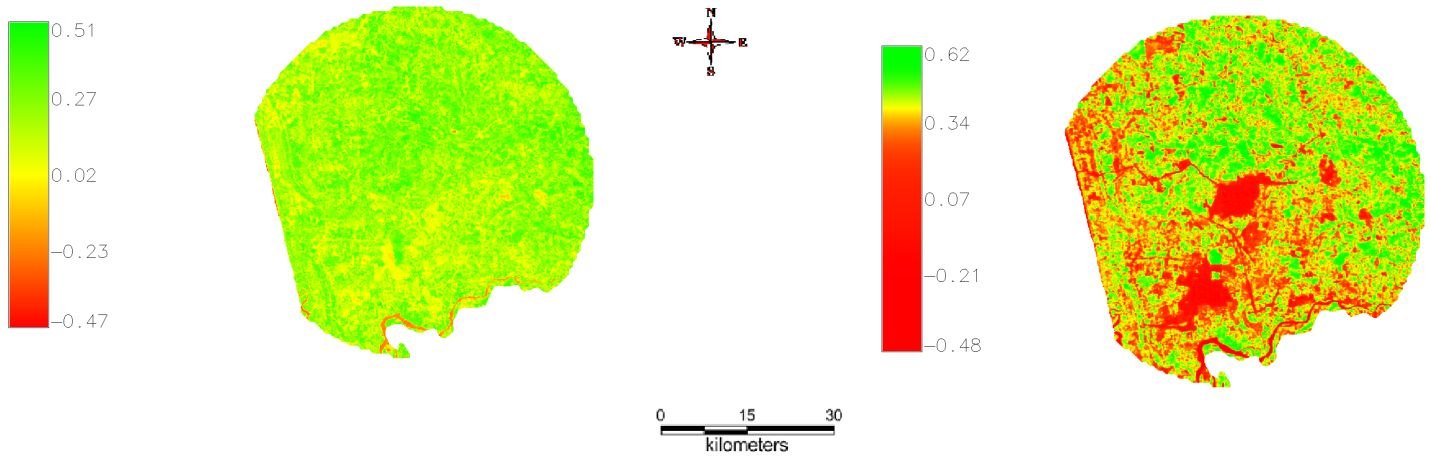
Land Cover Analysis: Normalized Difference Vegetation Index (NDVI) shows the % of area under vegetation and non-vegetation. Figure 4 and Table 3 illustrates the spatio temporal changes in the land cover. The vegetation cover 12.68% (2003) has decreased to 9.76% (2011).

Fig. 4: Land Cover classification
Table 3: Land cover analysis
| Year |
% Vegetation |
% Non-vegetation |
| 2003 (before setting up thermal power plant) |
12.68 |
87.32 |
| 2011 |
9.76 |
90.24 |
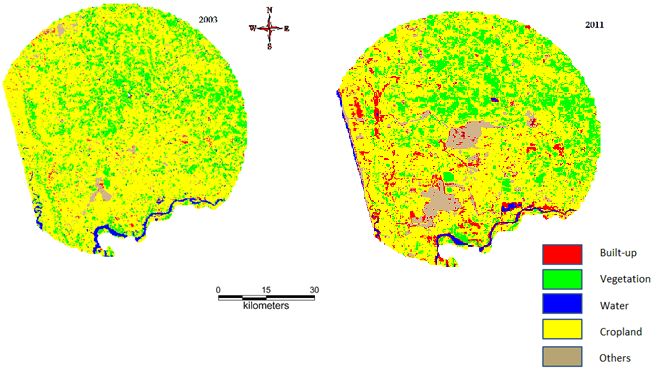
Land Use analysis: The Spatio temporal land use changes during 2003 to 2011 are given in figure 5 and table 4. The built-up land increased from 5.26% (2003) to 8.1% (2011), Vegetation decreased from 8.1% (2003) to 4.24% (2011) emphasising the changes in land use after setting up large scale thermal power plant.
Fig. 5: Land Use Classified image
Table 4: Spatio-temporal Land use dynamics
| Year |
2003 |
2011 |
| Category |
Ha |
% |
Ha |
% |
| Built-up |
691.466 |
6.26 |
1402.81 |
12.7 |
| Water |
117.085 |
1.06 |
104.934 |
0.95 |
| Cropland |
7546.47 |
68.32 |
5901.762 |
53.43 |
| Vegetation |
894.70 |
8.1 |
468.34 |
4.24 |
| Others |
1796.044 |
16.26 |
3167.93 |
28.68 |
| Total area(Ha) |
11045.784 |
Accuracy assessment: Kappa statistic summarizes the overall results and measures the difference between the actual agreements in the error matrix which is ranging from 93% to 95% shown in table 5.
Table 5: Kappa Statistic and accuracy assessment
| Year |
Overall Accuracy |
Kappa value |
| 2003 |
93.515 |
0.898 |
| 2011 |
95.010 |
0.906 |
Apart from physical land use changes, also observed drying of leaves (leaf burn associated with necrosis, chlorosis, etc.) and reduced crop (agriculture, horticulture) productivities due to the emissions (Particulate matters, Sox, Super saturated saline mist from cooling towers). Phyto-toxicity due to the deposition of dust with contaminants (heavy metals) in the pollen parts has affected the pollination. This is evident form the reduced population of pollinators (bees, etc.) in the region. The reduced crop productivity and contamination of water (due to discharge of effluents and also leakage from fly ash pond) has affected the livelihood of the local people. Spatial analysis also reveals the lack of green barriers / green belt in the region contrary to the guidelines as per the environment norms. As per the environmental policy 2006 and also EIA notification 2006, TPP is supposed to maintain at least 33% green cover. However, poor green cover in the TPP site as well as ash pond site and lack of appropriate buffer, highlight non-compliance of the environmental norms.
|