|
METHOD
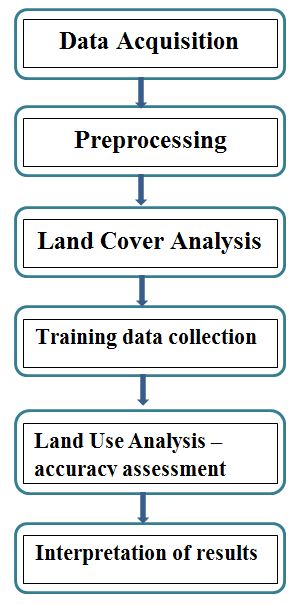
Figure 3 depicts the procedure followed in the study. The preprocessing of remote sensing data includes atmospheric correction and geometric correction in order to enable correct area measurements, precise localization and multi-source data integration (Buiten, 1988, Jixian et.al, 2007). The remote sensing data (Landsat and Indian Remote Sensing Satellites) obtained were geo-referenced, rectified and cropped pertaining to the study area. The temporal data used in the analysis were resampled to 10 m for temporal comparisons with uniform spatial resolutions. Geo-registration of remote sensing data (Landsat data) has been done using ground control points (GCPs) collected from the field using pre calibrated GPS (Global Positioning System) and also from known points (such as road intersections, etc.) collected from geo-referenced topographic maps published by the Survey of India.
In the correction process numerous GCPs are located in terms of their two image coordinates; on the distorted image and in terms of their ground coordinates measured from a map or located in the field (using GPS). All datasets acquired are geometrically corrected.
Figure 3: Protocol for remote sensing data analysis
Land cover and Land use analysis
Spatio temporal change detection process involves determining the changes associated with land use and land cover properties with reference to geo-registered multi temporal remote sensing data. The capability of capturing changes in land cover and extracting the change information from satellite data requires effective change detection techniques (Roy et al., 2002 and Shalaby et al., 2007).The monitoring of land cover involves the computation of vegetation indices. Vegetation indices help in mapping the regions under vegetation and non-vegetation (soil and water). Among all techniques of land cover mapping Normalised difference Vegetation Index (NDVI) is most widely accepted and applied (Weismiller et al., 1977, Jensen and Toll, 1982, Nelson, 1983, Ramachandra et al., 2009). The land cover analysis was done using NDVI (Normalized Difference Vegetation Index). Calculation of NDVI for Multi-temporal data is advantageous in areas where vegetation changes rapidly. NDVI is based on the principle of spectral difference based on strong vegetation absorbance in the red and strong reflectance in the near-infrared part of the spectrum.
NDVI is computed using visible Red and Near Infra-Red (NIR) bands of the data. Healthy vegetation absorbs most of the visible light and reflects a large portion of the near-infrared light. Sparse vegetation reflects more visible light and less near-infrared light. NDVI for a given pixel always result in a number that ranges from minus one (-1) to plus one (+1), using Eq. (1)

Very low values of NDVI (-0.1 and below) correspond to soil or barren areas of rock, sand, or urban built-up. Zero indicates the water cover. Moderate values represent low density vegetation (0.1 to 0.3), while high values indicate thick canopy vegetation (0.6 to 0.8).
Land use analysis: The method involves i) generation of false colour composite (FCC) of remote sensing data (bands – green, red and NIR). This helped in locating heterogeneous patches in the landscape ii) selection of training polygons (these correspond to heterogeneous patches in FCC) covering 15% of the study area and uniformly distributed over the entire study area, iii) loading these training polygons co-ordinates into pre-calibrated GPS, vi) collection of the corresponding attribute data (land use types) for these polygons from the field . GPS helped in locating respective training polygons in the field, iv) supplementing this information with Google Earth v) 60% of the training data has been used for classification of the data, while the balance is used for validation or accuracy assessment.
Training data was collected in order to classify and also to validate the results of the classification. The land use analysis was carried out with supervised classification scheme with selected training data. The supervised classification approach is adopted as it preserves the basic land cover characteristics through statistical classification techniques using a number of well-distributed training pixels. Maximum Likelihood algorithm is a common, appropriate and efficient method in supervised classification techniques by using availability of multi-temporal “ground truth” information to obtain a suitable training set for classifier learning. Supervised training areas are located in regions of homogeneous cover type. All spectral classes in the scene are represented in the various subareas and then clustered independently to determine their identity. The following classes of land use were examined: built-up, water, cropland, open space or barren land, and forest. Such quantitative assessments, will lead to a deeper and more robust understanding of land-use and land-cover change and to more appropriate policy intervention.
GRASS GIS (Geographical Analysis Support System) a open source software has been used for the analysis, which has the robust support for processing both vector and raster files accessible at http://wgbis.ces.iisc.ac.in/grass/index.php.
Accuracy assessments decide the quality of the information derived from remotely sensed data. The accuracy assessment is the process of measuring the spectral classification inaccuracies by a set of reference pixels. These test samples are then used to create error matrix (also referred as confusion matrix), kappa (κ) statistics and producer's and user's accuracies to assess the classification accuracies. Kappa is an accuracy statistic that permits us to compare two or more matrices and weighs cells in error matrix according to the magnitude of misclassification. Accuracy assessment and kappa statistics are included in table 5. This table is used to evaluate the strength of each class as well as the classification as a whole.
|