|
RESULTS AND DISCUSSION
4.1. Representative synthesisedwind data
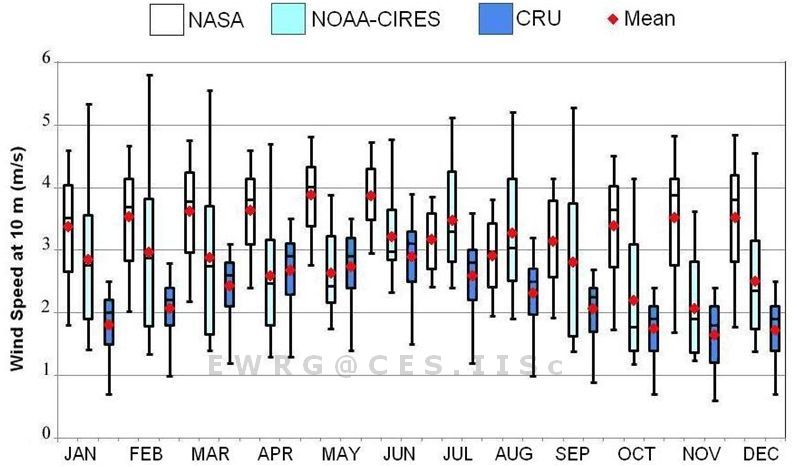
Himachal Pradesh is a complex terrain with features like vegetation and local relief influencing wind speeds in the region. Wind regime represented by NASA-SSE data (Figure 4) varied from 2.14±0.42 to 4.45±0.48 m/s over the region. Long term but coarse NOAA–CIRES data (Figure 5) showed annual average wind speed variation similar to NASA-SSE, ranging from 1.96±0.73 to 4.29±0.70 m/s. High spatial resolution CRU wind speedsvaried from 1.02±0.30 to 2.88±0.41 m/s (Figure 6). The three synthesised data, although different in magnitudes, showed a consistent increase in annual average wind speeds with increasing elevation that is also coherent with the agro–climate zones of Himachal Pradesh.
4.1.1 Validation
It is known that the density of vegetation and size of canopy cover reduces with increasing elevation (towards alpine zone) and facilitates higher wind flow. The surface measurements from IMD (though not representative of the entire state), validate the consistent increase in wind speeds with elevation as illustrated by the three synthesised data, viz. NASA-SSE, NOAA-CIRES and CRU (Figures 4–6).
Synthesised wind data were cross-compared using box-plots (Figure 7) to observe the pattern of monthly wind speed variations over the region. On comparison with NOAA-CIRES and CRU wind data, NASA-SSE values were observed to be exaggerated. Although, NOAA-CIRES data were more distributed due to their coarseness in spatial resolution, they showed similar monthly variations as CRU values, with a unimodalrise in wind speeds during monsoon season (June to September). Further, these data were validated with surface measurements of IMD. The RMSE (Root Mean Square Error) for NASA-SSE and NOAA-CIRES were 2.57 m/s and 1.92 m/s respectively. CRU data showed the least RMSE of 1.32 m/s on validation and hence scored over the rest as the most representative data for the region.
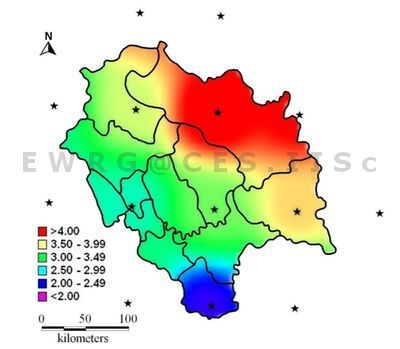
Figure 4: Annual average wind speed in Himachal Pradesh based on 1oX1o spatial resolution NASA-SSE data

Figure 5: Annual average wind speed in Himachal Pradesh based on 2oX2o spatial resolution NOAA–CIRES reanalysis data
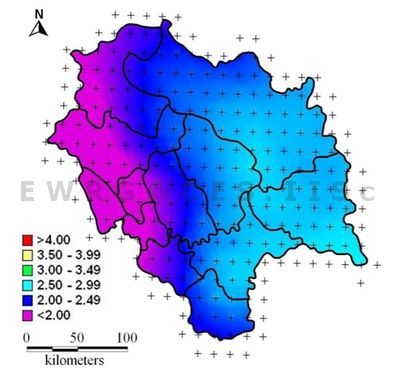
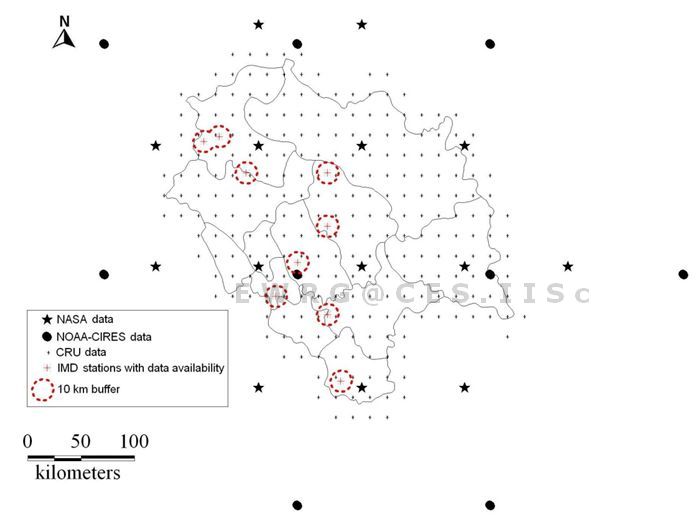
Figure 6: Annual average wind speed in Himachal Pradesh based on 10’X10’ spatial resolution CRU data
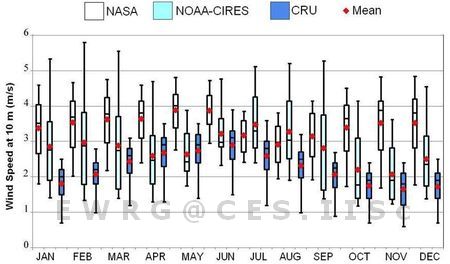
Figure 7: Cross-comparison of synthesised monthly wind speed data
4.1.2 Re-validation
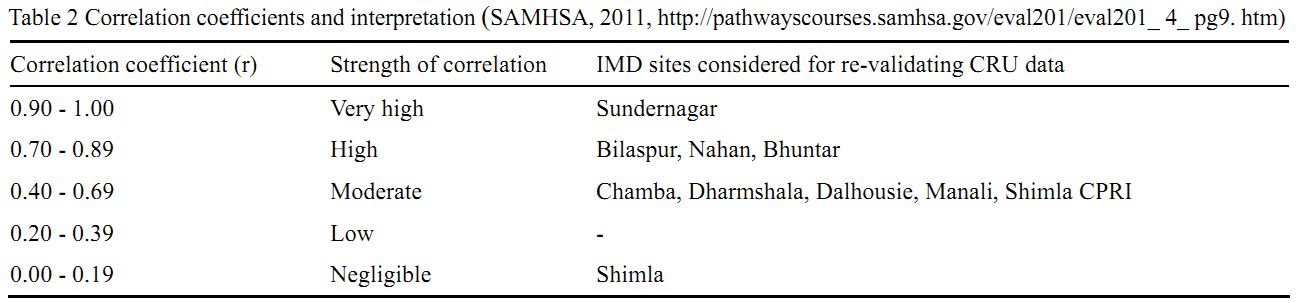
As discussed in section 1.1.1, wind patterns are retained within the vicinity of surface measurement sites even upto 30 km, even though magnitudes vary (Mani and Mooley, 1983). For re-validation of the apparent representative wind data, CRU data within 10 km radius of tenIMD siteswith surface data availability were considered (represented in Figure 3). CRU and IMD monthly wind speed values were compared for these sites using scatter plots (represented in Figure 8). Out of 10, 1 site (Sundernagar) showed very high, 3 sites (Bilaspur, Nahan, Bhuntar) showed high and 5 sites (Chamba, Dharmshala, Dalhousie, Manali, Shimla CPRI) showed moderate correlation between measured IMD and synthesised CRU values (Table 2). The undulating terrain of Himachal Pradesh renders variations in wind speeds even over small distances and hence explains the absolute lack of correlation between IMD and CRU values in Shimla.
The above findings reiterate that CRU wind speeds are the most representative among the threesynthesised datasetscollected. CRU model considers geographical influences and high resolution makes it prudent for meso–scale (10–100 km) seasonal wind profiling in the tough Himalayan terrain of Himachal Pradesh.
Table 2: Correlation coefficients and interpretation (SAMHSA, 2011)
| Correlation Coefficient (r) |
Strength of correlation |
IMD sites considered for re-validating CRU data |
| 0.90 - 1.00 |
Very high |
Sundernagar |
| 0.70 - 0.89 |
High |
Bilaspur, Nahan, Bhuntar |
| 0.40 - 0.69 |
Moderate |
Chamba, Dharmshala, Dalhousie, Manali, Shimla CPRI |
| 0.20 - 0.39 |
Low |
- |
| 0.00 - 0.19 |
Negligible |
Shimla |
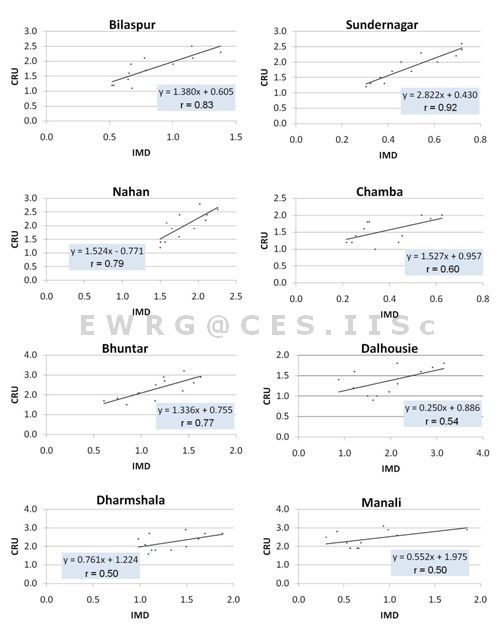
Figure 8: Correlation analysis for re-validation of CRU data within 10 km radius of IMD siteswith surface data availability
4.2 Seasonal wind profiling
Seasonal wind profiles for Himachal Pradesh based on CRU data were generated by Kriging interpolation method in a geospatial application. Figure 9 shows the seasonal as well as spatial variation of average wind speeds. Frequency of occurrences of regional wind speeds are represented by histograms. As observed in the annual CRU wind regime (Figure 6), the spatial variations of wind speeds in seasonal wind profiles (Figure 9) were explicitly influenced by elevation and resultant agro–climatic zones. Highest wind speeds in the range of 1–3.25 m/s were seen during Monsoon season (June to August) with high elevation zones of Lahual Spiti, Kinnaur, Kullu and Shimla districts showing above 2.5 m/s. Wind speeds declined during post-monsoon and winter seasons (October to February) and rangedas 0.75–2.25 m/s over the region, although high elevations zones showed above 2 m/s. During summer and pre-monsoon (March to May), wind speeds showed an increasing trend in the range of 1.25–3 m/s, high elevation zones having wind speeds appreciably above 2.5 m/s. Hence, the districts of Lahual Spiti, Kinnaur, Kullu and Shimla with annually consistent wind speeds above 2 m/s are suitable candidates for detailed wind exploration.
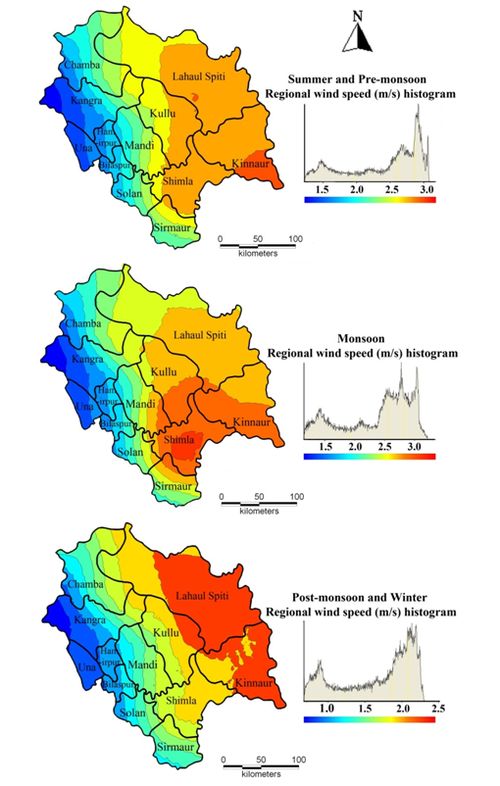
Figure 9: Seasonal wind profiles with spatial variations and frequency of occurrence of wind speeds for Himachal Pradesh
4.2.1 Validation of seasonal and regional variations in wind speed
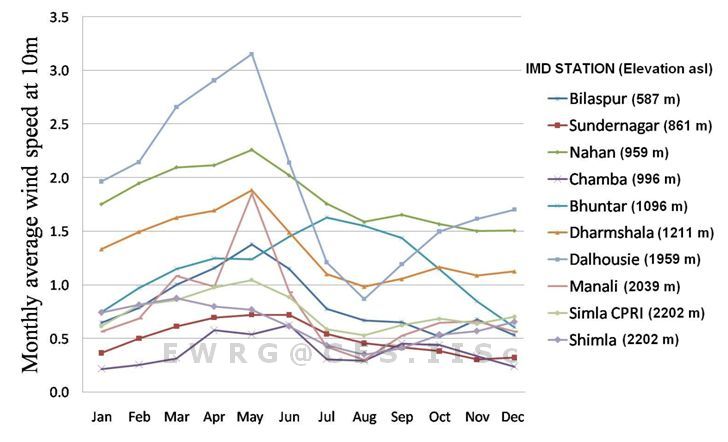
Long term surface measurement based monthly average wind speeds at 10 IMD sites with data availability in Himachal Pradesh are shown in Figure 10. Monthly variations of surface wind measurements are consistent with the observations on seasonal wind profiles (Figure 9) based on CRU data. Most of the stations recorded peak wind speeds during the monsoon season. Winter months witnessed calm breeze awaiting a surge in the forthcoming summer.
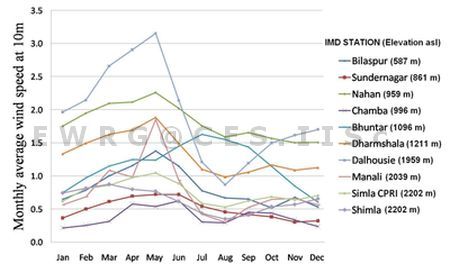
Figure 10: Monthly average wind speeds at IMD stations with data availability
Daily wind speeds in Himachal Pradesh were also studied. The daylight average wind speeds (8:30–17:30 hrs) were higher than the dark hours (17:30–8:30 hrs) for all the months recorded by IMD. These trends were observed in most of the sites although exceptions due to the micro climatic influences on wind speeds were noticed at certain stations.
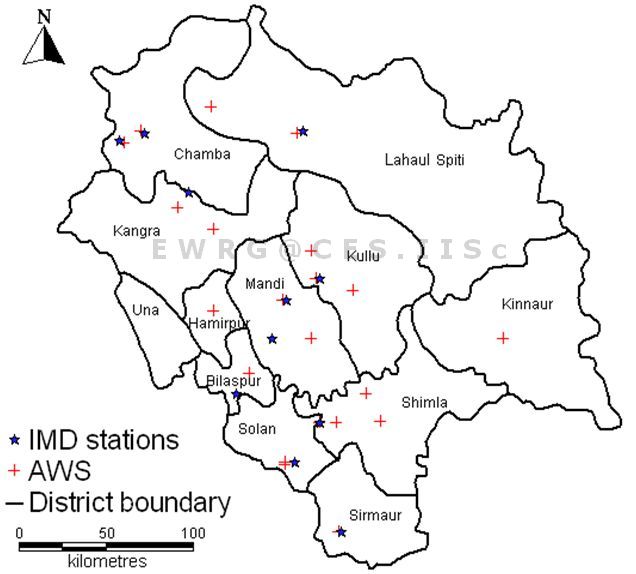
The IMD sites were mostly located in low and middle elevation zones ranging from tropical to wet–temperate (<3500m) which experience wind speeds below 2 m/s according to wind profiles based on CRU data. None of the available IMD sites represent high elevation zone where higher wind speeds (> 2m/s) were investigated. Most of the IMD sites (except Shimla) measured wind speeds below 10m, and hence the assumption of standardized measurements for data (mast height) sparse stations could be an underestimate according to power law in Equation 1. Hence, the actual wind speeds in many of the data sparse sites may be higher at 10m. AWS wind speed measurements installed at 22 stations spread across Himachal Pradesh (shown in Figure 2) with better spatial coverage would aid in better validation of these results apart from removal of uncertainties such as data gaps, etc. Availability of more number of reliable wind measurement stations and detailed analysis of terrain features could facilitate micro–scale (1–10 km) wind resource assessment in Himachal Pradesh.
4.3. Small-scale wind applications in Himachal Pradesh
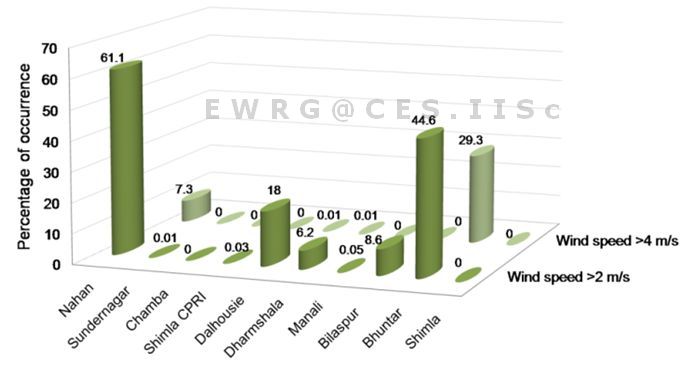
In order to explore the potential of wind technologies at an increased hub height, hourly surface wind speed measurements at IMD stations were estimated for 30m using power law in Equation 1 and represented in Figure 11. More than 61% of measured hours in Nahan, 44% in Bhuntar and 18% in Dalhousie obtained wind speeds above 2 m/s. Over 29% of the measured hours crossed 4 m/s wind speeds in Bhuntar. These finding along with relatively higher wind speeds (>2 m/s in high elevation zone) observed in seasonal wind profiles (based on synthesised CRU data) are indicative of the prospects of small-scale wind applications in Himachal Pradesh.
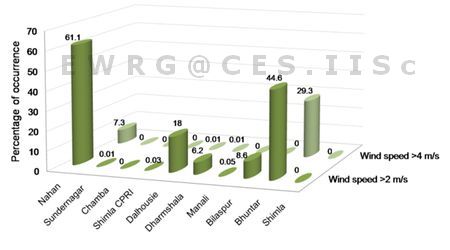
Figure 11: Percentage occurrence of winds above 2 m/s and 4 m/s from hourly measurements projected to 30 m hub height
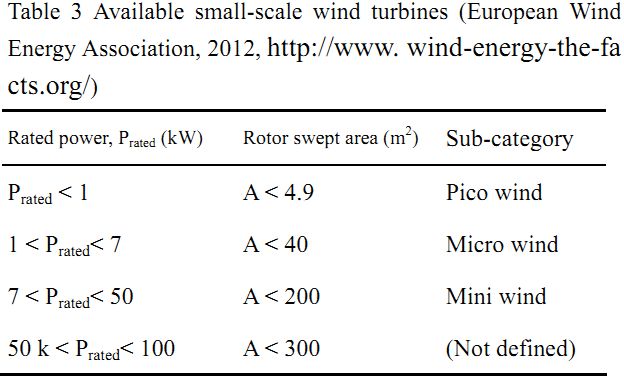
- With advancements in technology, small–scale wind turbines functional at moderately low wind speeds are technically feasible and economically viable (Cabello and Orza, 2010). Some of these are listed in Table 3. The Savonius rotor Vertical Axis Wind Turbine (VAWT) that can function in wind speeds as low as 1 m/s (Ayhan D., Saglam, 2012) is of special interest in this region.
Table 3: Available small-scale wind turbines
| Rated power, Prated (kW) |
Rotor swept area (m2) |
Sub-category |
| Prated < 1 kW |
A < 4.9 m2 |
Pico wind |
| 1 kW < Prated< 7 kW |
A < 40 m2 |
Micro wind |
| 7 kW < Prated< 50 kW |
A < 200 m2 |
Mini wind |
| 50 kW < Prated< 100 kW |
A < 300 m2 |
(Not defined) |
- Wind pump for drawing water is an attractive small-scale wind technologyfor rural energy needs (Mathew et al., 2002). The agriculture intensive sub–tropical to wet–temperate zones of Himachal Pradesh could get benefited by wind pumps that function at low wind speeds. As seen in Nahan and Bhuntar, increased hub heights (30 m) could deliver prolonged winds above 2 m/s.
- Wind based space heating systems have been assessedto be cost effective compared to many conventional fuel sources like fuelwood and electricity (Jaber et al., 2008). The colder alpine zone of Lahaul Spiti and Kinnaur where the wind speeds are relatively higher, could meet their space heating requirements through wind energy. Development of wind energy based water heaters is promising for such regions (Tudorache and Popescu, 2009).
- Reduction in wind speeds and duration could be compensated by hybridizing wind with available alternativere sources. Our assessment of solar energy potential in Himachal Pradesh substantiates that it receives monthly average global insolation (incoming solar radiation) > 4 kWh/m2/day except for the winter months (December and January). Higher altitude alpine zone (> 3500 m) receives lower insolation values but higher wind speeds. This trends inverts in lower altitude tropical zone i.e higher insolation and lower wind speeds (Ramachandra et al., 2011; Ramachandra et al., 2012). Hence wind–solar hybridsystems could be considered for endured energy supply in the region. Small-scale wind turbines could also be used in conjunction with diesel generators especially in remote areas (Clausen and Wood, 1999), although not a clean option. Battery charging based on wind systems supplements the energy requirements during reduced wind speeds.
4.4. Constraints
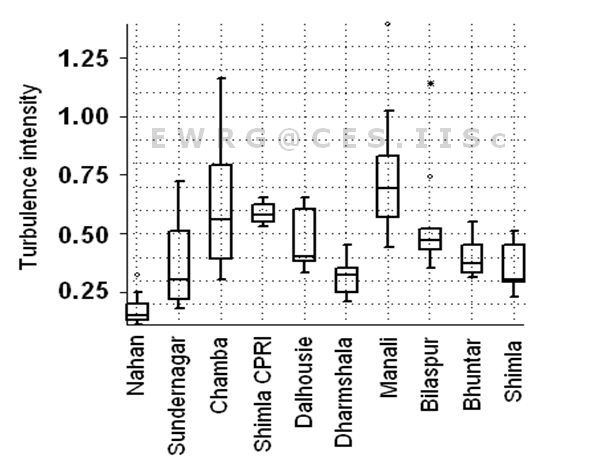
The present study provides a meso-scale understanding of the wind regime in Himachal Pradesh. Wind technologies could be deployed in the region only after assessing the detailed wind characteristics, land availability and socioeconomic impact. This demands reliable and long term surface wind measurements at specific locations which are invariably influenced by the local terrain features. Wind characteristics like speed, power density, turbulence intensity and vertical profile variations influence the design of wind turbines for purposes like power generation, battery charging, water pumping or space heating. For example, turbulence intensity (ratio of standard deviation to average of wind speed) in Himachal Pradesh, based on IMD surface wind measurements exceeds 0.1 (Figure 12). These values are relatively higher (Bourgeois et al., 2012) and hence call for appropriate considerations in wind turbine design. Land availability for small-scalewind applicationsmay not be a serious constraint. However, increased hub heights even for small turbines could be at the cost of the soil strength and land stability. Also, success of wind technology demands regular monitoring and sustained maintenance.
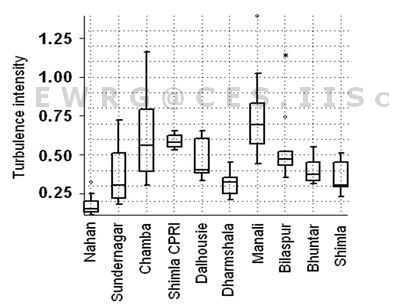
Figure 12: Turbulence intensity in Himachal Pradesh based on surface wind speed measurements
|


