RESULTS AND DISCUSSION
RS data were geometrically corrected on a pixel by pixel basis and the images were resampled to a common resolution of 30m with a dimension of 7562 x 6790. LC mapping (Fig. 3) was done using normalised difference vegetation index (NDVI) given as
 (4)
(4)
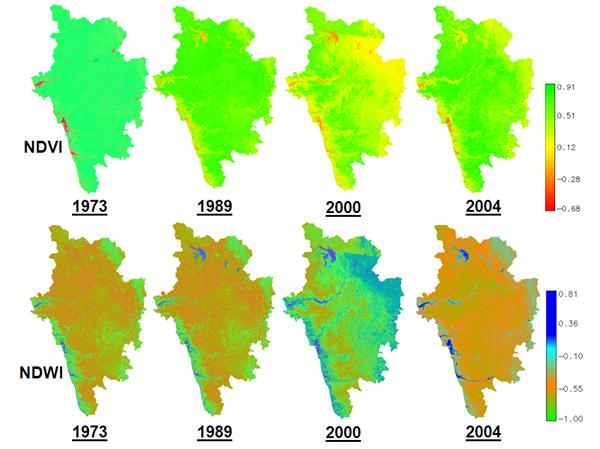
Fig. 3. NDVI and NDWI for Uttara Kannada
NDVI values range from -1 to +1; increasing values from 0 indicate presence of vegetation (agriculture, forest and plantation) and negative values indicate absence of greenery (builtup, sand, fallow, water) as given in Table I.
Table I: NDVI and WDVI of Uttara Kannada.
| Index |
NDVI |
WDVI |
| |
Vegetation (%) |
Non-Vegetation (%) |
Water (%) |
non-water (%) |
| 1973 |
97.82 |
2.18 |
1.75 |
98.25 |
| 1989 |
96.13 |
3.87 |
2.20 |
97.80 |
| 2000 |
94.33 |
5.67 |
2.80 |
97.20 |
| 2004 |
94.00 |
6.00 |
2.50 |
97.50 |
Mapping of water bodies (Fig. 3) was done using normalised difference water index (NDWI) [24] given as
 (5)
(5)
NDWI values above 0 indicate presence of water bodies and values below 0 indicate other classes.
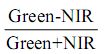
Training pixels were collected from the false colour composite of the respective bands (for time period 1973, 1989, and 2000) since historical data were unavailable. For 2004 data, training data uniformly distributed over the study area collected with pre calibrated GPS were used. The class spectral characteristics for six LU categories (agriculture, builtup / settlement, forest (evergreen, semi-evergreen, deciduous), plantation, waste land / fallow / sand, and water bodies / streams) using RS data were obtained to assess their inter-class separability. and the images were classified using MLC. Temporal classified images (into 6 LC classes – agriculture, built-up, forest, plantation, waste land and water bodies) are shown in Fig. 4 and the statistics are given in Table II. This was validated with the representative field data (covering ~ 10% of the study area) and also using Google Earth image. Producer’s, user’s, overall accuracy and Kappa values computed are listed in Table III.
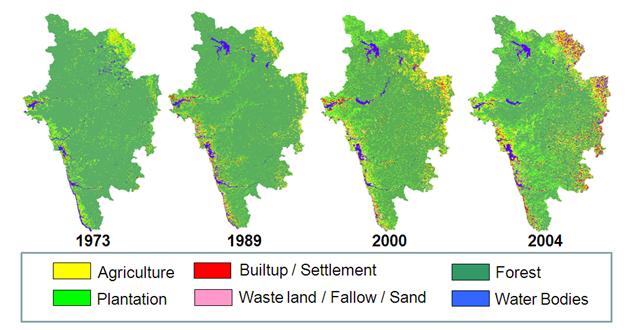
Fig. 4. Temporal classified image of Uttara Kannada district.
Table II: LU details of Uttara Kannada district
| Year |
1973 |
1989 |
2000 |
2004 |
| Class |
Area |
Area |
Area |
Area |
| (ha) |
(%) |
(Ha) |
(%) |
(Ha) |
(%) |
(Ha) |
(%) |
| Agriculture |
25794 |
2.51 |
57465 |
5.59 |
97749 |
9.51 |
115464 |
11.23 |
| Builtup |
4490 |
0.44 |
8671 |
0.84 |
13674 |
1.33 |
27577 |
2.68 |
| Forest |
897420 |
87.29 |
845665 |
82.25 |
749877 |
72.94 |
627455 |
61.02 |
| Plantation |
82439 |
8.02 |
85190 |
8.29 |
122160 |
11.88 |
184340 |
17.93 |
| Waste land Land |
- |
- |
8483 |
0.83 |
15884 |
1.54 |
23456 |
2.28 |
| Water bodies |
17995 |
1.75 |
22666 |
2.20 |
28796 |
2.80 |
49924 |
4.86 |
| Total |
1028151 |
100 |
1028151 |
100 |
1028151 |
100 |
1028151 |
100 |
Table III: Accuracy Assessment of the classified images
| Year |
Category |
User’s
Accuracy |
Producer’s
Accuracy |
Overall
Accuracy |
Kappa |
| 1973 |
Agriculture |
74.12 |
77.97 |
76.89 |
71.92 |
| Builtup |
68.45 |
65.42 |
| Forest |
87.23 |
85.22 |
| Plantation |
81.27 |
77.23 |
| Wasteland |
85.62 |
81.21 |
| Water bodiee |
78.50 |
74.29 |
| |
| 1989 |
Agriculture |
70.43 |
80.39 |
75.78 |
69.82 |
| Builtup |
78.78 |
81.11 |
| Forest |
73.96 |
73.39 |
| Plantation |
79.62 |
77.19 |
| Wasteland |
80.21 |
77.78 |
| Water bodiee |
31.02 |
64.82 |
| |
| 2000 |
Agriculture |
81.16 |
80.47 |
83.21 |
79.21 |
| Builtup |
84.29 |
87.50 |
| Forest |
87.15 |
82.54 |
| Plantation |
86.51 |
87.23 |
| Wasteland |
85.22 |
81.79 |
| Water bodiee |
86.40 |
97.56 |
| |
| 2004 |
Agriculture |
85.21 |
84.54 |
87.83 |
83.11 |
| Builtup |
86.47 |
83.11 |
| Forest |
94.73 |
96.20 |
| Plantation |
92.27 |
91.73 |
| Wasteland |
88.49 |
87.88 |
| Water bodiee |
83.13 |
81.33 |
Further, five watersheds were delineated from the classified images of four time period as shown in Fig. 5 and the statistics are listed in Table IV. Forest fragmentation model was used to obtain fragmentation indices as shown in Fig. 6 and the statistics are presented in Table V. Forest was categorised into patch, transitional, edge, perforated, and interior types using programs in GRASS GIS (http://wgbis.ces.iisc.ac.in/foss).
Fig. 5. Temporal LU image of the five rive basins of Uttara Kannada district.
Table IV: LU Details of the five river basins (in ha and %)
| Year |
Category |
Aganashini |
Bedthi |
Kali |
Sharavathi |
Venkatpura |
| 1973 |
Agriculture |
1886.6 |
1.4 |
3616.42 |
1.3 |
14294 |
3.8 |
1302 |
1.6 |
1355.2 |
5.9 |
| Builtup |
627.6 |
0.5 |
799.83 |
0.3 |
1318.7 |
0.4 |
103.976 |
0.1 |
74.69 |
0.3 |
| Forest |
123500 |
90 |
251363 |
92 |
320174 |
86 |
71536 |
88 |
18282 |
81 |
| Plantation |
7930.9 |
5.8 |
16315.9 |
6 |
31593 |
8.4 |
2900 |
7.3 |
2289 |
10 |
| Wasteland |
- |
- |
- |
- |
- |
- |
- |
- |
- |
- |
| Water bodies |
2662.5 |
2 |
1556.7 |
0.6 |
6696.8 |
1.8 |
2329 |
2.9 |
615.9 |
2.7 |
| |
|
|
|
|
|
|
|
|
|
|
|
| 1989 |
Agriculture |
4466 |
3.3 |
12550.9 |
4.6 |
19667 |
5.3 |
4110 |
5.1 |
1529.7 |
6.8 |
| Builtup |
883.9 |
0.7 |
856.9 |
0.3 |
2886.6 |
0.8 |
784 |
1.0 |
404.4 |
1.8 |
| Forest |
118724 |
87 |
239894 |
87 |
303758 |
81 |
63686 |
78 |
16725 |
74 |
| Plantation |
8217.7 |
6.0 |
17783 |
6.5 |
34152 |
9.1 |
8807 |
11 |
3165.8 |
14 |
| Wasteland |
784.9 |
0.6 |
1360.8 |
0.5 |
1696.5 |
0.5 |
729 |
1 |
508 |
2.3 |
| Water bodies |
3531.6 |
2.6 |
1205.8 |
0.4 |
11916 |
3.2 |
3055 |
3.8 |
284 |
1.3 |
| |
|
|
|
|
|
|
|
|
|
|
|
| 2000 |
Agriculture |
6179.3 |
4.5 |
29413 |
11 |
33421 |
8.9 |
4781 |
5.9 |
1881.3 |
8.3 |
| Builtup |
969.7 |
0.7 |
3838.4 |
1.4 |
4364 |
1.2 |
414.8 |
0.5 |
717.6 |
3.2 |
| Forest |
11130 |
81 |
218541 |
80 |
265508 |
71 |
59379 |
73 |
15363 |
68 |
| Plantation |
12004.6 |
8.8 |
16379 |
6 |
50542 |
14 |
12936 |
16 |
3519.7 |
16 |
| Wasteland |
1571.8 |
1.1 |
3978 |
1.5 |
2788.6 |
0.8 |
1258 |
1.6 |
822.65 |
3.7 |
| Water bodies |
4580.5 |
3.4 |
1501.8 |
0.6 |
17453 |
4.7 |
2404 |
3 |
312.9 |
1.4 |
| |
|
|
|
|
|
|
|
|
|
|
|
| 2004 |
Agriculture |
13028 |
9.5 |
36414 |
13 |
36575 |
9.8 |
3778.9 |
4.6 |
1489.9 |
6.6 |
| Builtup |
2706.5 |
1.9 |
5221 |
1.9 |
7364.2 |
1.9 |
1723.2 |
2.1 |
959.98 |
4.3 |
| Forest |
84127.8 |
61 |
181674 |
66 |
232097 |
62 |
47020 |
58 |
13048 |
58 |
| Plantation |
27836.2 |
20 |
35315 |
13 |
67093 |
18 |
23472 |
29 |
5896 |
26 |
| Wasteland |
1847.4 |
1.4 |
5411 |
2 |
10332 |
2.8 |
1720.5 |
2.1 |
381.97 |
1.7 |
| Water bodies |
7064.4 |
5.2 |
9603 |
3.5 |
20549 |
5.5 |
3484.7 |
4.3 |
836.26 |
3.7 |
Table V: Forest Frgmentation Details of the five river basins (in ha)
| Year |
Category |
Aganashini |
Bedthi |
Kali |
Sharavathi |
Venkatpura |
| 1973 |
Patch |
0.59 |
0.16 |
1.49 |
- |
0.11 |
| Transitional |
189.17 |
322.04 |
1050.52 |
94.99 |
85.40 |
| Edge |
1177.55 |
2398.25 |
4442.65 |
729.81 |
347.26 |
| Perforated |
787.33 |
1478.46 |
3588.78 |
457.62 |
293.29 |
| Interior |
127895.85 |
261524.81 |
337778.54 |
74929.99 |
19506.20 |
| |
|
|
|
|
|
|
| |
Patch |
83.69 |
217.57 |
333.17 |
94.67 |
38.33 |
| Transitional |
631.03 |
1443.65 |
1995.02 |
670.22 |
215.23 |
| Edge |
3638.08 |
6198.87 |
6753.60 |
3155.90 |
889.215 |
| Perforated |
857.74 |
1907.86 |
2526.22 |
839.13 |
269.26 |
| Interior |
120188.05 |
246239.30 |
322328.53 |
66064.81 |
18178.51 |
| |
|
|
|
|
|
|
| 2000 |
Patch |
213.07 |
1326.61 |
1637.77 |
198.690 |
95.52 |
| Transitional |
1201.70 |
4622.81 |
5654.96 |
919.972 |
390.37 |
| Edge |
7263.70 |
18204.16 |
20319.45 |
4262.67 |
1507.74 |
| Perforated |
1169.60 |
3506.29 |
3977.67 |
770.327 |
302.99 |
| Interior |
112006.30 |
205359.76 |
280116.92 |
64838.71 |
16249.80 |
| |
|
|
|
|
|
|
| 2004 |
Patch |
363.82 |
947.32 |
1117.11 |
144.83 |
40.424 |
| Transitional |
2106.73 |
4207.65 |
4414.24 |
781.60 |
243.40 |
| Edge |
11098.47 |
17250.44 |
17408.67 |
4189.86 |
1274.87 |
| Perforated |
2199.95 |
3942.96 |
3120.97 |
717.20 |
275.79 |
| Interior |
92213.32 |
186500.95 |
267026.02 |
62076.267 |
16337.97 |
It is to be noted that Supa dam was constructed in late 1970s. Hence this water body is absent in the 1973 Landsat multi-spectral classified image and prominent in the classified images of 1989, 2000 and 2004 (Fig. 4). Also, there was no waste land in 1973 as per the statistics in Table II. All the rivers are perennial since the catchment areas are mainly composed of interior forest. However, eventually there are drastic land cover changes consequent to unplanned developmental activities. In addition, the dams of major rivers in the district have inundated large vegetation areas. These areas have silt deposit at the river beds and have been classified as sand / waste land.
Forest and plantation were considered as a single class - forest and all other classes were considered as non-forest as the extent of LC is a decisive factor in landslides. While the forest fragmentation map produced valuable information, it also helped to visualise the state of forest for tracking the trends and to identify the areas where forest restoration might prove appropriate to reduce the impact of forest fragmentation. Forest fragmentation also depends on the scale of analysis (window size) and various consequences of increasing the window size are reported in [25]. The measurements are also sensitive to pixel size. Nepstad et al., (1999a, 1999b) [26 and 27] reported higher fragmentation when using finer grain maps over a fixed extent (window size) of tropical rain forest. Finer grain maps identify more non-forest area where forest cover is dominant but not exclusive.
The criterion for interior forest is more difficult to satisfy over larger areas. Although knowledge of the feasible parameter space is not critical, there are geometric constraints [28]. For example, it is not possible to obtain a low value of Pff when Pf is large. Percolation theory applies strictly to maps resulting from random processes; hence, the critical values of Pf (0.4 and 0.6) are only approximate and may vary with actual pattern. As a practical matter, when Pf > 0.6, non-forest types generally appeared as “islands” on a forest background, and when Pf < 0.4, forests appeared as “islands” on a non-forest background. Fig. 6 shows the temporal change in forest patch type, revealing that patch, transitional and edge forest are increasing due to deforestation and interior forest is decreasing. The statistics in Table V shows the decrease in forest patch types from 1973 to 2004. Forest fragmentation is a vital indicator that is accountable for environmental changes. With the expansion of human settlement there is higher risk of forest degradation disturbing the biodiversity, affecting the water quality, endangering wildlife survival, habitat protection, etc.
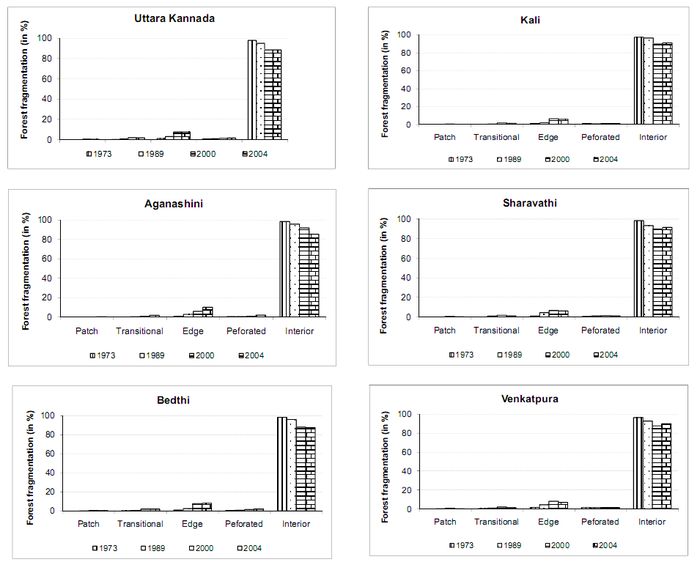
Fig. 6. Temporal Forest fragmentation change of the five river basins of Uttara Kannada district.
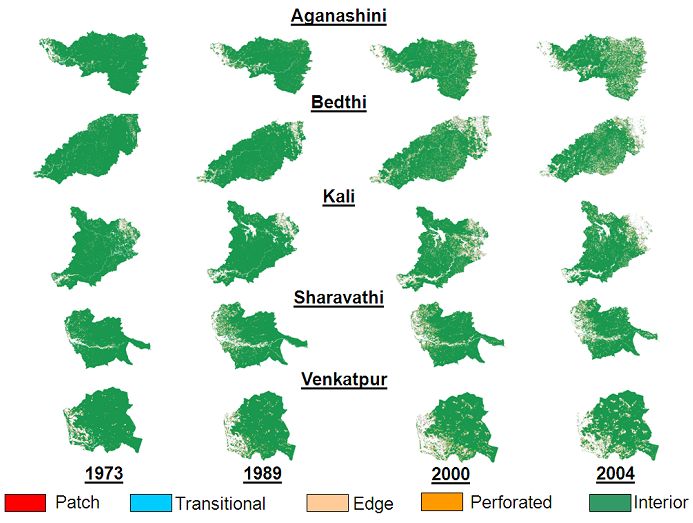
Fig. 6. Forest fragmentation in five river basins in Uttara Kannada district.
The SVM map was 96% accurate with respect to the ground and Kappa values 0.8733 and 0.9083 respectively [29]. Most of the predicted landslide areas as probable landslide prone zones (indicated in red in Fig. 7) reside on terrain that is highly undulating with steep slopes and are frequently exposed to landslides induced by rainfall. Maximum number of landslide points occurring in the undulating terrain, collected from the ground fell in fragmented areas - patch, transitional and edge forest. Fig. 9 shows the landslide occurrence points obtained from ground using handheld GPS overlaid on the classified image of the district (A) and forest fragmentation map (B) based on 2004 RS data. This map indicates that hill slopes with undulating terrain and less vegetation cover (patch, transitional and edge forest) are more susceptible to landslides compared to north-eastern part of the district which has relatively flat terrain with large area utilised under agricultural practices.
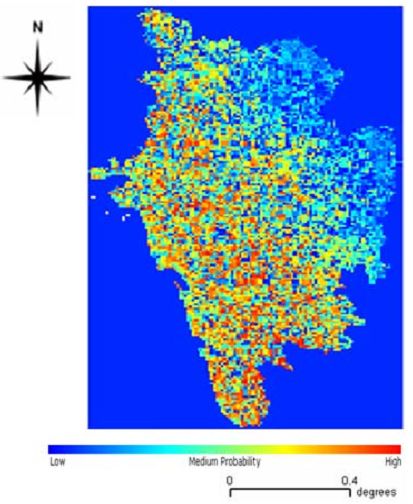
Fig. 7. Probability distribution of the landslide prone areas.
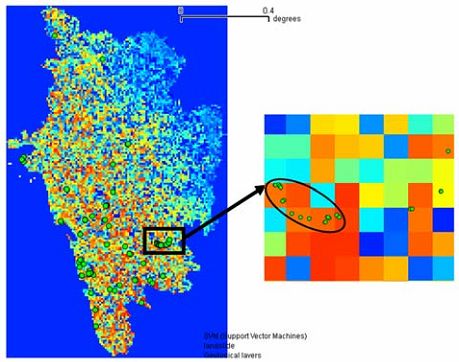
Fig. 8. Validation of the probability distribution of the landslide prone areas by overlaying landslide occurrence points.
The present study makes an effort to quantify forest cover by using fragmentation index for measuring the disturbances due to human impact giving a complete picture of the change that has occurred. The five prominent watersheds of Uttara Kannada district were assessed for quantifying forest fragmentation caused due to anthropogenic disturbances. Forest fragmentation model is useful to visualize state of forest fragmentation for an area and identifying areas where forest restoration might prove appropriate. If the vegetative areas have been cleared, the water retaining capacity of the soil has decreased, triggering landslides in those areas. Hence, there is a immediate need to restore those vegetative by forestation to ensure that the soil is retained on the hill slopes and do not activate any downward movement of the hill tops.
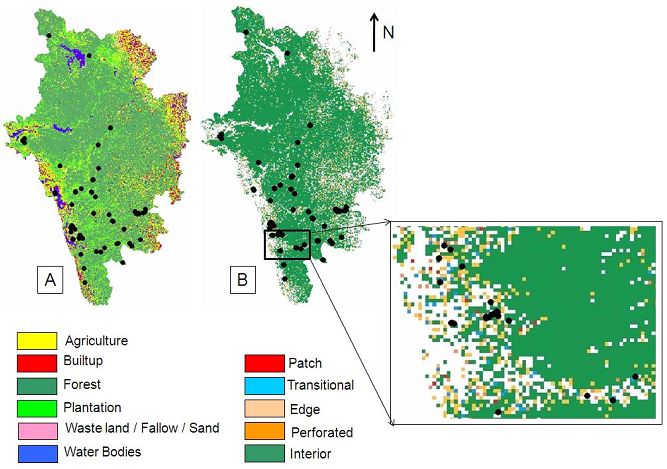
Fig. 9. Landslide susceptibility points overlaid on the classified image of 2004 (A) and forest fragmentation map (B). Black points represent the
occurrence of landslide points obtained using handheld GPS.
Natural disasters have drastically increased over the last decades. National, state and local government including NGOs are concerned with the loss of human life and damage to property caused by natural disasters. The trend of increasing incidences of landslides occurrence is expected to continue in the next decades due to urbanisation, continued anthropogenic activities, deforestation in the name of development and increased regional precipitation in landslide-prone areas due to changing climatic patterns [30].