l |
l |
l |
 |
Lipid composition in microalgal community under laboratory and outdoor conditions |
Energy and Wetlands Research Group, Centre for Ecological Sciences, Indian Institute of Science, Bangalore – 560 012, India
Email: cestvr@ces.iisc.ac.in, supriya@ces.iisc.ac.in
l |
l |
l |
l |
l |
l |
Results and discussion
Physico-chemical parameter
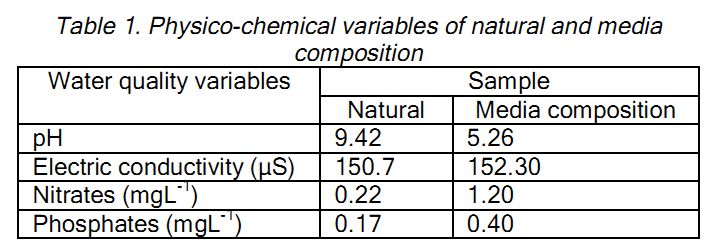
The analysis of water quality variables such as pH, electric conductivity, nitrates and phosphates under natural condition and of media measured on alternative days is listed in Table.1
Table 1. Physico-chemical variables of natural and media composition |
||
| Water quality variables | Sample | |
| Natural | Media composition | |
| pH | 9.42 | 5.26 |
| Electric conductivity (µS) | 150.7 | 152.30 |
| Nitrates (mgL-1) | 0.22 | 1.20 |
| Phosphates (mgL-1) | 0.17 | 0.40 |
Indoor culture conditions: pH in in situ culture conditions did not vary much (range 7–8, Table 2). This is due to the controlled light and dark conditions (16:8 hrs of light intensity 1320 lx). The electrical conductivity was also similar across days [Table 2] due to the restricted conditions. On the 1st day, the nitrate level increased due to the change in the micro algal community (mention reason e.g., uptake of reproduction etc).
Table 2. Physico-chemical variables for 15 days in indoor culture conditions |
||||
| Days | pH | Electrical conductivity (µScm-1) |
Nitrates (mgL-1) |
Phosphates (mgL-1) |
| 1 | 7.56 | 264.50 | 1.57 | 0.13 |
| 3 | 7.45 | 270.50 | 0.81 | 0.15 |
| 5 | 7.47 | 264.00 | 0.89 | 0.12 |
| 7 | 7.25 | 254.00 | 0.49 | 0.17 |
| 9 | 7.78 | 280.00 | 0.68 | 0.11 |
| 11 | 8.02 | 244.50 | 0.85 | 0.26 |
| 13 | 7.66 | 312.50 | 1.03 | 0.19 |
| 15 | 8.09 | 269.00 | 1.37 | 0.31 |
The nitrate thereafter showed steep decrease on 7th day (0.49 mg L-1) with thereafter only increase in the nitrate level on subsequent days (Fig.2). Whereas, the phosphate level showed a decrease throughout the 15 days (Fig. 3) with only slight increase on the 7th, 11th and 15th day (Table 2).
Fig. 2. Concentration of nitrates (mg L-1) in indoor culture conditions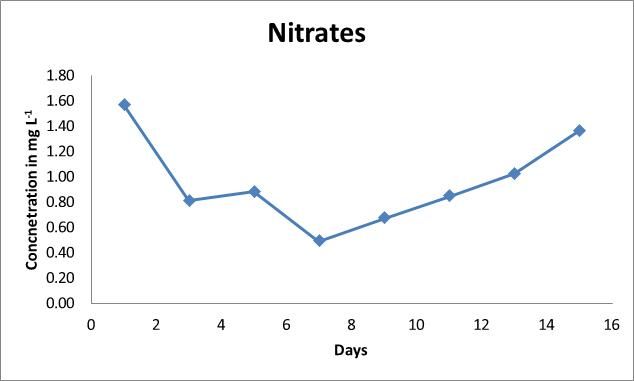
Fig.3. Phosphate concentration (mg L-1) in indoor culture conditions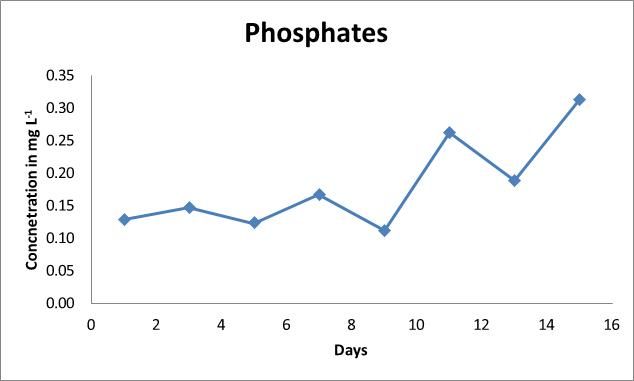
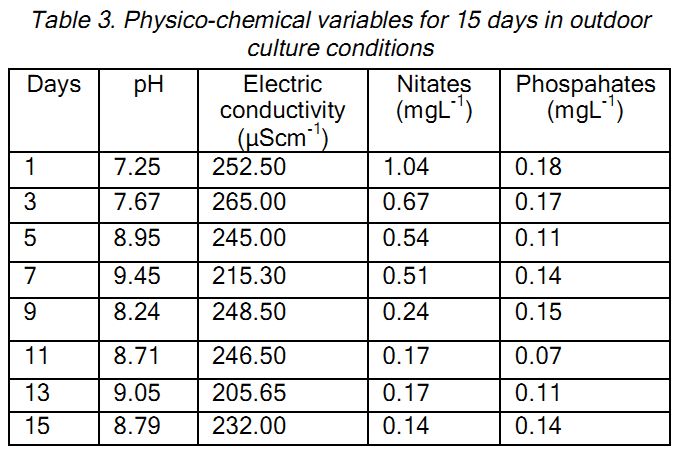
Outdoor culture conditions: In this investigation, water quality in the ex situ was alkaline pH, low conductivity and phosphates values. The pH ranged from acidic i.e., 5.26 (0th day) to alkaline i.e., 9.45 (7th day). The acidic pH, elevated nitrates and phosphates on 0th day are mainly due to the addition of required salts and acid supplied as nutrients to the algal community. Neutral pH on 1st and 3rd day was elevated to alkaline conditions on 5th while conductivity accounted to be high on 3rd day and slowly showed a decline in the values (Table 3). The nitrates varyfrom 1.04 mg L-1 on 1st day to 0.14 mgL-1 on 15th day. The outdoor conditions which varied according to the changes in the surrounding environment could be the reason for the nitrate peak on 7th day (0.51 mgL-1) and thereby a decrease in the following days (Fig.4).
Table 3. Physico-chemical variables for 15 days in outdoor culture conditions |
||||
| Days | pH | Electric conductivity (µScm-1) |
Nitates (mgL-1) |
Phospahates (mgL-1) |
| 1 | 7.25 | 252.50 | 1.04 | 0.18 |
| 3 | 7.67 | 265.00 | 0.67 | 0.17 |
| 5 | 8.95 | 245.00 | 0.54 | 0.11 |
| 7 | 9.45 | 215.30 | 0.51 | 0.14 |
| 9 | 8.24 | 248.50 | 0.24 | 0.15 |
| 11 | 8.71 | 246.50 | 0.17 | 0.07 |
| 13 | 9.05 | 205.65 | 0.17 | 0.11 |
| 15 | 8.79 | 232.00 | 0.14 | 0.14 |
Fig. 4. Concentration of nitrates (mg L-1) in outdoor culture conditions
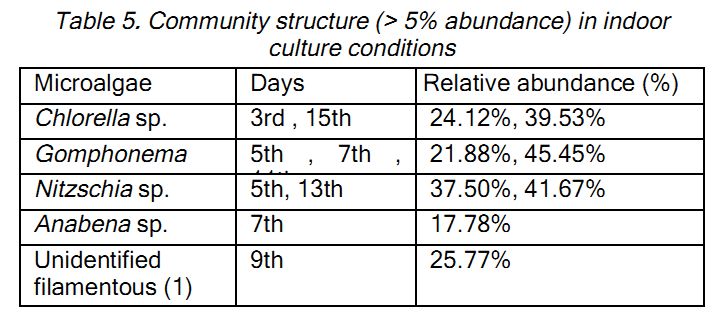
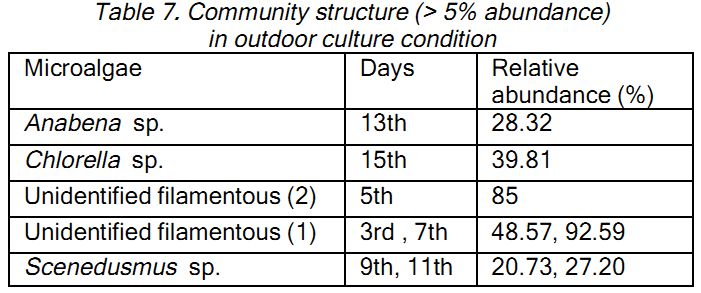
The phosphate levels were found decreasing throughout the 15 days (Fig. 5). The community structure (Table 6) is evident of the change in the nutrient and phosphate levels. The change in the N: P ratio could be attributed to the diverse community of algae (Table 5; Table 7) in the media.
Fig. 5. Phosphate concentration (mg L-1) in outdoor culture conditions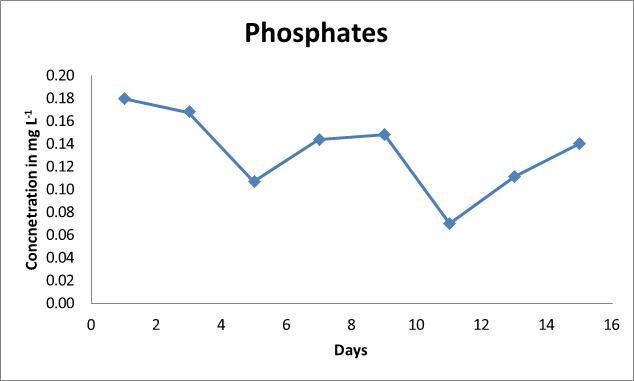
Competition for space and nutrients may occur between and among different species due to the variation in the resources (Tilman, 1982). Since the population is of mixed type consisting of 6 genus (Anabena sp., Chlorella sp., Scenedusmus sp., Unidentified Filamentous algae, Nitzschia sp. & Gomphonema sp.) competition for the resources occurs, which is evident in the community structure (Table 5; Table 7). The N: P ratio does not explain the community structure completely due to mixed population.
Table 5. Community structure (> 5% abundance) in indoor culture conditions |
||
| Microalgae | Days | Relative abundance (%) |
| Chlorella sp. | 3rd , 15th | 24.12%, 39.53% |
| Gomphonema sp. | 5th , 7th , 11th | 21.88%, 45.45% |
| Nitzschia sp. | 5th, 13th | 37.50%, 41.67% |
| Anabena sp. | 7th | 17.78% |
| Unidentified filamentous (1) | 9th | 25.77% |
Table 6. Community structure showing mixed population |
|
| Microalgae | Relative abundance (%) |
| Anabena sp. | 6.60 |
| Chlorella sp. | 8.49 |
| Unidentified filamentous (2) | 7.55 |
| Gomphonema sp. | 16.04 |
| Nitzschia sp. | 12.26 |
| Scenedusmus sp. | 16.04 |
Table 7. Community structure (> 5% abundance) |
||
| Microalgae | Days | Relative abundance (%) |
| Anabena sp. | 13th | 28.32 |
| Chlorella sp. | 15th | 39.81 |
| Unidentified filamentous (2) | 5th | 85 |
| Unidentified filamentous (1) | 3rd , 7th | 48.57, 92.59 |
| Scenedusmus sp. | 9th, 11th | 20.73, 27.20 |
Community analysis
Cells showing more than 5% of relative abundance were considered for the analysis. The natural community showed the presence of Gomphonema sp., Navicula sp., Rhopholodia sp., Chlorella sp., Closterium sp., Pandorina sp. and Anabena sp. with dominant being Navicula sp. and Anabena sp.
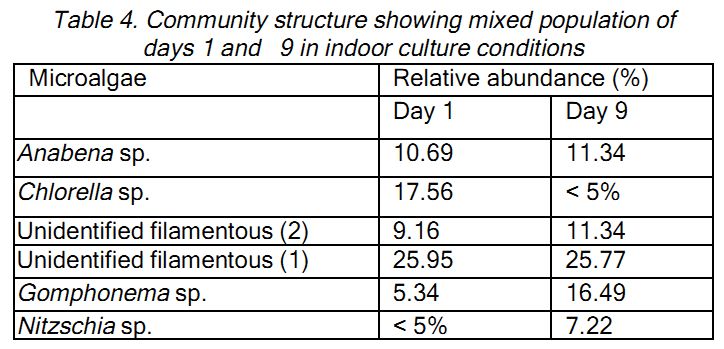
Indoor culture conditions: On Day 1 and 9 the community had a mixed population structure with no clear dominance of any alga (Table 4). The different alga dominated on various days is given in Table 6.
Table 4. Community structure showing mixed population of |
||
| Microalgae | Relative abundance (%) | |
| Day 1 | Day 9 | |
| Anabena sp. | 10.69 | 11.34 |
| Chlorella sp. | 17.56 | < 5% |
| Unidentified filamentous (2) | 9.16 | 11.34 |
| Unidentified filamentous (1) | 25.95 | 25.77 |
| Gomphonema sp. | 5.34 | 16.49 |
| Nitzschia sp. | < 5% | 7.22 |
Outdoor culture conditions: On Day 1 the community had a mixed population structure with no clear dominance of any alga (Table 6). The different alga dominated on respective days is given in Table 6.The change in the N: P values can be attributed to this diverse abundance observed in all the days. Low nitrogen and Low phosphorus conditions often favor the growth of Cyanobacteria in fresh and saltwater systems (Sellner, 1997). In the same way when nitrate and phosphate levels are sufficiently high, it may offer a competitive advantage for diatoms thereby resulting in the reduction of other algae (Pinckney et al., 1995). An increase of nitrogen and phosphorus nutrients may increase the primary production (Cadée, 1986), but the change in the nutrient composition may also affect the phytoplankton composition (Officer & Rhyther, 1980). The dominance of filamentous algae was found due to the consumption of the excessive phosphates (Machnicka, 2006).
Lipid analysis
The fatty acid methyl esters of the microalgae are listed in Table 8. The pattern of fatty acids varies according to the internal and external factors working on the algal cell (Cohen, 1988; Thompson et al., 1990) which concludes that growth rate and the mixed population which competes for the resources, influences on fatty acid composition. Although there are many micro organisms which have the ability to accumulate oils under some special cultivation they have different prospects for biodiesel production in terms of oil yield lipid coefficient and lipid volumetric productivity (Li et al., 2008; Doan et al., 2011). Berglund et al., (2001) reported that both the quantity and quality of lipids produced will vary with the identity of the algal species. Microalgae are efficient biological factories capable of taking zero-energy form of carbon and synthesizing it into a high density liquid form of energy (natural oil) and are capable of storing carbon in the form of natural oils or as a polymer of carbohydrates (Benemann & Oswald, 1996). Under natural growth conditions phototrophic algae absorb sunlight, and assimilate carbon dioxide from the air and nutrients from the aquatic habitats. Therefore, as far as possible, artificial production should attempt to replicate and enhance the optimum natural growth conditions (Hu et al., 2008). Growth of many species of algae is limited by the availability of nitrogen and phosphate (Lapointeand Connell, 1988; Larned, 1998; Russ & Mc Cook, 1999) for eg. Nutrient-enhanced (mixed N and P) cyanobacterial growth was observed by Miller et al., (1999). A number of factors could have contributed to this effect, including temperature, competition and that the algae were in different phases of growth (eg. reproduction, vegetative, senescent) (Kuffnerand Paul, 2001). The resources will influence competitive interactions between algal and cyanobacterial species, the outcomes of which will vary along gradients in environmental variables (Carpenter et al., 1990). Phytoplankton has often to rely on nitrate as nitrogen source (Berman et al., 1984). Since the population was of mixed type, the other algae could have contributed to the lipid profile. The lipid content, lipid class composition and the proportions of the various fatty acids in a microalgae vary according to the environmental or culturing variables such as light intensity, growth phase photoperiod, temperature, salinity, CO2 concentration, nitrogen and phosphorous concentration (Dunstan et al., 1993; Zhu et al., 1997; Wu et al., 2011).
Table 8. Fatty acid methyl esters of microalgae consortium on each day |
||||||||||||||||||||||||||||
| Fatty acid methyl esters | Days | |||||||||||||||||||||||||||
| I1 | D1 | I3 | D3 | I5 | D5 | I7 | D7 | I9 | D9 | I11 | D11 | I13 | D13 | I15 | D15 | |||||||||||||
| Microalgal consortium | ||||||||||||||||||||||||||||
| C+ F1 | G+ S | C | F1 | G+ N | F2 | A+ G | F1 | F1+G | S+ C | G+ N | S+N + C | N+ C | A+ C+ N | C+ N | C | |||||||||||||
| : 9-Hexadecenoic acid, methyl ester | + | |||||||||||||||||||||||||||
| : 9-Octadecenoic acid, methyl ester | + | |||||||||||||||||||||||||||
| 11-Octadecenoic acid, methyl ester | + | |||||||||||||||||||||||||||
| Decanoic acid, methyl ester | + | + | + | + | + | |||||||||||||||||||||||
| Docosanoic acid, methyl ester | + | |||||||||||||||||||||||||||
| Dodecanoic acid, methyl ester | + | + | + | + | + | + | + | + | + | + | + | + | + | + | ||||||||||||||
| Eicosanoic acid, methyl ester | + | + | + | + | + | + | + | + | + | + | + | |||||||||||||||||
| Heptadecanoic acid, methyl ester | + | + | + | + | + | + | ||||||||||||||||||||||
| Hexadecanoic acid, 14-methyl-, | + | + | + | + | + | + | + | + | ||||||||||||||||||||
| Hexadecanoic acid, methyl ester | + | + | + | + | + | + | + | + | + | + | + | + | + | + | + | + | ||||||||||||
| Hexanoic acid, methyl ester | + | + | ||||||||||||||||||||||||||
| Methyl 13-methyltetradecanoate | + | + | ||||||||||||||||||||||||||
| Methyl tetradecanoate | + | + | + | + | + | + | + | + | + | + | + | + | + | + | + | + | ||||||||||||
| Octadecanoic acid, methyl ester | + | + | + | + | + | + | + | + | + | + | + | + | + | + | + | + | ||||||||||||
| Octanoic acid, methyl ester | + | + | + | + | + | + | + | + | ||||||||||||||||||||

| * Corresponding Author : | |||
| Dr. T.V. Ramachandra Energy & Wetlands Research Group, Centre for Ecological Sciences, Indian Institute of Science, Bangalore – 560 012, INDIA. Tel : 91-80-23600985 / 22932506 / 22933099, Fax : 91-80-23601428 / 23600085 / 23600683 [CES-TVR] E-mail : cestvr@ces.iisc.ac.in, energy@ces.iisc.ac.in, Web : http://wgbis.ces.iisc.ac.in/energy |
|||