|
RESULTS AND DISCUSSION
Greater Bangalore
Seven separate classifications summarised in Table I were carried out with different combinations of Landsat ETM+ bands and various geographical layers. Fig. 4 shows classified image with highest overall accuracy (Classification No. 7) and the LC statistics are listed in Table II. The producer’s and user’s accuracies are not presented due to space constraint. Overall accuracies with kappa statistic are given in Table VI. Outputs obtained from the original spectral bands along with temperature, NDVI, EVI, elevation, slope and aspect (Classification No. 1, 2, 3 and 4) had misclassified many pixels belonging to builtup, water and open area. Water class was over estimated as many paved road (tar or concrete) pixels belonging to builtup were classified as water. Addition of texture, PAN band and texture of PAN significantly improved the classification accuracy of all the classes including urban and water bodies as evident from Table II (highlighted in bold). From accuracy assessment in Table VI it is evident that Classification 5, 6 and 7 have higher accuracies compared to other classifications. Inclusion of temperature increased accuracy whereas addition of vegetation index layers along with elevation, slope and aspect decreased the overall accuracy.
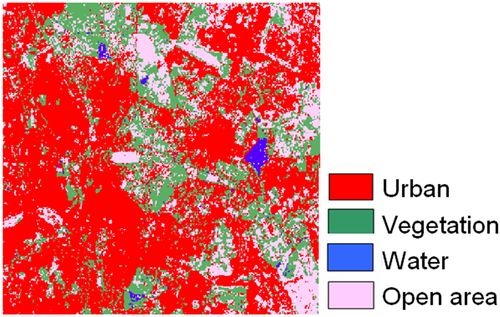
Figure 4: Classified outputs from Landsat ETM+ bands by adding additional geographical layers for Bangalore City
Table I: Details of data and ancillary layers for classification of ETM+ data for a part of Greater Bangalore
| Classif-ication No. |
RS data and ancillary geographical layers used |
Total number of input layers in the classification |
| 1 |
ETM+ bands 1, 2, 3, 4, 5 and 7 at 30 m |
6 |
| 2 |
ETM+ bands 1, 2, 3, 4, 5, 7 and Temperature |
7 |
| 3 |
ETM+ bands 1, 2, 3, 4, 5, 7, NDVI, EVI, elevation, slope and aspect |
11 |
| 4 |
ETM+ bands 1, 2, 3, 4, 5, 7, Temperature, NDVI, EVI, elevation, slope and aspect |
12 |
| 5 |
ETM+ bands 1, 2, 3, 4, 5, 7, Temperature, NDVI, EVI, elevation, slope and aspect,
texture (ASM, contrast, entropy, variance) at 0, 45, 90 and 135 degrees for ETM+ bands 1, 2, 3, 4, 5, 7 |
108 |
| 6 |
ETM+ bands 1, 2, 3, 4, 5, 7, Temperature, NDVI, EVI, elevation, slope and aspect,
texture (ASM, contrast, entropy, variance) at 0, 45, 90 and 135 degrees for ETM+ bands 1, 2, 3, 4, 5, 7 |
109 |
| 7 |
ETM+ bands 1, 2, 3, 4, 5, 7, Temperature, NDVI, EVI, elevation, slope and aspect, ETM+ PAN, texture (ASM, contrast, entropy, variance) at 0, 45, 90 and 135 degrees for ETM+ bands 1, 2, 3, 4, 5, 7, and ETM+ PAN |
125 |
Table II: Area statistics for Greater Bangaore City
Class →
Classification
Area ↓ |
Urban |
Vegetation |
Water |
Open area |
| 1 |
ha |
4543 |
1912 |
600 |
1999 |
| % |
50.17 |
21.12 |
6.63 |
22.08 |
| 2 |
ha |
4014 |
1826 |
561 |
2653 |
| % |
44.34 |
20.17 |
6.19 |
29.30 |
| 3 |
ha |
4245 |
1884 |
471 |
2446 |
| % |
46.93 |
20.83 |
5.21 |
27.03 |
| 4 |
ha |
3450 |
1854 |
555 |
3189 |
| % |
38.14 |
20.49 |
6.13 |
35.24 |
| 5 |
ha |
5263 |
1906 |
94 |
1755 |
| % |
58.36 |
21.13 |
1.04 |
19.46 |
| 6 |
ha |
5226 |
1888 |
87 |
1879 |
| % |
57.96 |
20.94 |
0.96 |
20.15 |
| 7 |
ha |
5164 |
1974 |
66 |
1813 |
| % |
57.27 |
21.89 |
0.73 |
20.11 |
| Total = 9054.62 ha (100%) |
Table III: Details of data and ancillary layers for classification of a part of Central Western Ghats
| Classi-fication No. |
RS data and ancillary geographical layers used |
Total number of input layers in the classification |
| 1 |
ETM+ bands 1, 2, 3, 4, 5 and 7 at 30 m |
6 |
| 2 |
ETM+ bands 1, 2, 3, 4, 5, 7 and Temperature |
7 |
| 3 |
ETM+ bands 1, 2, 3, 4, 5, 7, elevation |
7 |
| 4 |
ETM+ bands 1, 2, 3, 4, 5, 7, EVI |
7 |
| 5 |
ETM+ bands 1, 2, 3, 4, 5, 7, elevation, slope and aspect |
9 |
| 6 |
ETM+ bands 1, 2, 3, 4, 5, 7, Temperature, EVI, PAN |
9 |
| 7 |
ETM+ bands 1, 2, 3, 4, 5, 7, Temperature, EVI, PAN, texture (contrast, variance) at 0, 45, 90 and 135 degrees for ETM+ bands 1, 2, 3, 4, 5, 7, and ETM+ PAN |
65 |
Table IV: Area statistics for for a part of Central Western Ghats
Class →
Area ↓ |
Agriculture |
Builtup |
Forest |
Plantation |
Waste
land |
Water |
| 1 |
ha |
8721 |
730 |
37672 |
4198 |
886 |
651 |
| % |
16.5 |
1.38 |
71.26 |
7.94 |
1.68 |
1.23 |
| 2 |
ha |
8179 |
854 |
36978 |
5195 |
929 |
724 |
| % |
15.47 |
1.61 |
69.96 |
9.83 |
1.76 |
1.37 |
| 3 |
ha |
9315 |
889 |
20812 |
21360 |
482 |
- |
| % |
17.62 |
1.68 |
39.37 |
40.41 |
0.91 |
- |
| 4 |
ha |
8973 |
709 |
37595 |
4059 |
898 |
624 |
| % |
16.98 |
1.34 |
71.12 |
7.68 |
1.70 |
1.18 |
| 5 |
ha |
9738 |
852 |
19589 |
22217 |
463 |
- |
| % |
18.42 |
1.61 |
37.06 |
42.03 |
0.88 |
- |
| 6 |
ha |
9456 |
893 |
36492 |
4746 |
604 |
666 |
| % |
17.89 |
1.69 |
69.04 |
8.98 |
1.14 |
1.26 |
| 7 |
ha |
8558 |
8.50 |
42689 |
276 |
823 |
504 |
| % |
16.19 |
0.02 |
80.76 |
0.52 |
1.56 |
0.95 |
| Total = 52858.47 (100%) |
When both temperature and vegetation index with elevation, slope and aspect were used, the accuracy still decreased. However, inclusion of texture and PAN significantly increased the overall accuracy.
There was 7.6% increase in accuracy by adding temperature, NDVI, EVI, elevation, slope, aspect, PAN along with texture measures (Classification No. 7), which proved to be useful for medium spatial resolution data such as ETM+ while discriminating different classes in an urban environment.
Central Western Ghats
Seven classifications were carried out with different combinations of Landsat ETM+ and geographical layers into agriculture, builtup, forest, plantation, wasteland and water bodies that are the six major categories in the forested and mountainous terrain of Uttara Kannada district in Central Western Ghats (Fig. 2). Landsat ETM+ PAN band was resampled to 15 m. The total number of geographical layers was 65 (Table III). Figure 5 shows the classified image with highest classification accuracy (Classificaiton No. 2) and the LC statistics are listed in Table IV. The accuracy assessment table (Table VI) showed that temperature plays a major role in classification in a forested area with highest classification accuracy (88.26%, kappa=0.8643), followed by Classification No. 4 (85.87%, kappa=0.8326). Inclusion of NDVI in spectral bands classification produced very low accuracy, so was removed from further analysis. Addition of elevation, slope and aspect did not improve classification accuracy (Classification No. 3 and 5), and hence were removed from subsequent classifications. Addition of these layers misclassified forest as plantation (> 40% of the area was misclassified as plantation) and wasteland were under estimated. Water bodies could not be detected. Outputs obtained from original spectral bands along with temperature, EVI and PAN (Classification No. 2, 4 and 6) improved the classification results. Texture could not resolve differences between plantation and forest, and plantation was under estimated. EVI increased the classification accuracy by 4.3% (Classification No. 1 and 4) and temperature, EVI and PAN together increased the overall accuracy by 1.6% (in Classification No. 6) compared to the classification of only original spectral bands.
All other layer combinations decreased the accuracy. Overall, the highest classification accuracy improved by 6.7% with temperature as an additional layer.
Western Himalaya
Nine classifications were carried out with different combinations of Landsat ETM+ bands and geographical layers (Table V) into four categories - vegetation, water, snow and others (settlement, rock, barren) in the rugged terrain of Western Himalaya (Fig. 3). Landsat ETM+ PAN band was resampled to 15 m.
The total number of geographical layers was 104 (Table V, Classification No. 8). LC statistics, producer’s and user’s accuracies are not shown here due to space constraint. Overall accuracies and kappa are given in Table VI. Classification of 6 spectral bands and addition of EVI (Classification No. 1 and 4) over estimated the “others” category. In Classification No. 8 (ETM+ bands 1, 2, 3, 4, 5, 7 with temperature, EVI and texture) and 9 (ETM+ bands 1, 2, 3, 4, 5, 7 and texture), others category was not identified. In both these cases, vegetation is over estimated because of misclassification of others category.
Table V: Details of data and ancillary layers for Western Himalaya
| Classi-fication No. |
RS data and ancillary geographical layers used |
Total number of input layers in the classification |
| 1 |
ETM+ bands 1, 2, 3, 4, 5 and 7 at 30 m |
6 |
| 2 |
ETM+ bands 1, 2, 3, 4, 5, 7 and Temperature |
7 |
| 3 |
ETM+ bands 1, 2, 3, 4, 5, 7, elevation |
7 |
| 4 |
ETM+ bands 1, 2, 3, 4, 5, 7, EVI |
7 |
| 5 |
ETM+ bands 1, 2, 3, 4, 5, 7, elevation, slope and aspect |
9 |
| 6 |
ETM+ bands 1, 2, 3, 4, 5, 7, Temperature, EVI, elevation, slope and aspect |
11 |
| 7 |
ETM+ bands 1, 2, 3, 4, 5, 7, Temperature, EVI, elevation, slope, aspect and ETM+ PAN |
12 |
| 8 |
ETM+ bands 1, 2, 3, 4, 5, 7, Temperature, EVI, texture (ASM, contrast, entropy, variance) at 0, 45, 90 and 135 degrees for ETM+ bands 1, 2, 3, 4, 5, 7 |
104 |
| 9 |
ETM+ bands 1, 2, 3, 4, 5, 7 and texture (ASM, contrast, entropy, variance) at 0, 45, 90 and 135 degrees for ETM+ bands 1, 2, 3, 4, 5, 7 |
102 |
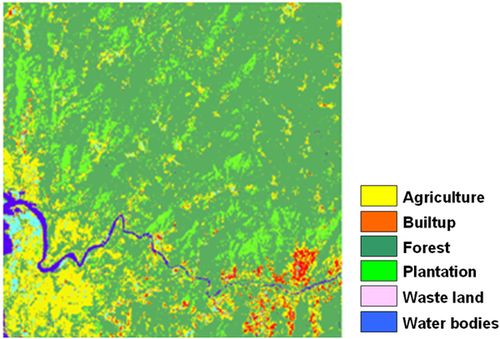
Figur 5: Classified output from Landsat ETM+ bands by adding additional geographical layers for a part of Central Western Ghats
The optimum LC classification result with different layers in a rugged terrain is shown in Fig. 6 (Classification No. 7). From accuracy (Table VI), it is evident that addition of each layer in subsequent classifications improvised the classification accuracy (Classification No. 2 to 7), compared to only spectral bands (Classification No. 1). Output obtained from original spectral bands along with temperature, EVI, elevation, slope, aspect and PAN showed highest classification accuracy. However, addition of texture did not show any improvement in classification (Classification No. 8 and 9). Addition of temperature layer increased the classification accuracy by 3.76% (Classification No. 1), elevation by 4.18% (Classification No. 3), EVI by 1% (Classification No. 4), elevation, slope and aspect by 5.32% (Classification No. 5) and temperature, EVI, elevation, slope, aspect and PAN together increased the overall accuracy by 10.84% (in Classification No. 7) compared to the classification of only original spectral bands. The analysis revealed that in a rugged terrain with temperate climate, temperature, EVI, elevation, slope, aspect and PAN play major role in improving the classification with highest classification accuracy (Classification No. 7, overall accuracy=89.97, kappa=0.8755). However, texture combinations decreased the accuracy.
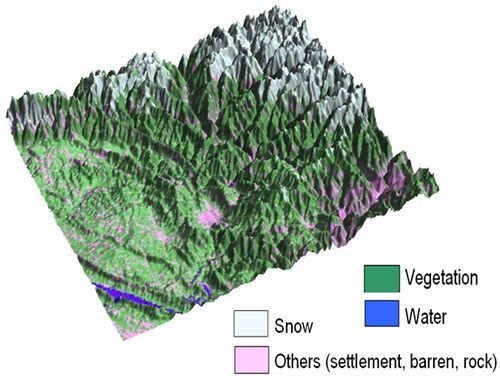
Figure 6: Classified output from Landsat ETM+ bands by adding additional geographical layers for a part of Western Himalaya
Table VI: Details of data and ancillary layers for Western Himalaya
| Classi-fication No. |
Study Area |
| Greater Bangalore |
Central Western Ghats |
Western Himalaya |
| OA* |
 |
OA* |
 |
OA* |
 |
| 1 |
75.50 |
0.7309 |
81.56 |
0.7856 |
79.13 |
0.7789 |
| 2 |
77.94 |
0.7548 |
88.26 |
0.8643 |
82.98 |
0.7999 |
| 3 |
73.12 |
0.7101 |
61.59 |
0.4931 |
83.31 |
0.8122 |
| 4 |
71.43 |
0.6811 |
85.87 |
0.8326 |
80.18 |
0.7865 |
| 5 |
81.84 |
0.7978 |
61.69 |
0.4874 |
84.45 |
0.8222 |
| 6 |
82.89 |
0.8077 |
83.16 |
0.8014 |
87.23 |
0.8511 |
| 7 |
83.15 |
0.8125 |
77.64 |
0.7552 |
89.97 |
0.8755 |
| 8 |
- |
- |
78.91 |
0.7581 |
| 9 |
- |
- |
77.19 |
0.7441 |
*OA-Overall accuracy,  -Kappa -Kappa |
In this work, the scope of derived and ancillary layers were assessed for their performance in improving classification accuracy in three diverse terrains. The results provided new insights to the likelihood of improved performance of LC classification by use of supplemental layers related to the region along with the RS data. Although it is difficult to identify suitable texture which is dependent on image band and window size for the specific study, appropriate texture measures reduce the spectral variation within the same LC and also improves the spectral separability among different LC classes. Hilly regions are difficult to classify using RS data due to complex surface features. In this work, temperature, EVI, elevation, slope, aspect and PAN played a major role in increasing the classification accuracy to 89.97% (improvement by 10.84%), compared to the classification of only original spectral bands in a rugged terrain with high altitudinal variations. This accuracy is higher than use of fractral dimension data and original ETM+ data in a Chinese subtropical hilly region (accuracy of 80.69%) by Zhu et al., (2011) [18]. However, in addition to the use of ancillary layers such as textural images, selection of different seasonal data with suitable classification algorithms is also needed to improve classification performance [5].
|
