

Image Fusion Methods
A. À Trous algorithm based wavelet transform (ATW) : Multiresolution analysis based on the wavelet transformation (WT) is based on the decomposition of the image into multiple channels depending on their local frequency content. While the Fourier transform gives an idea of the frequency content in image, the wavelet representation is an intermediate representation and provides a good localisation in both frequency and space domain [1]. The WT of a p.d.f. (probability density function) f(t) is expressed as
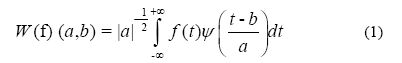
where a and b are scaling and transitional parameters, respectively. Each base function  is a scaled and translated version of a function ψ called Mother Wavelet. These base functions are such that
 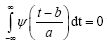 . Most of the WT algorithms produce results that are not shift invariant. An algorithm proposed by Starck and Murtagh [2] uses a WT known as à trous to decompose the image into wavelet planes that overcomes this problem. Given an image p we construct the sequence of approximations:
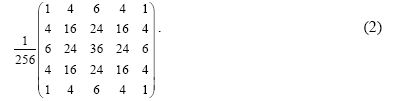
  . by performing successive convolutions with a filter obtained from an auxiliary function (F1, F2, F3) named scaling function which has a B3 cubic spline profile. The use of a B3 cubic spline leads to a convolution with a mask of 5 x 5:
The wavelet planes are computed as the differences between two consecutive approximations ![]() and
and ![]() . Letting
. Letting ![]() , in which p0 = p, the reconstruction formula can be written as
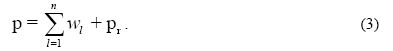
, in which p0 = p, the reconstruction formula can be written as
 .
.
The image  are versions of original image p,
 are the multiresolution wavelet planes, and pr is a residual image. The wavelet merger method is based on the fact that, in the wavelet decomposition, the images are the successive versions of the original image. Thus the first wavelet planes of the HR PAN image have spatial information that is not present in the MS image. In this paper, we follow the Additive methods [1] where the HR PAN image is decomposed to n wavelet planes. For 1:4 fusion (as in IKONOS image) n is set to 2.

The wavelet planes (WPl) of the PAN decomposition are added to the LR MS images individually to get HR MS images.
B. Multiresolution Analysis–Based Intensity Modulation (MRAIM) : MRAIM [3] takes into consideration M-band wavelet theory [4] and à trous algorithm [5]. Multiresolution analysis decomposition method is the tool to decompose signals to their approximation and detail information. M-band wavelet is different from the most popularly used dyadic WT in the sense that M-band WT decomposes the frequency domain into M-channels while dyadic WT decomposes into 2 channels. So M-band WT can be used to compute the approximations at resolution M (M is an arbitrary integer larger than 0) while dyadic WT is limited to the resolution of 2r (r ε I). The key problem to realise this approach is to construct K-regularity M-band scale filters (the construction of K-regularity M-band scale filters is explained in more detail at http://www.ee.umanitoba.ca/~ferens/wavelets.html). K-regularity is equivalent to saying that all polynomials of degree (K-1) are contained in approximation. This coupled with the compact support characteristic of the scaling filters implies that K-regularity scaling filters can be used to capture local polynomial behaviour. Steffen et al., (1993) [4] introduced the formula for K-regularity M-band scaling filter H0(z) in the Z transform of the analysis and synthesis process of the M-band scaling, which is just as in the 2-band case Daubechies’ construction. For K=2, the minimal phase solution for arbitrary M is
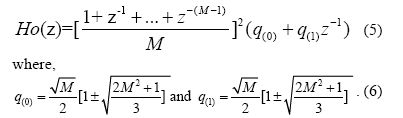
Upon the construction of the scale filters, the à trous algorithm is applied to compute the PAN image at the LR level by filtering. Given an image p1, at resolution level 1, the approximation pM at resolution level M can be computed by low-pass filtering the image p1. The reconstruction formula is 
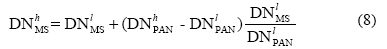
Once the approximation image pM is obtained, it can be used to estimate LR PAN (DNlPAN) and the HR MS (DNhMS) images as follows:
C. Gram Schmidt (GS) Fusion : In GS fusion [6] method, PAN band is simulated from the LR MS bands. A GS transformation is performed on the simulated PAN and the MS bands, where the simulated PAN band is employed as the first band. Then the HR PAN band is swapped with the first GS band. Finally, the inverse GS transform is applied to form the pan-sharpened spectral bands. A LR PAN band is simulated in one of the two methods: In the first method, the appropriate LR MS bands are combined into a single, simulated LR PAN by calculating the appropriate weights. In order to combine the MS data (B, G, R and NIR bands) into the simulated PAN band, weights for each of the 4 bands can be calculated by
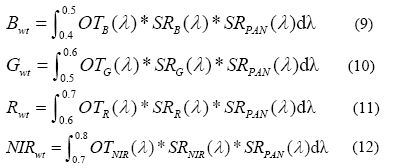
where OT is the optical transmittance, SR is the spectral response and λ is the wavelength. For more details see [6]. The simulated PAN band is created by

In the second method, LR PAN is produced from the HR PAN band. The HR PAN is blurred (by the appropriate factor), sub-sampled, and interpolated up to the appropriate scale. The simulated LR PAN is now used as the first band of the LR MS data which is to be input into the original MS band to Gram Schmidt (GS) transform.

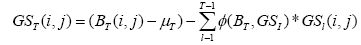
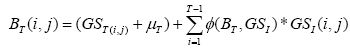
where i is the row number and j is the column number, and GS1 is the first Gram-Schmidt transformed band. GS method orthogonalises the matrix data or bands of an image which removes redundant (correlated) information that is contained in multiple MS bands. If there were perfect correlation between input bands, the final band will contain all zeros. In GS method, the mean of each band is subtracted from each pixel in the band before the orthogonalisation is performed. The Tth GS band is constructed from the previous T-1 GS bands using
 |
(15) |
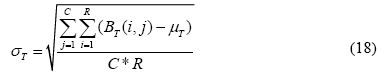
where T is the band number being transformed, B is the original band, and μT is the mean of the band T given by
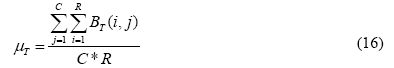
where C is the total number of columns in the image, R is the total number of rows in the image, and ф(BT, GSI) is given by
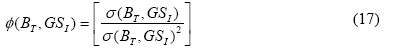
(i.e. covariance between the given GS band and the original band B, divided by the variance of that GS band). The mean (μ) and standard deviation (σ) of the first GS band and the HR PAN are then calculated.
The HR PAN image (P) is then stretched so that its mean digital count (μp) and standard deviation (σP) match the mean (μGS1) and standard deviation (σGS1) of the first GS band which helps to preserve the spectral characteristics of the original MS data.
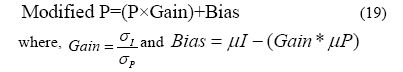
The stretched HR PAN band and the first GS band, which is actually the simulated LR PAN band have similar global and local statistics. The stretched HR PAN image is then swapped for the first GS band, and the data is transformed back into original MS space producing HR MS bands by (20).
 |
(20) |
D. CN Spectral (CNS) : CNS sharpening can be used to simultaneously sharpen any number of bands and retains the input image's original data type and dynamic range. Input MS bands are sharpened only if they fall within the spectral range of one of the Sharpening Image's bands (PAN band). The spectral range of the PAN is defined by the band center wavelength and full width-half maximum (FWHM) value, both obtained from the PAN image. MS bands are grouped into spectral segments defined by the spectral range of the PAN band. Each MS band is multiplied by the PAN band, then normalized [7]. For a MS data with 4 bands, the above formula may be generalised as
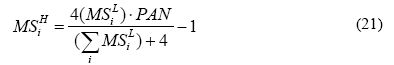
where MSiH are the fused images, MSiL are the LR MS bands, PAN is a HR panchromatic band, and i = band 1 to band 4.
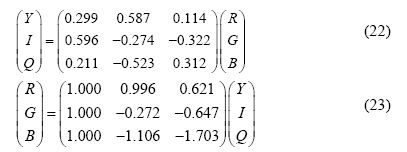
E. Luminance Chrominance (LC) : YIQ has a straightforward transformation from RGB with no loss of information [8]. Y is the luminance (brightness of a PAN image) which combines the red, green, and blue signals in proportion to the human eye’s sensitivity to them, I is red minus cyan and Q is magenta minus green. The relations between YIQ and RGB are (22) and (23):
F. High pass fusion (HPF) : HPF method convolves a high pass filter over a HR image to extract spatial information and a low pass filter over a LR image to extract spectral information. Two images are combined as proposed by Vrabel (1996) [9] given in (24).

W1 and W2 are weights with W1 + W2 = 1, LRi is the LR band after low pass filtering and HR is the PAN band after high pass filtering. Experimentally, it was determined that the best balance of spectral and spatial information involved weights of W1=0.80, W2=0.20 [10].