

Data Analysis and Results
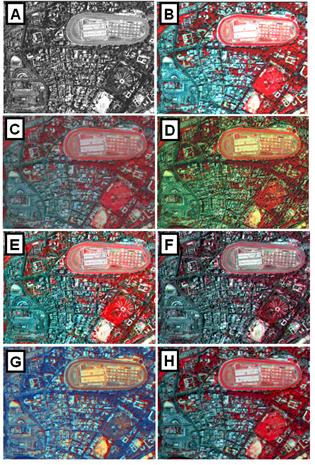
IKONOS PAN data at 11 bits per pixel (525.8 – 928.5 μm, 1 m resolution, acquired on February 23, 2004) of size 1200 x 1600 and 4 m resolution MS bands (Red, Green, Blue and NIR, acquired on November 24, 2004) of size 300 x 400, covering a portion of Bangalore city, India were used to test the performance of the methods. The pairs of the images were registered to each other and the LR images were upsampled to 1200 x 1600 by nearest neighbour algorithm. The correlation coefficients (CCs) between PAN (downsampled to 4 m pixel size) and the original Blue band was 0.41, PAN and Green was 0.44, PAN and Red was 0.47 and PAN and NIR was 0.59. CC of the NIR band is higher than CCs of other bands, indicating that IKONOS NIR band is very important to the IKONOS PAN band. Fig. 1 (A) shows the PAN image and (B) shows the false colour composite (FCC) of the G-R-NIR combination resampled at 1 m pixel size. It is obvious that PAN image has better spatial resolution than the MS images and more detail can be seen in the PAN image. Image fusion is attempted here to simulate IKONOS MS data acquired at LR (4 m) to HR (1 m), which is identical to MS images had there been a ideal sensor that would originally acquire MS at high resolution (1 m). G-R-NIR combination was chosen for generating FCC in LC method, which can consider only 3 bands. In the ATW method decomposition level (n) was set to 2 as the resolution ratio between the IKONOS PAN and MS is 1:4. Low pass and high pass filters of size 3×3 were used in the HPF method. Fig. 1 (C–H) depicts the FCC of the fused images at 1 m obtained from ATW, MRAIM, GS, CNS, LC and HPF methods. The performance is evaluated in terms of the quality of synthesis of both spatial and spectral information. MRAIM and LC (Fig. 1 D and G) produce significant color distortion, while ATW, CNS and HPF (Fig. 1 C, F and H) produce slight colour distortion in buildings/builtup area. ATW, MRAIM, and HPF exhibit sharpness due to enhancement along the edges because these methods have considered the high-frequency information between the PAN and the MS bands. A universal image quality index (UIQI) to measure the similarity between two images [4] is designed by a combination of (i) loss of correlation, (ii) radiometric distortion, and (iii) contrast distortion given by 25.
The first component is the CC for A (original MS band) and B (fused MS band). The second component measures how close the mean gray levels of A and B is, while the third measures the similarity between the contrasts of A and B. The dynamic range is [-1, 1]. If two images are identical, the similarity is maximal and equals 1. The synthesised HR MS images are spatially degraded to the resolution level of the original LR MS images (4 m). UIQI are computed between the degraded HR MS images and the original LR MS images. Table I shows that the UIQI values of the HPF, ATW and MRAIM methods are higher than the UIQIs of other methods. The UIQI of ATW in the NIR band is highest than the other values. Table II shows the CC between the IKONOS HR PAN image and the corresponding simulated LR PAN images by different methods (computed at 1 m pixel size). HPF, ATW and MRAIM show high CC with respect to the corresponding LR PAN image. It can be seen from Tables I and II that the degree of similarity between the HR PAN image and the LR PAN image correspond to the degree of spectral distortion of each band. The lower the similarity between the HR PAN image and the LR PAN image, the higher the spectral distortion and vice versa. Therefore from the UIQI method, HPF is superior to all other methods but only slightly better than ATW. The closeness between two images was quantified in terms of correlation (Fig. 2). Each band of the original IKONOS MS data were correlated with respect to the corresponding fused band obtained from the 6 techniques (except in LC where only G, R, and NIR were considered).
TABLE I. UIQI measurements of the similarity between original and the fused images obtained by various methods
| Blue | Green | Red | NIR | |
| ATW | 0.83 | 0.92 | 0.95 | 0.99 |
| MRAIM | 0.81 | 0.89 | 0.91 | 0.93 |
| GS | 0.49 | 0.44 | 0.46 | 0.43 |
| CNS | 0.12 | 0.29 | 0.43 | 0.43 |
| LC | - | 0.12 | 0.92 | 0.61 |
| HPF | 0.93 | 0.94 | 0.93 | 0.94 |
TABLE II. Correlation between the IKONOS hr PAN image and the corresponding lr PAN image by different methods
| ATW | MRAIM | GS | CNS | LC | HPF |
| 0.85 | 0.80 | 0.65 | - | 0.71 | 0.86 |
| p value for all CC = 2.2e-16 | |||||
| LC is limited to three bands (G-R-NIR combination). PAN image was used in CNS without any transformation. |
|||||
Figure 1. (A) Original PAN image, (B) Original low resolution MS image (G-R-NIR) resampled at 1 m pixel size, fusion results from (C) ATW, (D) MRAIM, (E) GS, (F) CNS, (G) LC and (H) HPF.
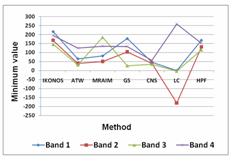
HPF followed by ATW and MRAIM produce very high correlation of more than 0.9 with all the bands. Statistical parameters – minimum (min), maximum (max) and the standard deviation (sd) were plotted (Figs. 3–5) to examine the spectral information preservation. HPF and GS were closest to the min values of the original bands, while LC produced negative values. For the max values, in all the bands, values obtained from ATW method were close to the max of original bands. It is to be noted that the max values obtained from one of the best performing method till now – HPF, is lower than the original values for all the 4 bands. GS and CNS were close to original in band 1, 2 and 3 and LC maximum values were close in band 2 and 3 (it does not have band 1 as in other methods). The sd values for the ATW followed by HPF were similar to the original bands of the IKONOS. All other methods showed deviations. ATW and HPF are better compared to other methods. ATW has high UIQI values for Red and NIR bands whereas HPF has highest UIQI scores in Blue and Green bands. The CC values between the HR PAN and LR PAN for ATW is 0.85 and HPF is 0.86. The CC between fused and original band is higher for HPF method and the min values of the fused images from HPF are also closest to the original PAN image. However, the max values and the sd values of the fused bands obtained from ATW are closest to the original band values.
Figure 2. Correlation between original images and corresponding fused images.
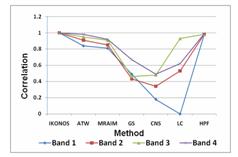
Figure 3. Minimum values of the original images and the fused images.
This give an ambiguous result as both methods have very much similar scores and the results remain inconclusive. Hence, the only measure that can decide the best technique among the two is the role of the NIR band in these methods for which the CC was found highest with PAN band (0.59). Fused NIR band obtained from ATW (table III) is close to original NIR band in terms of UIQI, max value and sd values whereas HPF method results is closest to original NIR band in terms of CC and min values. Overall ATW has a lead in terms of UIQI measure, so we conclude that ATW method followed by HPF produce the images closest to those the corresponding multisensors would observe at the HR level