Conclusion
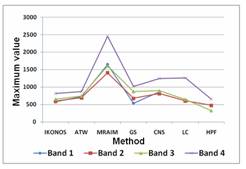
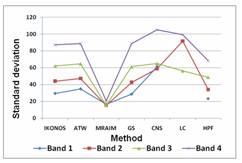
ATW followed by HPF are best among the six techniques discussed here for image fusion as the output is closest to what is expected had there been a corresponding multisensor observation at the high resolution level of PAN.

Figure 4. Maximum values of the original images and the fused images.

Figure 5. Standard deviation of the original and the fused images.
TABLE III. Evaluation of original and fused NIR band by different Methods
| UIQI | CC | Min | Max | Sd | |
| Original NIR | 1 | 1 | 195 | 811 | 87 |
| Fused NIR (ATW) | 0.99 | 0.98 | 125 | 867 | 88.5 |
| Fused NIR (HPF) | 0.94 | 0.99 | 152 | 650 | 68.1 |

