
Results and Discussion
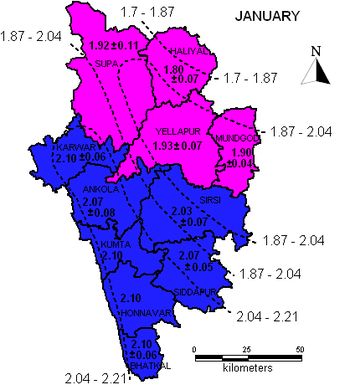
1. Wind profile of Uttara KannadaWind speed is seasonally dependent which is normally highest during the monsoon season. Wind speed varies from 1.9 m/s (6.84 km/hr) to 3.93 m/s (14.15 km/hr) throughout the year with minimum in October and maximum in June and July months. Annual average wind speed in the district ranges from 2.54 ± 0.04 m/s (9.144 ± 0.144 km/hr.) in Haliyal taluk to 2.70 ± 0.05 m/s (9.72 ± 0.18 km/hr.) in Karwar taluk. Fig. 3 gives the talukwise annual average wind speed of the district. Ample amount of electrical energy can be generated using wind through wind farms which could meet the major fraction of the current electricity demand of the district through decentralized generation.
2. Seasonal variation of wind speedThe speed of wind is quite uncertain and is dependent on ambient temperature and pressure, vegetation cover, elevation, and the topography of the site. Uttara Kannada has a mixed topography that constitutes the coastal belt, low and high elevation areas with forest cover, and also planes. From February to May, the district experiences summer with higher temperature along the coasts (Karwar, Honnavar, Kumta, Bhatkal and Ankola) and in planes (Mundgod and Haliyal), whereas, it experiences comparatively lower temperature in taluks of higher altitudes (Sirsi, Siddapur, Yellapur and Supa). Fig. 3 depicts the average annual wind speed in the district along contours. Wind speed varies from 2.5 m/s (9 km/s) to 3 m/s (10.8 km/s) throughout the district annually. The coastal regions (Karwar, Kumta, Ankola and Honnavar) experience higher wind speed ranging from 2.63 m/s to 2.79 m/s. Taluks at higher altitudes (Sirsi, Siddapur and Yellapur) witness comparatively lower wind speeds ranging from 2.55 m/s to 2.63 m/s and the planar regions (Haliyal and Mundgod) experienc lower wind speeds ranging from 2.47 m/s to 2.55 m/s.
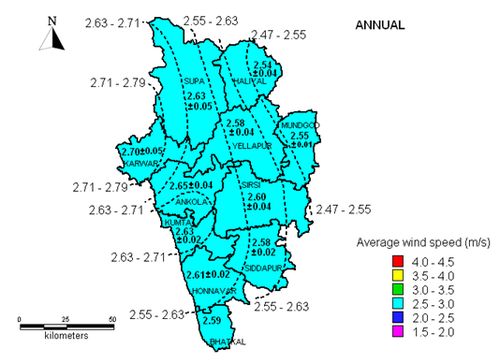
Fig. 3. Average annual wind speed of Uttara Kannada
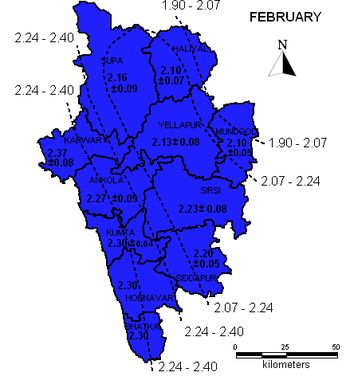
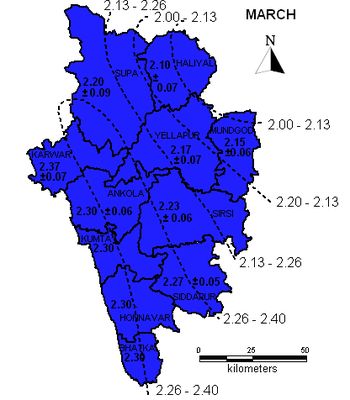
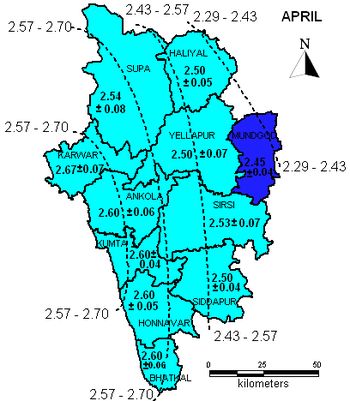
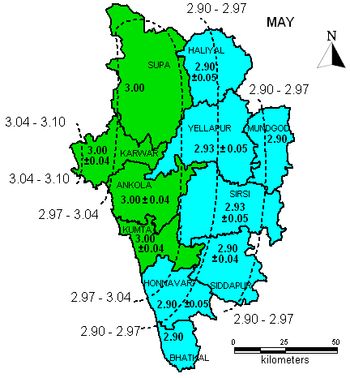
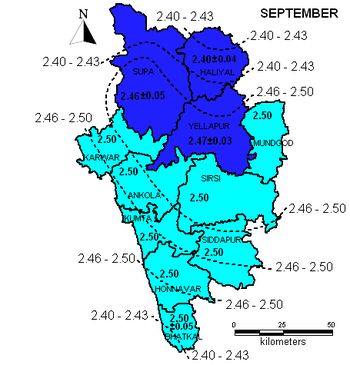
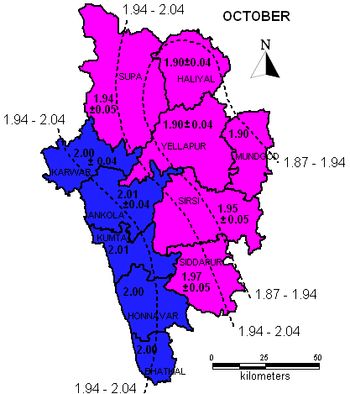
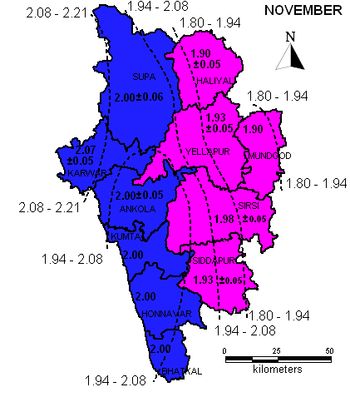
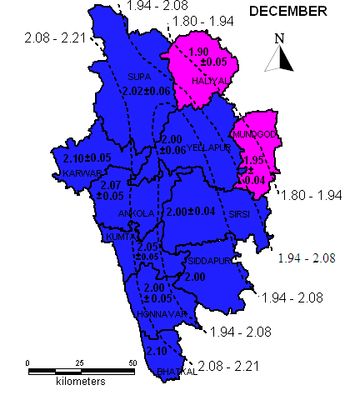
Fig. 4 to 6 provide the comparisons of mean wind speed variability in the district during summer (February to May), monsoon (June to September) and winter (October to January) seasons. In February and March, wind speed varies from 2 m/s to 2.5 m/s throughout the district. Since the climate changes from winter to summer, wind speed is less during the early days of summer, which increases during the end of March. In April, excluding Mundgod (2 m/s to 2.5 m/s), all other taluks experience higher wind speeds ranging from 2.5 m/s to 3 m/s annually. During monsoons, the district experiences higher wind speeds ranging from 3.5 m/s to 4 m/s which decreases as winter approaches.
Fig. 4. Wind speed variations during summer (February to May)
 |
 |
 |
 |
|
|
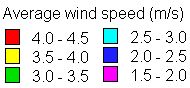
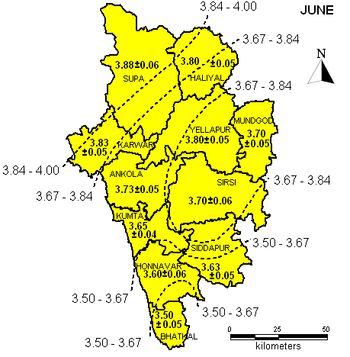
Fig. 5. Wind speed variations during monsoon (m/s)
 |
 |
 |
 |
|
|

Fig. 6. Wind speed variations during winter (m/s)
 |
 |
 |
 |
|
|

Highest annual average wind speed is experienced in June and July months (3.5 m/s to 4 m/s). In August, all the taluks experience wind speeds ranging from 3 m/s to 3.5 m/s excluding Supa and Karwar (where wind speed ranges from 3.5 m/s to 4 m/s). Northern part of the district witness lower wind speed of 2 to 2.5 m/s than the southern region (2.5 to 3 m/s).
The district experiences lower wind speeds during winter season which will be less than 2.5 m/s in all the taluks. Wind speed in the coastal taluks is more during October and November than in the planes and higher altitude regions. In December, except Mundgod and Haliyal (where wind speed ranges from 1.5 m/s - 2 m/s), all other taluks witness wind speeds ranging from 2 m/s to 2.5 m/s. In January, northern part of the district experiences lower wind speeds of 1.5 m/s to 2 m/s than the southern region (bearing wind speeds ranging from 2 m/s to 2.5 m/s).
2. Wind Energy Conversion System (WECS)
Wind Energy Conversion System (WECS) uses wind to convert mechanical energy into electrical energy. Main components of WECS are blades, gears, turbine, a generator and a pillar to mount all the equipment at the required height. Wind potential assessment is a prominent pre-installation procedure to assure perfect selection of a site to harness maximum energy. In order to explore the potential of wind technologies at an increased hub height, hourly surface wind speed measurements at IMD stations were estimated and represented in Fig. 7. In almost all the taluks, more than 45% of the wind speeds are above 2.5 m/s except for Honnavar (39.58%). Over 20% of the measured hours had wind speeds greater than 3.5 m/s in Karwar, Kumta and Supa, in which Karwar accounted for the highest (27.38%). These findings, along with relatively higher wind speeds (> 2 m/s in high elevation zone) observed in seasonal wind profiles (based on CRU data), foster the prospects of small and medium scale wind applications in Uttara Kannada which are technically achievable and economically viable [15]. Some of these are listed in Table 4. Wind pump for drawing water is an attractive small-scale wind technology for rural energy needs. The agriculture and horticulture intensive zones of Uttara Kannada could get benefited by wind pumps that function at lower wind speeds. The Vertical Axis Wind Turbine (VAWT) that can function at wind speeds as low as 1 m/s could be more effective during low wind speed seasons in the region [16]. Reduction in wind speeds and duration could be compensated by hybridizing wind with available alternative resources. Assessment of solar energy potential substantiates that the district receives a monthly average global insolation (incoming solar radiation) of greater than 5 kWh/m2/day [10]. Hence, wind–solar hybrid systems could be considered for an enduring energy supply in the region. Small-scale wind turbines can also be used in conjunction with biomass gasifier/diesel generators especially in remote areas although diesel is not a clean option [17]. Battery charging based on wind systems supplements the energy requirements during reduced wind speeds.
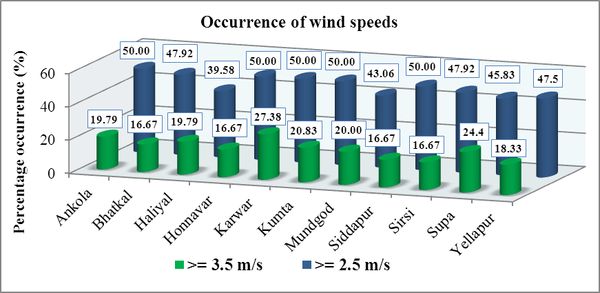
Fig. 7. Percentage occurrence of wind speeds
Table 4. Available small-scale wind turbines [15]
| Rated power, Prated (kW) | Rotor swept area (m2) | Sub-category |
| Prated < 1 kW | A < 4.9 m2 | Pico wind |
| 1 kW < Prated< 7 kW | A < 40 m2 | Micro wind |
| 7 kW < Prated< 50 kW | A < 200 m2 | Mini wind |
| 50 kW < Prated< 100 kW | A < 300 m2 | (Not defined) |
3. Techno-economic Feasibility
Power generated by the wind turbine is directly proportional to the variables’ wind speed and swept area. Maximum power obtained from any WECS is limited to 59.3% of the total kinetic power available in wind which is given by Betz constant (Cp). Power harnessed by WECS can be obtained using the expression given below;
Pavail = (1/2)* ρ*A*V3*Cp ................... (3)
where, Pavail – wind power, ρ – air mass density, A – swept area (area of wind flow), V – wind velocity and Cp – Betz constant (maximum = 59.3%), assumed as 0.4 (40%)
Analysis shows that wind power potential ranges from 42.69 kW to 341.52 kW in the district considering lower wind speeds in January and July respectively. However the annual wind power potential in the district varies from 1611.5 kW to 2091.9 kW for minimum and maximum wind speeds respectively (A=30 m2). By considering larger swept area, power generation can be increased although it requires more area for installation of turbines. Estimation shows that Micro and Mini WEC systems are feasible for the district since the decentralized generation is more reliable and efficient.
Cost of the wind turbines depend on their size because the transportation and installation difficulties increase with the size. Cost per kilowatt of a typical wind turbine ranges from USD 1,050 to 1,350 in India [18]. As the capacity increases, cost/kW decreases but the size of the turbine and blade length increases. Table 5 gives the cost estimation of the WECS system.
Table 5. Cost estimation of WECS
| Particulars | Capacity of the turbine | |
| 1.5 kW | 10 kW | |
| Manufacturing cost | 1950 | 13000 |
| Battery bank | 237 | 1422 |
| Civil work and installation | 105 | 702 |
| Inverter | 79 | 527 |
| Maintenance charge & other costs | 263 | 1756 |
| Total cost | 2634 | 17407 |
| Annual energy generated (kWh) | 3500 | 30000 |
| Unit cost of electricity (USD/kWh) | 0.75 | 0.58 |
Table 6. Wind power potential estimation
| Month | Wind speed (m/s) | Power harnessed at A= 30 m2 (kW) | Power harnessed at A= 160 m2 (kW) | |||
| Min | Max | Min | Max | Min | Max | |
| Jan | 1.80 | 2.10 | 42.69 | 67.79 | 228.61 | 363.03 |
| Feb | 2.10 | 2.37 | 67.79 | 97.44 | 363.03 | 521.83 |
| March | 2.10 | 2.37 | 67.79 | 97.44 | 363.03 | 521.83 |
| April | 2.45 | 2.67 | 107.65 | 139.33 | 576.48 | 746.14 |
| May | 2.90 | 3.00 | 178.53 | 197.64 | 956.05 | 1058.40 |
| June | 3.50 | 3.88 | 313.85 | 427.57 | 1680.7 | 2289.71 |
| July | 3.60 | 3.93 | 341.52 | 444.31 | 1828.9 | 2379.38 |
| Aug | 3.20 | 3.50 | 239.86 | 313.85 | 1284.5 | 1680.70 |
| Sept | 2.40 | 2.50 | 101.19 | 114.38 | 541.90 | 612.50 |
| Oct | 1.90 | 2.01 | 50.21 | 59.44 | 268.87 | 318.33 |
| Nov | 1.90 | 2.07 | 50.21 | 64.93 | 268.87 | 347.69 |
| Dec | 1.90 | 2.10 | 50.21 | 67.79 | 268.87 | 363.03 |
| Total | 1611.5 | 2091.9 | 8629.8 | 11202.58 | ||
A typical 1 kW turbine can generate electrical energy of 1,000- 3,000 kWh per annum depending on the power density of wind [19]. About 70% of the total system’s cost is only for wind turbine followed by 9% for battery and 4% for civil work [20,21]. Unit cost of electricity generated from WECS varies from USD 0.5 per kWh to USD 0.75 per kWh. However, with technology improvements and optimizing the system, lower generation cost can be achieved.
4. Decentralized wind energy option for the district
Uttara Kannada has a mixed topography which includes coastal areas (Kumta, Ankola, Karwar, Honnavar, Bhatkal taluks), high elevated regions or Sahyadri (Western Ghat region), and planes in the eastern part (Haliyal and Mundgod taluks). Coastal taluks and hilly areas (Sirsi, Siddapur, Yellapur and Supa) experience higher wind speed compared to plane regions. From Fig. 7, it is evident that in coastal taluks, occurrence of wind speed ≥3.5 m/s (and/or ≥2.5 m/s) is higher than other taluks in the district. Installation of WECS near the coastal belt of the district would be optimum because it has the highest potential. Since the wind turbines need a larger disturbance free area, the coastal belt from Karwar to Bhatkal is best suited for its installation. This also adds attraction to the natural scenic beauty of the region. Also, with improvement in technology and optimizing the system, a lower generation cost can be achieved.
Regions at higher altitude in the district (Sahyadri) experience high wind speeds particularly in monsoon, which can compensate for the lower solar insolation. Since these regions lie in Western Ghats which shelters various flora and fauna, site selection for wind energy systems must be done without any ecological disturbance. Micro and pico level installation or hybridizing wind resource with solar and biomass is a technically feasible and economically viable option in this region. Planes also have enough potential for wind power which could meet the local energy demand particularly through wind pumps and mills. Wind pumps can reform irrigation practices by reducing the electricity bills.
Fig. 8 compares the month wise availability of wind and solar resources in the district. It represents that during monsoon (June to September), lower insolation availability could be compensated by higher wind speed, thus promising reliable generation. A hybrid system consisting of wind and solar resources, and also having biomass gasifier with generator meet the local electricity demand reliably and efficiently without polluting the environment.
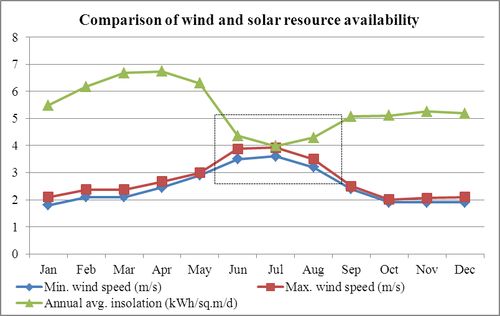
Fig. 8. Comparison of solar and wind energy potentials