
Study area, Data and Method
Study area
Uttara Kannada is the fourth largest district of Karnataka state, located between 13° 55' and 15° 31' N and 74° 9' and 75° 10' E. Total population of the district is 14,36,847, and more than 70% of the people live either in rural areas or in semi urban areas. The district is located in the Western Ghat ranges amongst abundant flora and fauna. More than 75% of the total area is covered by forest and it lies along 140 km of costal belt [9]. Fig. 1 illustrates the topographic undulations of the region. Topographically, the district lies in three distinct zones namely narrow and flat coastal zone, abruptly rising ridge zone, and elevated flattened eastern zone. The coastal zone is thickly populated with coconut plantations. Ridge zone is a part of the main range of Western Ghats, which runs north to south, parallel to the coast. The flat eastern zone joins the Deccan plateau. The taluks which comprises the narrow flat coastal zone are: Karwar, Ankola, Kumta, Honnavar and Bhatkal. Similarly, taluks which comprises the ridge zone are: Supa, Haliyal, Yellapur, western Sirsi, and western Siddapur. Flatter eastern zone includes Mundgod, Haliyal, eastern Sirsi and eastern Siddapur. Four agro-climatic zones based on geography and climate are coastal, evergreen, dry deciduous and moist deciduous. There are 1,291 villages, 7 towns, 5 city municipal corporations/town municipal corporations/outward growth/census towns and 2 reservoirs in the district [http://uttarakannada.nic.in/].
Uttara Kannada has a mixed topography where the elevation ranges from sea level to 1300 m above mean sea level. Since the wind velocity is dependent on elevation, wind speed is found more in coastal and elevated taluks than on planes. Fig. 1 shows the variation of elevation in the district.
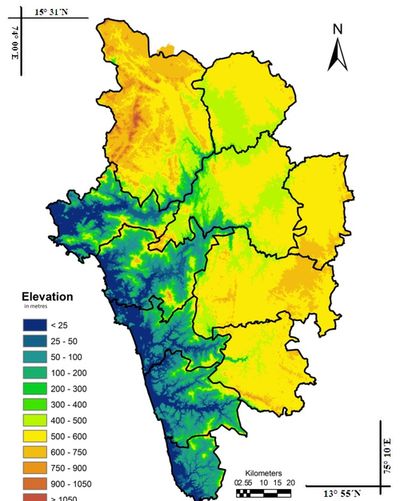
Fig. 1. Digital Elevation Model of Uttara Kannada, Karnataka.
Data and Method
1. Synthesized wind data :
Synthesized wind data available from various sources provide preliminary understanding of the wind regime of a region. Depending on the physiographical features and climatic conditions, these data help to assess wind potential in the region of interest validated by long term surface wind measurements.
There are various wind speed datasets available of different time periods from sources such as National Aeronautical and Space Agency (NASA), Surface Meteorology and Solar Energy (SSE), National Oceanic and Atmospheric Administration (NOAA-CIRES), and Climate Research Unit (CRU). However, previous studies clearly show that CRU data are reliable and closer to the Indian Meteorological Department (IMD) surface data, and hence, it has been used in the present study [10]. CRU at the University of East Anglia maintains a record of climatic average datasets of meteorological variables which contains wind speed data for the period between 1961 and 1990, compiled from different sources. Further, inter and intra variable consistency checks are performed to minimize data consolidation errors. The Global Land One-km Base Elevation project (GLOBE) data of the National Geophysical Data Center (NGDC) were re-sampled into 10'×10' (ten minute spatial resolution) elevation grids where every cell with more than 25% land surface represents the average elevation of 100~400 GLOBE elevation points. Those below 25% are considered water bodies. The climatic average of wind speeds measured at 2 to 20 m anemometer heights (assumed to be standardized during collection) collated from 3,950 global meteorological stations together with the information on latitude, longitude and elevation were interpolated based on a geo-statistical technique called thin plate smoothing splines. Elevation as a co-predictor considers topographic influence on the wind speed, whereas, proximity of a region to the measuring station improves the reliability of the interpolated data. During interpolation, inconsistent data were removed appropriately. This technique was identified to be steadfast in situations of data sparseness or irregularity [11]. The 10'×10' spatial resolution wind speed data as climatic averages were available for all global regions (excluding Antarctica) [12].
Data from IMD stations located in the district were also acquired for respective locations to compare with CRU dataset. There are 4 IMD stations in the districts which are listed in Table 2. Cup counter anemometers with hemispherical cups measuring 7.62 cm in diameter had been used in Indian Meteorological Department (IMD) observatories until 1973. During 1973-1979 these anemometers were replaced by 3 cup anemometers with 127 mm diameter conical cups, which were placed at l0 m above ground over open terrain in conformity with international practice.
Table 2. IMD stations in Uttara Kannada
| Location | Latitude | Longitude | Elevation (m above mean Sea level) |
| Karwar | 14° 47' | 74° 08' | 4 |
| Kumta | 14° 26' | 74° 25' | 8 |
| Honnavar | 14° 17' | 74° 27' | 26 |
| Shirali | 14° 05' | 74° 32 ' | 45 |
| Sirsi | 14° 62' | 74° 85' | 610 |
Data from the meteorological observatories at Karwar (for the period 1952-1989), Honnavar (for the period 1939-1989) and Shirali (for the period 1974-1989) were obtained from the Indian Meteorological Department, Government of India, Pune. Daily wind data for the period 1990-2012 were obtained from the Indian Meteorology Department of Bangalore for these observatories. The primary data was also obtained by installing a cup counter anemometer with mechanical counter fixed on 5 m tall guyed masts at Sirsi and Kumta. The anemometer readings were noted down every three hours during the day and mean wind speeds were obtained from those observations.
Anemometers at different meteorological stations are set at different height levels. The wind speed recorded at each station has to be calibrated to a constant height prior to analysis. The standard height according to the World Meteorological Organization is 10 m above the ground level which has thus been used for the analysis [13]. The horizontal component of the wind velocity varies a great deal with height under the influence of frictional and impact forces on the ground. The most common model for the variation of horizontal velocity with height is given by the logarithmic wind profile equation 2 [14],
(V1/V2) = (H1/H2) α ............. (2)
where V1 is a wind speed at height H1 i.e., 10 m above ground level, V2 is a wind speed at height H2 above ground level, and α is the roughness factor which is determined by substituting the wind speed data obtained with anemometer height in various wind directions, and it has been obtained as 0.30. Table 3 gives the month wise average wind speed in the respective locations. Fig. 2 gives the comparison of mean wind speeds in five IMD stations.
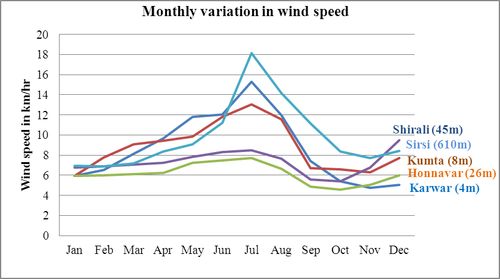
Fig. 2. Monthly variation in wind speed
Table 3. Monthly variation in mean wind speed (km/hr) [3]
| Month | Karwar | Kumta | Honnavar | Shirali | Sirsi |
| Jan | 5.96 | 5.95 | 5.95 | 6.78 | 6.92 |
| Feb | 6.55 | 7.76 | 6.00 | 6.87 | 6.88 |
| March | 8.15 | 9.09 | 6.10 | 7.03 | 7.20 |
| April | 9.65 | 9.42 | 6.20 | 7.25 | 8.38 |
| May | 11.82 | 9.87 | 7.21 | 7.84 | 9.09 |
| June | 12.01 | 11.83 | 7.50 | 8.30 | 11.19 |
| July | 15.27 | 13.03 | 7.72 | 8.50 | 18.17 |
| Aug | 11.98 | 11.54 | 6.66 | 7.64 | 14.19 |
| Sept | 7.44 | 6.71 | 4.87 | 5.56 | 11.14 |
| Oct | 5.41 | 6.59 | 4.55 | 5.42 | 8.39 |
| Nov | 4.75 | 6.29 | 5.04 | 6.76 | 7.72 |
| Dec | 5.04 | 7.73 | 6.00 | 9.51 | 8.42 |
At higher elevations and in coastal region, mean wind speed is comparatively higher than in the other parts of the district. Wind speed recorded at Honnavar and Shirali stations, which are located at an elevation of 26 m and 45 m respectively, are lower.