|
RESULTS AND DISCUSSION
1. Survey of illegal dumping of waste
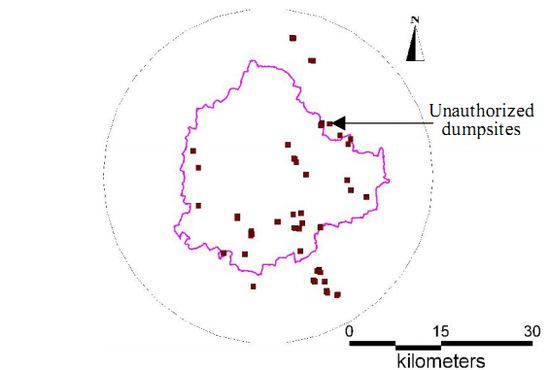
A total 62 open dumpsites were surveyed near the major water bodies of the city. These locations was spatially distributed in all the four zones i.e. NE (North-East), SE (South-East), SW (South-West) and NW (North-West) of the city. There were 21, 28, 11 and 2 dumpsite locations which were located in NE, SE, SW and NW, respectively (Fig 2).

Fig 2: Bangalore with unauthorized dumpsites
These sites were classified into seven categories based on their predominant composition of waste. These categories were identified as plastic, organic, construction debris, indeterminate (mixed up fresh wastes making segregation difficult), old (older waste where organic waste components are already degraded), and other (non-household wastes from industry, hospital, etc.). These predominant categories are based on the percentage of waste volume at the dumpsites. At 47% of the locations, construction debris was predominant in the wastes, as many construction activities were happening in near by areas. Organic waste, plastic waste and rejects from recycling units were located at 26%, 24% and 3% of open dumpsites. These locations were spread in 2.6 ha of land area and the average dump height was 0.6 m.
Wastes are also dumped in drainage network. A total of 95 locations of drainage channels were observed during the rainy season of year 2011. Among these locations, 37 were slow flowing, 47 had a moderate flow and only 9 locations had a rapid flow. Presence of solid waste in drainage channels is very common in all slow to fast flowing drainage channels; almost 95% of the locations had the presence of solid waste. Generally, a large number of locations had plastics and cloths that clogged the flow path or the channels under the various bridges. However, at few places styrofoam, building debris and organic wastes along with plastic and cloth were also observed to choke the flow path [8].
2. Water qualities of water bodies and ground water
A number of studies show that most of Bangalore’s lakes are polluted [2, 20, 22, 23, 24]. Dumping of solid waste in the lake bed and in catchment has contributed to the contamination of water bodies. Disposal practices of direct discharge of sewage and waste water into water bodies are major reasons for contamination of surface water in the Bangalore. In anthropogenically modified, weed-infested streams from upper reaches, deoxygenated water (DO = 0-0.3 ppm) arrives for most part of the day, due to high flow rates of water through extensive weed mats. The influx of hypoxic, nutrient rich wastewaters during the day is more stressful to aquatic biota as fish and invertebrates that undergo higher metabolic rates during the day require a higher DO than in the night.
A physico-chemical and biological analysis of sewage-fed Varthur lake in Bangalore highlight of prevailing anaerobic conditions (0mg/L) at the inlet. The profuse growth of floating macrophytes were observed in summer and winter seasons. Alkalinity, TDS, conductivity and hardness values were higher when compared to earlier studies. Enrichment of nutrients in sampled lakes has contributed to eutrophic status. The entry of untreated industrial pollutants in Bangalore’s lakes have been documented [20, 25, 26, 27]. Ammoniacal N was reported in urban lakes such as the Hosur lake (16-30mg/l), Varthur lake (>3mg/l) and Bellandur lake (31mg/l) [22, 28, 29].
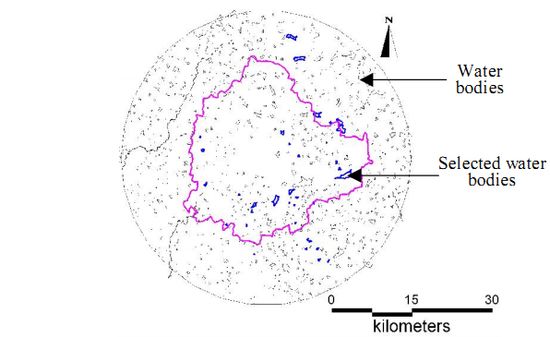
Ammoniacal nitrogen is often found in sewage, waste water and leachate generated from solid waste unscientific disposal. Ammoniacal N gets converted to ammonium ions and ammonium ions are nitrified and are converted into nitrate. Nitrates are extremely soluble in water and high level can build up over time and cause health hazards. Nitrate has ability to directly oxidize hemoglobin changing it to methemoglobin, which can not bind oxygen and cause methemoglobinemia. Sometime it also dedevelops stomach and intestine cancers. Its continuous accumulation in lake also enriches with nutrient, stimulate blooms of algae and cause eutrophication of lake. Nitrate level is measured in six lakes and given in Table 1, which shows that at outlet of most of these lake’s nitrate concentration ranges from 5 to 7.4mg/l.
TABLE I: Water bodies nitrate content and nearby located number of unauthorized dumpsites
| Water body |
Number of dumpsite locations |
Nitrate content (mg/l) |
Reference |
| Gaudankere |
1 |
6.71 |
[21] |
| Herohalli |
1 |
6.35 |
[21] |
| Madivala |
2 |
I=15.83, O=5.06; I=0.62, O=0.62 |
[20,21] |
| Varthur |
1 |
I=8.02, O=7.43; I=1.74, O1=1.57, O2=1.7 |
[20,21] |
| Veerasandra |
2 |
6.29 |
[21] |
| Yellamallappachetty |
2 |
I=6.43, O=5.78; I=2.57, O=0.39 |
[20,21] |

Fig 3: Bangalore with selected water bodies
3. Linkages between surface water bodies and ground water resources
Temporal analyses indicate the decline of 34.48% during 1973-1992, 56.90% during 1973-2002 and 70.69% during 1973-2007 in the erstwhile Bangalore city limits. Similar analyses done for Greater Bangalore (i.e. Bangalore city with surrounding 8 municipalities) indicate the decline of 32.47% during 1973-1992, 53.76% during 1973-2002 and 60.83% during 1973-2007. This is correlated with the increase in built-up area from the concentrated growth model focusing on Bangalore, adopted by the state machinery, affecting severely open spaces and in particular water bodies. Some of the lakes have been restored by the city corporation and the concerned authorities in recent times. These lakes have a well defined boundary, clean water and are maintained by the neighbourhood people. These lakes are used for recreational purposes. They are home to migratory birds and also add aesthetic beauty to the surroundings. Disappearance of water bodies and a sharp decline in the number of water bodies in Bangalore is mainly due to intense urbanization and urban sprawl. Many lakes were encroached for illegal buildings (54%). Field surveys (during July-August 2007) show that nearly 66% of lakes are sewage fed, 14% surrounded by slums and 72% showed loss of catchment area. Also, lake catchments were used as dumping yards for either municipal solid waste or building debris. The areas surrounding these lakes have illegal constructions of buildings and most of the time slum dwellers occupy the adjoining areas [6].
Assessment of groundwater table highlights the decline of groundwater table to 200-250m with the removal of lakes as against 30-40m before removal of water bodies. Some localities with intense urbanisation the groundwater table has dipped to 300-400m. This highlights the linkage of groundwater sources with surface water bodies.
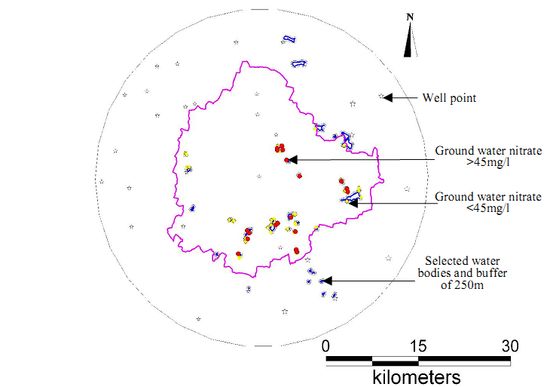
Groundwater quality in the vicinity of water bodies and solid waste open dump were assessed by considering the wells in the buffer of 250m of water body/open dump. Higher nitrate levels in the immediate vicinity of contaminated water bodies and open dumps corroborate the ground water quality linkage with other natural resources (soil and surface water bodies). The ground water quality in the catchment of nineteen sites closer to unauthorized dumpsites are more than the desirable limit (<45mg/l) as shown in Fig 4.

Fig. 4: Ground water nitrate concentration range [21], well points and selected water bodies near to illegal dumpsites
The nitrate content in Bangalore’s groundwater was varying from less than 1mg/l to 554mg/l with an average of 38.34mg/l [21]. Also nitrate level in ground water is more than the contaminated surface water bodies due to longer residential time (ammonia available in surface water converted into nitrate) and sustained inflow of sewage concentrates nitrate levels in ground water. This highlights the need for immediate interventions in solid and liquid waste treatment to prevent further contamination of ground water.
|


