 |
HYBRID BAYESIAN CLASSIFIER FOR IMPROVED CLASSIFICATION ACCURACY |
Uttam Kumar | S. Kumar Raja | C. Mukhopadhyay | T. V. Ramachandra* |
| Citation: Uttam Kumar, S. Kumar Raja, C. Mukhopadhyay and T. V. Ramachandra , 2011, Hybrid Bayesian Classifier for Improved Classification Accuracy. IEEE Geoscience and Remote Sensing letters, Vol. 8, No. 3, pp. 473 – 476. | |||
|
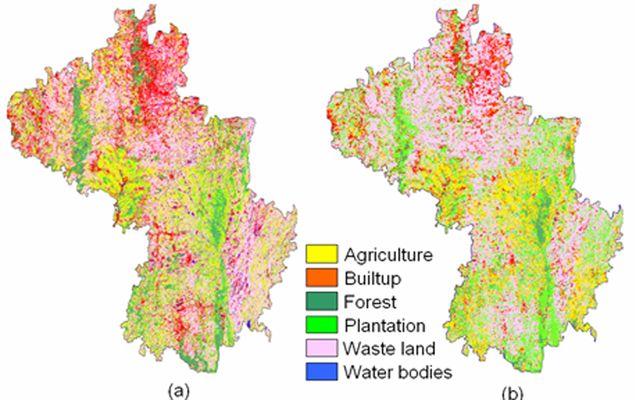
EXPERIMENTAL RESULTS Two separate experiments were carried out. In the first case, LISS-III MS data (3 bands of 23.5m x 23.5m spatial resolution resampled to 25m, acquired on December 25, 2002) of 5320 x 5460 size and MODIS 8-day composite data (7 bands of 250m x 250m, acquired from 19-26 December, 2002) of 532 x 546 dimension were co-registered with known ground control points (RMSE - 0.11). Training data were collected from the ground representing approximately 10% of the study area covering the entire spectral gradient of the classes. Separate test data were collected for validation. LISS-III MS classified image using conventional Bayesian classifier is shown in Fig. 2 (a). Assuming that there are six (fixed) number of representative endmembers (pure pixels), the entire image was modeled in terms of those spectral components, extracted using N-FINDR algorithm [14] from MODIS images. In the absence of pure pixels, alternative algorithms [15] can be used for endmember extraction, which is a limitation of N-FINDR. It may be noted that some objects (for example buildings with concrete roofs, tiled roofs, asphalt, etc.) exhibit high degrees of spectral heterogeneity representing variable endmembers. This intra-class spectral variation with variable endmembers can be addressed through techniques discussed in [16-18], and is beyond the scope of the current study. Abundance values were estimated for each pixel through unmixing and used as prior probabilities in HBC to classify LISS-III MS data (Fig.s 2 (b)). Table I is the class statistics and Table II indicates the producer’s and user’s accuracies. The overall accuracy and Kappa for HBC (93.54%, 0.91) is higher than Bayesian classifier (87.55%, 0.85). For any particular class, if the reference data has more pixels with correct label, the producer’s accuracy is higher and if the pixels with the incorrect label in classification result is less, its user’s accuracy is higher [5]. Bayesian classifier wrongly classified many pixels belonging to waste / barren / fallow as builtup. Forest class was over-estimated and plantation was under-estimated by Bayesian classifier. The only minority class in the study area is water bodies. Classified image using conventional Bayesian classifier had 1.08% (8854 ha) of water bodies in the study area. After the ground visit, we found that there are not many water bodies and the extents of most individuals were < 2000m2. Therefore, only a few water bodies that had spatial extent ≥ 62500 m2 could be used as endmembers. The minimum detected water class was 5% using unmixing of LS-HSR data. It may have happened that the prior probability was unlikely for this class while classifying the LISS-III MS data using HBC. The classified image obtained from HBC showed 0.81% (66.20 ha) of water bodies. A few pixels were wrongly classified using HBC, therefore, the producer’s accuracy decreased from 90.91 (in conventional Bayesian classifier) to 88.18% (in HBC). However, given the same set of training pixels for classification, the user’s accuracy has increased from 88.89 to 97%. Producer’s accuracy increased for agriculture (2.6%), builtup (4.3%), forest (7%), plantation (11.5%) and waste land (10.6%) and user’s accuracy increased for agriculture (8%),
Table I :
Class statistics from Bayesian and HBC for LISS-III Data
Table II : Accuracy Assessment for LISS-III data
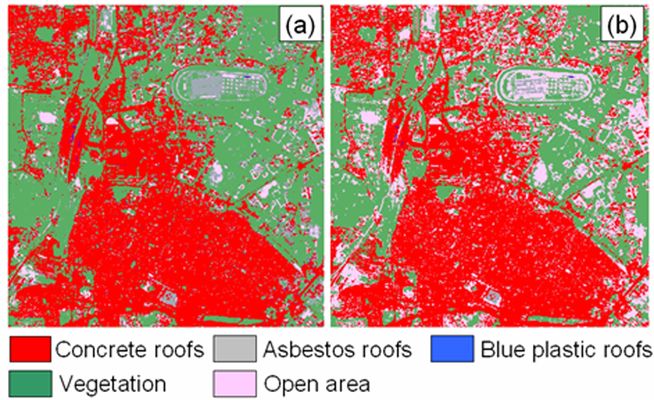
builtup (16.6%), forest (7.6%) and water bodies (8%) in HBC output. On the other hand, producer’s accuracy decreased (2.7%) for water bodies and user’s accuracy decreased (~0.7%) for plantation and waste land classes in agreement with the similar observations reported in [5]. HBC was intended to improve classification accuracies by correctly classifying pixels which were likely to be misclassified by Bayesian classifier. Therefore a cross comparison of the two classified images located the pixels that were assigned different class labels at the same location. These wrongly classified pixels when validated with ground data revealed a 6% (~1742832 pixels) improvement in classification by HBC. In the second experiment, IKONOS MS data (4 bands of 4m, acquired on November 24, 2004) of 700 x 700 size and Landsat ETM+ data (6 bands excluding Thermal and Panchromatic, of 30m, acquired on November 22, 2004) of 100 x 100 dimension were co-registered (RMSE - 0.09). Landsat pixels were resampled to 28m so that 49 IKONOS pixels would fit in 1 Landsat pixel. The scenes correspond to Bangalore city, India near the central business district having race course, bus stand, railway lines, parks, builtup with concrete roofs, asbestos roof, blue plastic roofs, coal tarred roads with flyovers and a few open areas (play ground, walk ways, vacant land, etc.). Class proportions from Landsat image pixels were used as prior probabilities to classify the IKONOS MS images using HBC (Fig. 3 (b)). The overall accuracy and Kappa for HBC (89.53%, 0.87) is higher than Bayesian classifier (80.46%, 0.69). Producer’s accuracy increased by 17% for concrete, asbestos, blue plastic roof and open area and decreased by 7% for vegetation in HBC (Table IV). User’s accuracy increased by ~5.5% for all the classes in HBC. Bayesian classifier wrongly classified and overestimated many pixels belonging to open area as asbestos roof (Table III). Vegetation was overestimated by 9% using Bayesian classifier and open area was underestimated by ~15%. A cross comparison of the two classified images showed that 95733 pixels (0.33% of the study area) were differently classified by the two classifiers. Validation of these pixels showed an improvement of 9% by HBC, higher than accuracies reported in [6, 7 and 8].
Table III: Class statistics FOR IKONOS data
Table IV : Accuracy Assessment for IKONOS data
|
||||||||||||||||||||||||||||||||||||||||||||||||||||||||||||||||||||||||||||||||||||||||||||||||||||||||||||||||||||||||||||||||||||||||||||||||||||||||||||||||||||||||||||||||||||||||||||||||||||||||||||||||||||||||||||||
*T. V. Ramachandra, Senior Member, IEEE, is with the Centre for Ecological Sciences, Centre for Sustainable Technologies and Centre for Infrastructure, Sustainable Transport and Urban Planning, Indian Institute of Science (IISc), Bangalore, India. Uttam Kumar, Student Member, IEEE, is with the Department of Management Studies and Centre for Sustainable Technologies, Indian Institute of Science, India. (e-mail: uttam@ces.iisc.ac.in). Chiranjit Mukhopadhyay is with the Department of Management Studies, Indian Institute of Science, Bangalore, India (e-mail: cm@mgmt.iisc.ac.in). S. Kumar Raja is with the VISTA Group, IRISA, Rennes, France and Thomson R&D France, SNC Cesson - Sévigné, France (email: s.kumar.raja@yahoo.com). |