
Results and Discussion
Bioenergy resources from various sources (forests, agriculture, and horticulture) are used for domestic applications (cooking, water heating) in the district. Fuel wood is mainly used for domestic cooking and water heating supplemented by horticultural and agricultural residues, forest biomass and biogas production from livestock. Majority of the fuel requirement for cooking, water and space heating is supplied by agricultural residues, animal matter or by forest in the district. More than 80% of the people are dependent on bio energy for their requirements such as food, fuel wood for traditional stoves, timber for houses and cattle sheds, poles for fencing and shelter construction, leaves to prepare manure and covering to control weed, wood to prepare all housing structures, ropes, herbal medicines and decorative articles. Study gives the village level details of supply and demand trend of bio energy in the district.
Supply and Demand trends of Bio energy in Uttara Kannada
Fuel wood:
Fuel wood is one of the prominent forest by-products collected (normally by women and children) which is used for cooking and water heating through burning. Major domestic energy need is shared by fuel wood in the rural regions where the people collect it from nearby forest. The availability of the fuel wood for the consumers is depends on the closeness of the forest, type of the forest and methods of extraction. FIG. IV gives the availability of fuel wood in the districts annually. Since fuel wood is the cheapest primary energy source hence the demand will be high depending upon the availability.
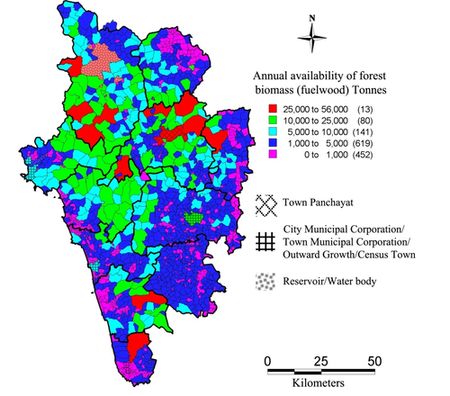
FIG IV: AVAILABILITY OF FOREST BIOMASS (FUEL WOOD) IN TONNES/ANNUM
If the demand for the fuel wood increases then it may lead to deforestation or consumers may switch over to other fuels such as LPG, electricity or kerosene due to the lack of availability. The annual fuel wood availability in the district ranges from less than 1,000 tonnes to 56,000 tonnes. In majority of the villages of Sirsi, Siddapur, Kumta and Honnavar taluks, availability of fuel wood ranges from 1,000 to 5,000 tonnes per annum. In northern villages of Haliyal and Supa taluks annual availability of forest biomass is less than 1,000 tonnes to 5,000 tonnes. Availability of fuel wood is high in the central region of the district due to the evergreen forest cover. In eastern part of Karwar and Ankola and southern part of Supa fuel wood availability is 10,000 to 25,000 tonnes per annum. There are few villages Supa and Yellapur Taluks where the bio-mass availability is 25,000 to 56,000 tonnes in a year.
FIG. V gives the supply to demand ratio of available forest biomass (fuel wood) in the district. The supply/demand ratio in the district ranges from less than 0.5 to more the 2. If the ratio is less than 1 (supply < demand) then that place is fuel wood deficit place and whereas the ratio is more than 1 (supply > demand) then that place is fuel wood surplus region. In Uttara Kannada, most of the taluks with evergreen forest cover (Sirsi, Siddapur, Yellapur, Supa and estern hilly areas of Kumta, Honnavar and Ankola) are fuel wood surplus regions where the supply/demand ratio is more than 2. The villages with semi and moist deciduous forests (western parts of Mundgod and Haliyal, eastern parts of Bhatkal and Karwar) are also forest biomass surplus places where the availability ratio is more than 1. The coastal and the extreme eastern part of the district (coastal villages of Karwar, Ankola, Kumta, Honnavar and Bhatkal with eastern part of Mundgod and Haliyal) are the fuel wood deficit places. The bioenergy resource is dwindling in the district evident from the reduced biomass supply to demand ratio from 8-9 to 2. This necessitates sustainable management approaches with augmentation of forest resources.
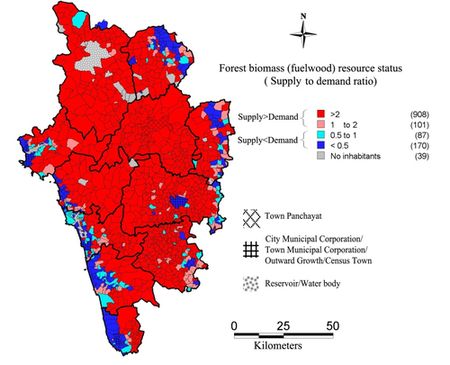
FIG. V: FUEL WOOD RESOURCE STATUS (SUPPLY TO DEMAND RATIO)
Bio-energy from Agricultural residues
Agricultural crops grown in the district include rice, ragi, jowar, bajra, maize and wheat. Paddy is the major crop in the district followed by jowar and maize. Net sown area in the district is about 1,12,946 ha which includes cereals, commercial crops and oilseeds.
-
Paddy residues: Paddy (Oryza sativa) is the widely grown crop in the district (78,073 ha, 69.12%). Rice husk and stalk are major constituents of the residue from paddy cultivation. The average higher calorific value of rice husk ranges from 2937.5 to 3461.31 kcals and lower value is from 2637.2 9 to 3161.2 5 kcals. The stalk is mainly used as fodder and husk is the main energy component in the residue.
-
Bagasse: Sugarcane is an important cash crop in the district and is mainly used to prepare jaggery. Area under sugarcane is about 1,232 ha (1.09% of total sown area). Bagasse is a major residue from sugarcane which is left after extracting juice from it. The fibrous content in the sugarcane is the major contributor to the bagasse and is normally in the range of 30-32%. Bagasse is used as a fuel with wood in the process of producing jaggery from sugarcane juice which has a calorific value of 3,500 kcals. Bagasse is also used to generate methane gas; 1 tonne of bagasse generates about 20 m3 of combustible methane gas.
-
Maize residues: Maize is one of the prominent crops in the district with a share of 3.68% of net sown area. Maize cobs are major residues from the crop which constitute about 30% of maize gain (Zea mays). Cobs are used to feed cattle or as fuel.
-
Oil seed: Ground nut is the most important and widely grown oil seed crop in the district followed by cotton. Ground nut is grown in 2,949 ha (2.61%) where the total oil seed growing area is 3,177 ha (2.81%). Sun flower is the other oil seed crop which is grown in the district (228 ha). About 1,878 ha (1.66% of net sown area) of area is under cotton which produces oil seeds. About 30% of the ground nut pod consists of shell which is used as residue has an average higher calorific value of about 4,532.15 kcal/kg and the lower calorific value of about 4,248.5 8 kcal/kg.
FIG. VI gives the annual energy available from agricultural residues in the district, which ranges from 250 GWh to 90,000 GWh per year. In majority of the villages (895 villages) of Yellapur, Supa, Siddapur, Sirsi and Kumta taluks energy availability from agricultural residues is less than 250 GWh per year. Some villages in Ankola, Sirsi, Siddapur and Haliyal taluks get the annual energy from agricultural residues about 250 to 500 GWh. Similarly, several villages in Karwar, Ankola and Haliyal taluks have annual energy from agriculture residues of 500 to 2,000 GWh. In very few villages in the district (Mundgod taluk), energy from agricultural residues is more than 10,000 GWh per year and the maximum availability is about 90,000 GWh per annum.
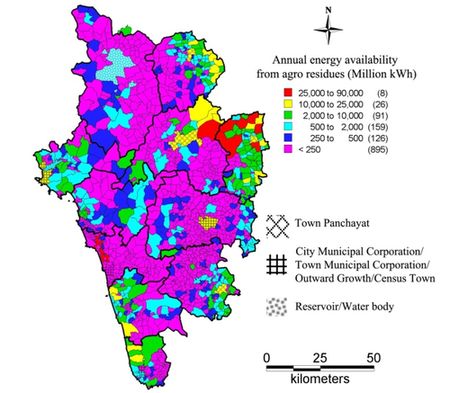
FIG. VI: ENERGY FROM AGRICULTURAL RESIDUES
Bio energy from Horticulture residues
Plantation crops (cash crops) such as areca (Areca catechu), coconut (Cocos nucifera), cashew (Anacardium occidentale), banana (Musa accuminata), cardamom (Elletaria cardamomum), cocoa (Theobroma cacao), pepper and spices are the major crops (32,953 ha, 29%) next to paddy in the district. There is an increasing trend in growing these crops in the district due to their commercial value. Coastal belt takes the major share in growing coconut crop and areca is grown in almost all the taluks. Area under areca crop is increasing with a higher rate in recent years which has become the crop of major income in Kumta, Honnavar, Ankola, Sirsi, Siddapur and part of Yellapur taluks. Cashew is a seasonal bearing plant which is normally grown in hilly or in waste land in the district. Cardamom, cocoa tree and spices are grown with areca and coconut plantations (1,675 ha) in the district which have higher trade value in the market. Horticulture crops are also the important source of residues which mainly contains combustible biomass.
-
Areca residues: Areca is the most growing crop after paddy in the district. Fuel biomass extracted from areca is leaves, inflorescence, and husk and leaf sheath. Areca husk is the outer cover of areca fruit which accounts for 60-80% of the total volume (fresh weight consideration). It is normally used to cover the field or as mulch rather than used as fuel. It can be used in the manufacture of card boards, paper boards etc and properly composted husk can be good organic manure. On average 5-6 leaves can be obtained from each areca tree per year. It is used to prepare manure, to cover edges of cannels agricultural land, as fuel biomass and to feed cattle. Use and throw (single use) plates and cups, hats and other decorative items manufactured from sheaths are getting attention of people in the district and state wide.
Areca leaves are used as thatching materials and to cover areca gardens. These are the good source of manure and also combustible biomass. Other residues such as inflorescence and trunk of the tree are used as fuel. Trunk is mainly used for construction and when it dries and become strength less and it will be used as fuel.
-
Coconut residues: Coconut residues are mainly used for combustion (fuel biomass) which consists of leaves, inflorescence, shells, husk and leaf sheath. Coconut husk is widely used for making coir, mats, rope and also used to cover coconut plantations. It is dried and used as main fuel for water heating during rainy season in the district. Shells are mainly used as fuel which has higher combustion value. Coconut shell charcoal production is gaining importance since it has a good demand in market. Leaves of coconut palms are used to cover houses and other plantation fields. Leaves are used to produce groom sticks which can be trade in the market.
-
Other residues: Other residues generated from horticulture crops are due to cashew cocoa and banana plantation. Cashew is one of widely grown cash crop in Uttara Kannada. Cashew shell husk is the major residue from the crop followed by the fuel wood from tree branches. Cocoa tree is sparsely grown in the district from which fuel wood and leaves are extracted as residues. Main Residue of banana plantation is leaves which are used instead of plates for serving the food and in cooking; also leaves are used to cover the plantation. However the banana tree will not produce any combustible residues.
FIG. VII gives the annual bi-energy availability from horticultural residues in the district. In many taluks of the district namely Sirsi, Siddapur, Yellapur, Haliyal, Mundgod and Supa, the annual availability of energy from horticultural residues is less than 250 million kWh per annum. Few villages (126) in the eastern part of Ankola taluk have the potential to produce 250 to 500 GWh bio-energy from horticulture residues. In some villages of Honnavar and Karwar taluks, annual energy availability from horticultural residues ranges from 500 to 2,000 GWh. Very few villages in the district have availability of energy from horticultural residues more than 10,000 GWh.
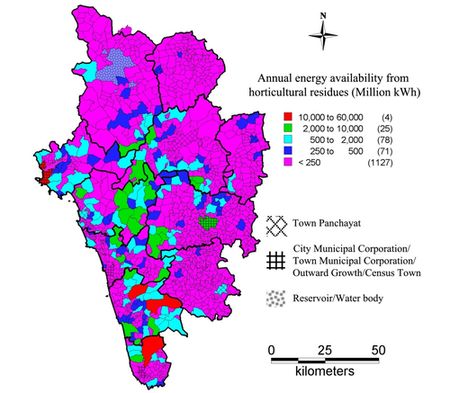
FIG. VII: ENERGY FROM HORTICULTURAL RESIDUES
FIG. VIII gives the combined annual energy availability from agriculture and horticulture residues. In majority of the villages annual energy availability is less than 250 GWh per annum. There are some villages in the district where energy availability ranges from 250 to 500 GWh (155 villages) and 500 to 2,000 GWh (225 villages). In 159 villages of eastern part of Ankola, Mundgod and Haliyal taluks, energy available from horticulture and agricultural residues is in the range of 2,000 to 10,000 GWh. In 9 villages, available bio-energy is more than 10,000 GWh which extends up to 90,000 GWh.
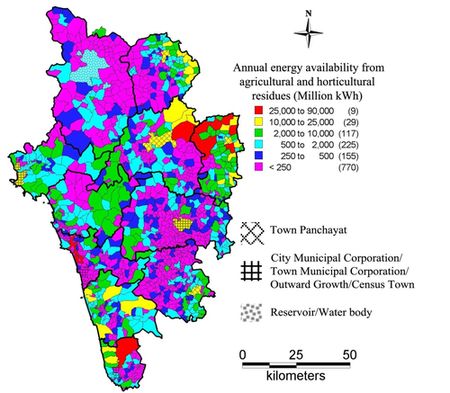
FIG. VIII ANNUAL ENERGY AVAILABILITY FROM AGRICULTURAL AND HORTICULTURAL RESIDUES
Biogas resource status
Livestock a vital component of agrarian ecosystem provides milk and manure. Other uses of livestock are wool, meat, transportation and for ploughing (or sowing). Animal residues from livestock aid in recharging the essential nutrients of soil. It also boosts the quality of the organic manure which increases the soil fertility.
Farmers in Uttara Kannada are prominently dependent on livestock for their agriculture and horticulture practices. Animal residue is the main feedstock for the production of biogas as well as manure. There are about 3,66,949 cattle, 1,18,669 Buffaloes, 2,702 Sheep, 11,994 Goats in Uttara Kannada. Other members of livestock are Pigs (900), Dogs (93,403) and Rabbits (277) which are in a smaller number. Total livestock population in the district is about 5,94,929 and poultry population is 3,61,351. Dung available from each cattle varies from 3-4 kg to 8-10 kg (from coastal to hilly region). Similarly average dung produced from a buffalo is 12-15 kg and from a hybrid one is 15-18 kg. By considering 3 kg dung production from a cattle in coastal area and 8 kg in hilly area, total dung production from cattle is about 6,32,058.46 tonnes per year. Similarly by considering the dung production per buffalo as 12 kg/day, total dung obtained is 5,19,770.22 tonnes per year. Assuming gas production of 0.036 m3 per kg of dung, total biogas generated will be 41,465 thousand m3 per year. National per capita natural gas consumption is about 54 m3 per annum; then the biogas produced from livestock residue could meet the 50% of the gas demand in Uttara Kannada district. (100% dung produced is considered to generate biogas). Table III gives the Taluk wise livestock population with annual dung and biogas production in the district.
TABLE III TALUK WISE DUNG AND BIOGAS PRODUCTION IN UTTARA KANNADA
| Taluk | Cattle population | Dung Prod./day (kg) | Dung Prod./yr (tonnes) | Buffalo population | Dung Prod./day (kg) | Dung Prod./yr (tonnes) | Total biogas production (*1000 m3) |
| Ankola | 28570 | 85710 | 31284.15 | 5967 | 71604 | 26135.46 | 2067.11 |
| Bhatkal | 24619 | 73857 | 26957.81 | 6094 | 73128 | 26691.72 | 1931.38 |
| Haliyal | 41485 | 124455 | 45426.08 | 20820 | 249840 | 91191.60 | 4918.24 |
| Honnavar | 47828 | 143484 | 52371.66 | 8849 | 106188 | 38758.62 | 3280.69 |
| Karwar | 11218 | 33654 | 12283.71 | 5460 | 65520 | 23914.80 | 1303.15 |
| Kumta | 35891 | 107673 | 39300.65 | 5820 | 69840 | 25491.60 | 2332.52 |
| Mundgod | 32122 | 96366 | 35173.59 | 8686 | 104232 | 38044.68 | 2635.86 |
| Siddhapur | 43881 | 351048 | 128132.52 | 18897 | 226764 | 82768.86 | 7592.45 |
| Sirsi | 52230 | 417840 | 152511.60 | 18845 | 226140 | 82541.10 | 8461.90 |
| Supa | 19052 | 57156 | 20861.94 | 8224 | 98688 | 36021.12 | 2047.79 |
| Yellapur | 30053 | 240424 | 87754.76 | 11007 | 132084 | 48210.66 | 4894.76 |
| Total | 366949 | 1731667 | 632058.46 | 118669 | 1424028 | 519770.22 | 41465.83 |
FIG. IX gives the annual biogas production from livestock residues in Uttara Kannada. It is evident that in majority of the villages in the district, annual biogas energy generated from biogas ranges from 0.1 to 0.5 million kWh. In 340 villages of Mundgod, Haliyal, Karwar and Siddapur taluks biogas energy generation is 0.5 to 1 GWh. Few villages in Bhatkal, Honnavar and Mundgod taluk have biogas based energy production of 1-12 GWh per annum.
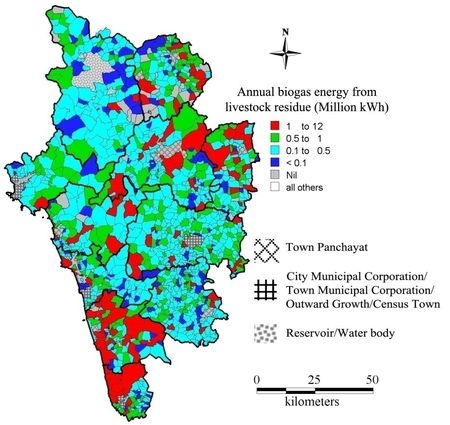
FIG. IX ANNUAL BIOGAS PRODUCTION FROM LIVESTOCK RESIDUES IN UTTARA KANNADA
FIG. X gives the availability to demand ratio of biogas resource in the district. In more than 50% of the villages (625 villages) the availability is less than demand; which are called biogas energy deficit regions. In 334 villages of Siddapur, Yellapur and Supa taluks supply to demand ratio is between 1 and 2. There are 275 villages in Ankola, Mundgod and eastern Yellapur taluk, availability is more than twice of biogas demand which are biogas surplus regions. About 40% of the villages have adequate biogas production potential to meet the domestic cooking and heating needs. These villages are to be considered for dissemination of biogas technology in the district.
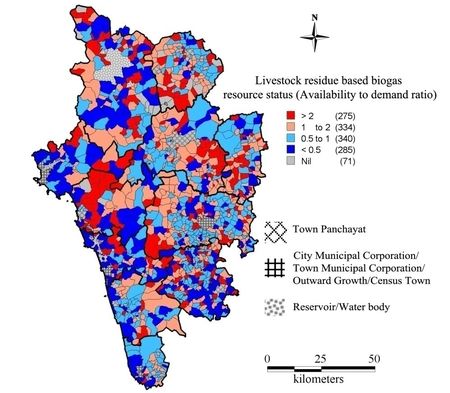
FIG. X: BIOGAS RESOURCE STATUS (SUPPLY TO DEMAND RATIO)
Techno-Economic analysis of Bio-energy technologies (BETs)
The major applications of bio-energy in the country are
- Domestic use i.e. for cooking, space heating (during winter), water heating (for bathing and livestock) and lighting;
- In rural industries (or home industries), for agricultural and horticultural crops processing, bricks and tiles manufacturing;
- Biogas production; and
- Electricity production (standalone community level, micro grids and decentralized generation at few locations)
Forest biomass, agricultural and horticultural residues are the main sources of bio-energy applications in the country followed by biogas, since most of the bio-energy based application requires combustion and heat transfer. Normally the fresh biomass contains about 20-60% of moisture (which cannot be burnt effectively), needs to be dried so that they are suitable for combustion. In Uttara Kannada, solar drying is adopted to remove moisture content in the biomass. However the energy obtained from biomass is depends on the content of the fuel as well as the efficiency of the stoves or combustion method used, analysis of fuel efficient BET would contribute to the improvement of the technologies.
1. Improved Cook stoves (ICs)
The most commonly used stoves in the rural households are either made from mud or from stones (or both). These traditional stoves (TCs) are constructed by local people and have efficiency of ~10% or less than that. Moreover, in traditional stoves oxygen supply is not sufficient this may lead to the generation of CO (carbon monoxide) which is poisonous. It is estimated that 826 million Indians depend on TCs that burn fuel wood or coal which causes pollution and the maximum temperature obtained is limited to lower values. In order to overcome these barriers, CST (formerly ASTRA) of IISc has designed an Improved Cookstove (ICs) to give maximum heat transfer with improved efficiency (20-35%) which allows the complete combustion of fuel. There are many ICs are available in market which give better efficiency than TCs and give complete combustion of fuel without CO gas emission. National Biomass Cookstoves Initiatives (NBCI) launched by MNRE (Ministry of New and Renewable Energy) on 2nd December 2009, has the primary aim to enhance the use of biomass ICs. MNRE perused the standards set by BIS (Bureau of Indian Standards) on solid biomass cookstoves – portable that was brought out by BIS in 1991 to examine the applicability of the standard and test protocols in view of the newer designs of cookstoves. This standard has been revised and draft is forwarded to BIS in November 2011 for further action. The ministry has suggested some standard performance factors for the cook stoves which are given in Table IV. Life span of traditional stoves built in rural areas is limited due to the usage of mud and stones. But ICs are constructed applying scientific technology and which gives longer lifetime. Due to thermal stress, cracks develop in the walls of a mud stove whereas ICs can withstand higher temperature. ICs are recommended due to higher efficiency, durability, high temperature applications and less GHG (Green House Gas) emission over traditional stoves (TCs).
TABLE IV: PERFORMANCE PARAMETERS FOR IMPROVED COOK STOVES
| Type of biomass cookstove | Standard performance parameters | ||
| Thermal efficiency (%) | CO (g/MJd) | TPM* (mg/MJd) |
|
| Natural draft type | >25 | <= 5 | <= 350 |
| Forced draft type | >35 | <= 5 | <= 150 |
2. Biomass fueled steam generation
Steam is generated through direct combustion of biomass which is a viable energy carrier in many applications. Bio mass fired power systems produce both heat as well as electrical energy mainly used in CHP (Combined Heat and Power) plants. These systems have found application is many industries such as paper and pulp, sugar, steel and plywood industries. In many applications, steam of high pressure and temperature generated from biomass combustion is used to run the turbine which is coupled with alternator. Steam of low pressure and temperature is collected from the outlets of turbine and used for other applications such as heating, drying or primary heating of water. Co-firing of biomass in modern large scale coal power plants is efficient and cost effective. Efficiency of co-fired plants is more (35-45%) compare to the biomass dedicated plants. Using low cost biomass from solid waste, crop residues etc., payback period of the plant is lesser ranges from 3 to 5 years with higher return on investment (ROI).
3. Biogas Technology
The district has significant livestock population which is the main source of dung production. Cattle dung offers a very high potential of biogas production which can meet the ever increasing domestic cooking fuel demand. The slurry generated in the biogas production is good manure which can be used to prepare compost or directly fed to agricultural or horticultural plantations. Biogas mainly comprises of methane (60-65%) and carbon dioxide (35-40%) having a small fraction Hydrogen sulphide and water vapor. Biogas is about 20% lighter than air which cannot be converted into liquid unlike LPG (Liquefied Petroleum Gas) under normal temperature and pressure (NTP). Biogas generation from dung or agricultural and horticultural residues is dependent on temperature, carbon : nitrogen ratio (C:N), pH and retention period. Temperature is the most prominent factor that affects the biogas generation; generation stops below the temperature of 10°C. The optimum conditions for biogas generation are: temperature 30-35°C, pH 6.8-7.5, carbon : nitrogen ratio (C:N) 20-30, solid contents 7-9%, retention time 20-40 days. The retention period decides the rate of digestion, longer the retention time more the gas generated for a given amount of waste. There are many technologies available for biogas generation depending upon the availability of resources. The most widely used technologies are:
- Fixed Dome model (40 and 55 days retention period)
- Deenabandhu brick masonry
- Deenabandhu ferro-cement in-situ construction
- Floating Dome model (30,40 and 55 days retention period)
- KVIC (Kadhi and Village Industries Commission) floating metal drum
- KVIC reinforced cement concrete (RCC) digester
- Prefabricated Model for limited field trial (40 days retention period)
- Sintex - HDPE prefabricated Deenbandhu
- Optimized design developed by Application of Science and Technology to Rural Areas (ASTRA) of IISc [34].
- Fixed dome type designed by University of Agricultural Sciences - Bhagyalaxmi design.
Raitabandu Biogas Plant - designed by a farmer from Sagar Taluk, Shimoga district to suit the needs of the Malnad region.
4. Applications of Biogas
Biogas is mainly used for cooking as it can be directly burned which is more efficient and produces negligible fumes. Biogas can substitute fuel wood and LPG for cooking and water heating. Biogas produced in the district can meet 50% of the total gas demand (Table IV). The other applications of biogas are for lighting and electricity generation. Biogas has better illumination ability; it can be used for lighting instead of kerosene lamps.
Electrical energy generation is an important application of biogas where it is used to produce steam or used with diesel in co-generation units. Biogas has higher calorific value (4,700 kcal) which can be effectively utilized for electricity generation. Biogas is used with conventional fuels such as diesel or coal in CHP (Combined Heat and Power) generation which improves the efficiency of the plant. The system capacity ranges from 3 to 250 kW for a decentralized power generation. This can meet the rural domestic electricity demand and enables hybridization with other renewable energy based generating systems on micro/smart grid platform. A community level plant which is fueled by biogas and diesel can supply the irrigation pump sets during day time and lighting load during night. In the same manner if it is hybridized with solar, wind or pico hydro plants (depending on the potential), then such decentralized generation can meet the energy demand without depending on the conventional grid. The standalone generating mechanism leads to sustainable development by ensuring the reliable and pollution free power generation. Up-gradation to smart grid infrastructure is possible through integration of communication and automatic control networks.
MNRE has initiated “Biogas based Distributed/Grid Power Generation Programme” (4th January 2006) to promote biogas based power generation especially in rural areas in a decentralized way. It also helps in utilizing the waste generated in that region and produces valuable manure as a byproduct. There are about 98 installed plants with cumulative capacity of 793.25 kW in the country (as of March 2011). There are 250 plants that are under installation adding 5824 kW in future. Karnataka has 5 installed plants with total capacity of 66 kW and 36 plants are being installed (695 kW). The ministry is also providing the financial aid for biogas based power generation plants depending upon the ratings, maximum up to 40% of the plant cost. Cost of the biogas plant depends upon the size gas storage area and retention duration. For a fixed dome Deenabandhu model with retention period of 40 days, cost ranges from INR 12,000 to INR 24,000 (depending on the size: 1 m3 to 4 m3). Similarly if retention period is 55 days then cost ranges from INR 16,000 to 31,000. For a KVIC masonry digester and steel gas holder which has retention period of 30 days, plant cost varies from INR 19,000 to 28,000 (1 m3 to 4 m3). If retention period is increased to 40 days the cost also increases, i.e. INR 24,000 for 1 m3 and INR 39,000 for 4 m3 plant. The average payback period of biogas plant decreases with increase in size of the plant which ranges from 4.07 years (1 m3) to 2.45 years (4 m3). The cost of electrical energy produced from biogas is about INR 5.5 per kWh and the capital cost ranges from INR 1,50,000 to 2,00,000 depending upon the capacity of the plant (CHP plant). In case of direct combustion of fuel wood, operating cost is about INR 2.5 per kWh and capital cost varies from INR 60,000 to 1,00,000.
5. Biomass gasification
Fuel wood can be converted into gas using thermo-chemical processes with only 2 - 4% of ash. Gasification is carried out in oxygen starved environment so as to generate Carbon monoxide and Hydrogen which are combustible. The reactions are carried out in elevated temperature of 500-1,400 °C and pressure of 33 bar (480 psi). The main difference between biomass gasification and biogas generation is that, wet organic feed stocks such as animal dung and sewage waste are used in biogas production. Mostly fuel wood, forest residues, agricultural and horticultural residues are the main sources for gasification. Air based gasifiers normally produce a gas with high nitrogen content, whose calorific value varies between 4 and 6 MJ/Nm3 (100-1200 kilocalories/Nm3). Oxygen and steam based gasifiers produce a gas with relatively high calorific value of 10 to 20 MJ/Nm3. Gas generated from biomass is also called as Producer gas which is highly combustible.
Pyrolysis is the primary step of converting biomass into gas in which the biomass decomposition takes place, producing volatile materials (75-90%) in the form of gas and liquid, and char which is non-volatile. In the later steps (gasification), volatile hydrocarbons and char are converted to combustible gas. FIG. XI shows the biomass gasification process and byproducts generated in the process. Many types of biomass gasifiers [Table V] have been developed depending upon the flow of fuel and oxidants and means of supporting structures:
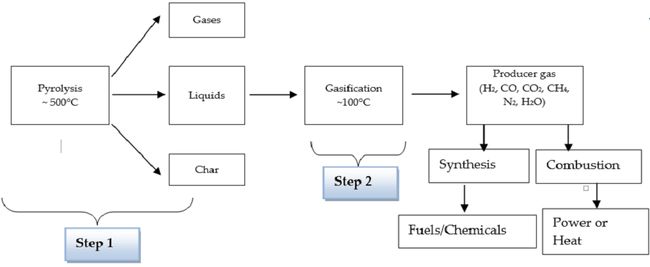
FIG. XI PROCESS OF GASIFICATION
TABLE V: TYPES OF GASIFIERS
| Gasifies type | Flow direction | Type of support | |
| Fuel | Oxidant | ||
| Updraft fixed bed | Down | Up | Grate |
| Downdraft fixed bed | Down | Down | Grate |
| Bubbling fluidized bed | Up | Up | None |
| Circulating fluidized bed | Up | Up | None |
6. Electricity generation from biomass gasification
End product in gasification process is combustible gas (Producer gas) which may either be used for cooking or electricity generation (steam and directly feeding to generator). Gas is burnt and team high pressure steam is obtained at very high temperature.Steam is used to run turbines which are mechanically coupled with alternators. Alternators generate electrical power depending on the capacity which may be fed to consumers or supplied to grid. The combustible gas may be directly fed to external combustion engines which are connected to alternators. However the output of the alternator is same but the efficiency in latter method is marginally higher. Normally the producer gas is used in dual fueled generating stations in order to reduce the stress on fossil fuel demand.
Economic analysis
Bioenergy is renewable energy source, freely available in most of the regions in India (or very inexpensive). BETs mainly use the residues (byproducts) of forest, agriculture, horticulture etc and animal waste which are abundantly available in rural areas. Municipal Solid Waste (MSW) is the source for bioenergy (biogas) in urban area with massive productivity. Hence the availability of resource for bioenergy generation is plenty and has negligible cost compare to fossil fuels. Table VI shows the comparison of different power plants under capital cost requirements. Biomass based power generation system requires less capital cost compare to other technologies since land, infrastructure and technology requirements are less expensive. Table VII gives the comparison of overnight capital cost and O&M costs of different power plants.
TABLE VI: CAPITAL COST OF POWER PLANTS
| Type of technology | Capital cost (million rupees/MW) |
| Solar photovoltaic | 300-400 |
| Micro-hydel | 40-60 |
| Wind | 40-50 |
| Biomass | 20-40 |
TABLE VII: OVERNIGHT CAPITAL COST AND O&M COSTS
| Power plant | Overnight Capital Cost ($/kW) |
| Coal | 2844-5348 |
| Natural gas | 665-2060 |
| Nuclear | 5339 |
| Fuel cell | 6835 |
| Geothermal | 4141 |
| Hydropower | 3078 |
| Wind | 2438 |
| Wind offshore | 5975 |
| Solar thermal | 4692 |
| Solar PV | 4755 |
| Biomass | 3860 |
| MSW-Landfill gas | 8232 |
The generation cost of electricity from bioenergy is marginally high compare to conventional methods. Nevertheless cost/kWh is less in case of direct biomass combustion since fuel wood is freely available. Table VIII gives the cost/MWh energy generation from different technologies.
TABLE VIII: ELECTRICAL ENERGY GENERATION COST COMPARISON OF DIFFERENT POWER PLANTS
| Type of Power Plant | Rs/MWh (at 5% Discount rate) | Rs/MWh (at 10% Discount rate) |
| Nuclear | 2440.8 | 4217.24 |
| Coal | 3400.2 | 4643.17 |
| Gas | 3877.65 | 4339.85 |
| Hydro – Small hydro | 4743 | 8501.27 |
| Large hydro | 4557.15 | 8841.65 |
| Wind – Onshore | 4887 | 8346.17 |
| Offshore | 6276.15 | 8999.03 |
| Geothermal | 4438.35 | 7244.28 |
| Solar – PV | 12600.45 | 19058.99 |
| PV (rooftop)1 | 15854 | 23273.48 |
| Solar thermal2 | 9503.1 | 14809.73 |
| Biomass3 | Rs. 4.55 to 6.75 | |
(Source: International Energy Agency (IEA) Nuclear Energy Agency (NEA), Organization for Economic Co-operation and Development, 2010)
1 Solar PV (rooftop) system in Germany,
2 Solar thermal systems in United States
3 MNRE, Case Studies of Selected Biomass Power Projects in India