Introduction
Energy is the fundamental need of human beings with air, water, shelter and food (energy). In ancient time energy used by human was about 2,500 kJ per day. After the invention of fire and other energy harvesting methods from sun, water and wind, energy usage has been increased to 30,000 kJ per day. In the present day, energy used by humans is more than 2 lakh kJ every day. As the energy demand has increased, exploitation of resources to produce energy is also increased where the fossil fuels hold the major share in generating energy. In India, more than 68% of the total primary energy supply (TPES) is supplied from non-renewable energy sources (coal, crude oil or natural gas) and around 18% is from hydro resources. Only about 12% of the energy basket is supplied by renewable energy sources which include solar, wind, geothermal, tidal etc. Though most of the energy need is harvested from fossil fuels, 70% of the rural population depends on the bio energy for their domestic usage in the country.
Bio-energy refers to the energy released when organic carbon reacts with oxygen. This energy may be harvested from plants or animals which are also called as biomass. During the process of photosynthesis some energy will be trapped and stored in the form of organic carbon in plants from which energy can be extracted through burning. Biomass is the most processed energy form of carbon and used as primary energy which can substitute the non-renewable energy sources. Bio-energy resources combine fuel wood from forest, biogas, bagasse, agricultural residues, livestock residues, feedstock residues, solid waste etc.
Bio-energy plays a prominent role in country’s economy and an important component of TPES. Technical analysis of the bio energy technologies (BETs) would help to understand the recent developments and the need for the further research in the respective area. Cost of energy harvesting technology and the energy source is an important factor of consideration for its feasibility to common man. Bio energy is an in-exhaustive source, freely available in most of the situations (or very inexpensive). BETs mainly use the residues (byproducts) of forest, agriculture, horticulture etc. and animal waste which are abundantly available in rural areas. Biomass based power generation system requires less capital cost compare to other technologies since land, infrastructure and technology requirements are less expensive. However bio energy utilization is techno-economically feasible and contributes significantly to the economic growth of the country. About 70% of the Indian population lives in rural area where 75% of the primary energy need is supplied by bio energy resources. About 70-85% of the rural households depend on firewood, 10% on dung cake and 5% on LPG for cooking where as 22% of the urban households depend on firewood, 22% on kerosene and 44% on LPG for cooking in the country. About 7,40,00,000 households in the country yet to be electrified and more than 32,000 villages do not have access to electricity. The electric power supply in electrified villages is not reliable with frequent load shedding. About 50% of the rural households depend on kerosene and 48% of the households depend on electricity for lighting. This highlights the role of bio energy in meeting the region’s energy demand and to the country’s economy.
1. Present Bio-energy status in India
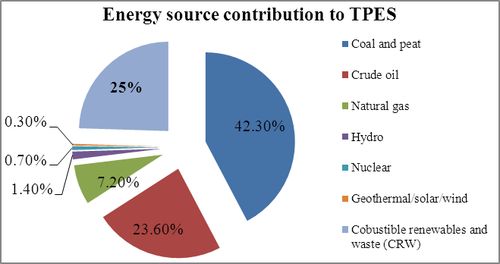
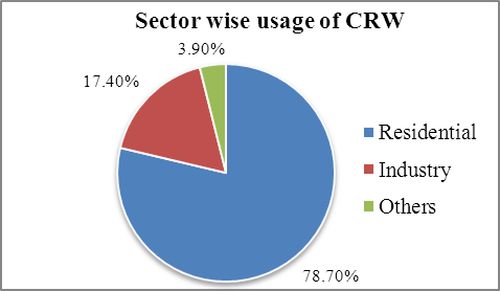
India is the 4th most energy producing country in the world with a population share of 17.5% of the world’s population. As the population increased, the energy requirement also increased over the years which led to exploitation of resources at a higher rate. Per capita Total Primary Energy Supply (TPES) in India was about 540 kgoe (kilogram oil equivalent) in 2010 and World average was 1803 kgoe. Coal and peat are the major contributors to the TPES with a share of 42.30% followed by crude oil (23.60%) and natural gas (7.20%). Combustible Renewable and waste (CRW) is the 2nd prominent source of TPES with a share of 25%. FIG. I (a) gives the percentage share of energy sources in total primary energy supply in India. Residential sector gets around 78% of the energy from CRW sources followed by Industries (17.40%). FIG. I(b) gives the sector wise usage of CRW in the country. It clearly shows that major part of the domestic energy consumption is supplied by the combustible renewable or bio energy.

FIG. I(a) SHARE OF ENERGY SOURCES IN TPES

FIG. I(b) SECTOR WISE SHARE OF CRW
Energy demand is in direct relation with population, demand increases with the population. Total primary energy demand in India was 117.2 Mtoe in 1960-61 and around 5.2% of the total demand was imported. Per capita energy demand was 266.82 kgoe in 1961 while the total population was about 43.9 crores. Total primary energy demand increased to twice in 45 years which is 539 Mtoe in 2007. Population in 2007 was 112.9 crores and per capita energy demand is about 477.12 kgoe. About 15.5% of the total energy is being imported in the present day where the total demand has crossed 715 Mtoe. Table I gives the trends in demand and supply of primary energy in India from 1960-61 to 2011-12. It also shows the increase in population for the same duration.
Table I: Trends in demand and supply of primary energy (Mtoe)
| Year | Population (Millions) | TPES (Mtoe) | Net Imports (Mtoe) | % Imports |
| 1960-61 | 439.23 | 117.2 | 6.04 | 5.15 |
| 1970-71 | 547.90 | 147.05 | 12.66 | 8.61 |
| 1980-81 | 685.20 | 208.3 | 24.63 | 11.82 |
| 1990-91 | 843.93 | 303.15 | 31.07 | 10.25 |
| 2000-01 | 1027 | 432.75 | 89.03 | 20.57 |
| 2006-07 | 1130 | 539.09 | 131.97 | 24.48 |
| 2007-08 | 1158 | 617.52 | 154.38 | 25.00 |
| 2008-09 | 1174 | 656.27 | 164.07 | 25.00 |
| 2009-10 | 1190 | 673.84 | 168.46 | 25.00 |
| 2010-11 | 1220 | 715.00 | 111.00 | 15.52 |
Energy generation in the country depends mostly on fossil fuels which are limited in nature. Since India has fewer fossil fuel resources and these resources should be conserved for the future generation, the country is importing significant amount of petroleum oil, nuclear energy resources, coal, natural gas etc. This trade is affecting the economic growth of the country and also more and more fossil fuel extraction has adverse effects on sustainable development. Burning of fossil fuels emits enormous amount of carbon dioxide (CO2) and other gases (CO, SO2 or nuclear waste) which are the root cause for all global and ecological problems. However renewable energy applications have negligible carbon dioxide emission and eco-friendly. About 25% of the primary energy demand is supplied by combustible renewable and wastes in India, where most of the rural population depends on bio energy.
Rural population of India mostly depends on bio energy for cooking, space and water heating. About 75% of the energy demand is supplied by bio energy in rural areas of the country where 70% of the total population live. The bio energy use in the country is showing a decreasing trend over the years due to urbanization and rural electrification; nevertheless at present about 25% of the energy demand is met by bio energy. More than 50% of the primary energy demand was supplied by bio energy in 1983 which is about 25% in 2010 [13]. Bio energy has a significant share in the TPES which effects the total energy generation of the country. Since energy independence and the per capita energy consumption is one of the prominent factor to decide country’s development, bio energy is also has a significant effect on developmental issues. Other important aspect associated with energy generation is regarding environmental pollution and waste disposal. Bio energy resources are renewable in nature and combustion would not produce poisonous gases and ash with sufficient oxygen supply. However the CO2 generated during combustion of bio energy is used by plants in the process of photosynthesis. Hence the ecological balance is not disturbed by using bio energy [14]. This process leads to forestation which is the important part of ecological system to maintain the balance and to promote sustainability. Table II gives the share of Combustible Renewable and Waste (CRW) in TPES for the duration 1983 to 2010 in the country.
Table II: Share of CRW in TPES for the duration of 1983-2010
| Year | Share or CRW in TPES (%) | Year | Share or CRW in TPES (%) |
| 1983 | 52.3 | 1997 | 34.6 |
| 1984 | 50.8 | 1998 | 34.2 |
| 1985 | 48.9 | 1999 | 32.7 |
| 1986 | 47.6 | 2000 | 32.6 |
| 1987 | 46.7 | 2001 | 32.5 |
| 1988 | 44.9 | 2002 | 32.0 |
| 1989 | 43.4 | 2003 | 31.5 |
| 1990 | 42.1 | 2004 | 30.2 |
| 1991 | 41.1 | 2005 | 29.5 |
| 1992 | 40.0 | 2006 | 28.4 |
| 1993 | 39.3 | 2007 | 27.3 |
| 1994 | 38.1 | 2008 | 26.5 |
| 1995 | 36.4 | 2009 | 24.9 |
| 1996 | 35.6 | 2010 | 24.6 |
Investigations at village levels of domestic energy consumption will help to assess the demand and supply of bio energy in the country. For bio energy assessment Uttara Kannada district in Karnataka state, India is chosen which has evergreen as well as moist and dry deciduous forests. In the district majority of the people live in rural area or in semi urban area, mostly dependent on forest, agricultural and livestock residues for domestic energy need.

