Materials and Method
Study Area
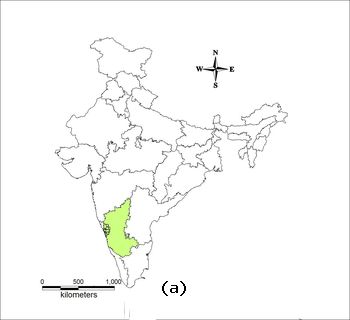
Uttara Kannada district is located between 13° 55´ and 15° 31´ latitudes and 74° 9´ and 75° 10´ longitudes (FIG. II). It is the 4th biggest district of the state having population of 14,36,847, with more than 70% of the people live in rural area or in semi urban area. District is located in the central Western Ghats region having rich ecology, flora and fauna. More than 75% of the geographical area is under forests.


FIG. II STUDY AREA: UTTARA KANNADA DISTRICT
The geographical heterogeneity is responsible for the diverse growth of vegetation in the district. Taluks of the district are categorized under 4 different types of forests which are
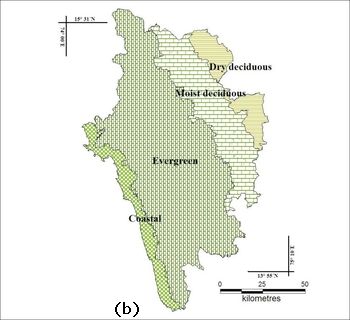
- Ever green forests normally found in Sirsi, Siddapur and eastern hilly regions of Honnavar, Kumta and Ankola Taluks.
- Semi Deciduous forest, found in slopes of Ankola, Kumta, Karwar, Honnavar, Siddapur and Sirsi.
- Deciduous forests are mostly found in Haliyal, Supa and Mundgod region.
- Forest in the coastal region, normally found in Kumta, Honnavar, Ankola, Karwar and Bhatkal region.
FIG. II(a) gives the location of the study and FIG. II(b) gives the climatic zones and forest types of Uttara Kannada. Extent of the forest cover and type of forest has a major effect on bio energy supply. Evergreen forest found in most of the places in the central region followed by moist and dry deciduous forests.
Method and Data
Bioenergy status assessment is done based on the resource availability and bioenergy requirement in the district. Having the knowledge of current bioenergy usage pattern in different agroclimatic zones, demand for bioenergy is computed. Bioresourse is mainly depends on the land use pattern, forest cover and yields of various crops. Using the earlier energy survey data and by spatio temporal land use dynamics analysis availability of resources and corresponding demands are calculated. All the estimations are done taluk wise and aggregated for each agroclimatic zone.
LULC dynamics of Uttara Kannada
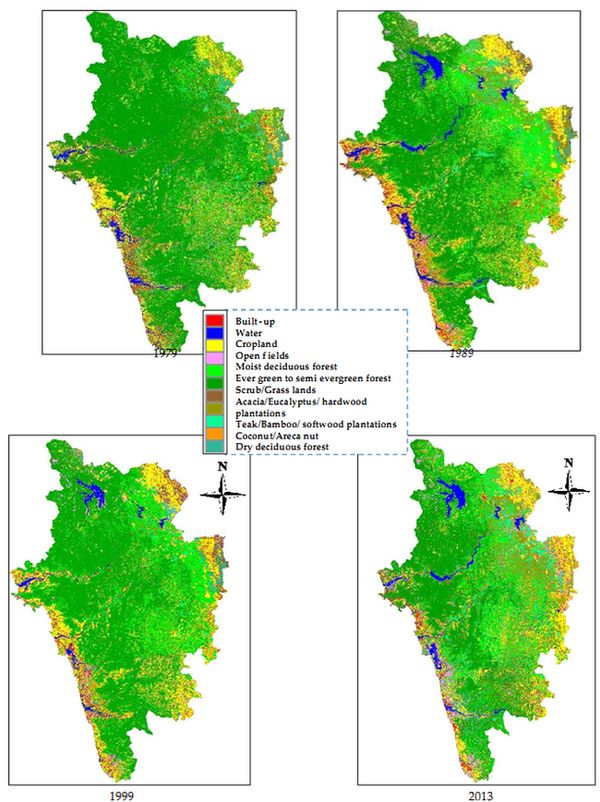
Forest resources constitute the primary source of energy in the district. The analysis of land use dynamics during 1979 to 2013 shows that about 75.88% of area under evergreen forest (1979) has declined 53% in 2013. Areas under agriculture land and forest plantations have increased from 10.22% and 7.79% to 14.13% and 18.64% respectively. FIG III depicts the land use dynamics during 1979 to 2013 in Uttara Kannada district. It is evident that forest cover decreased and built up area and crop lands have increased over the years.

FIG III: LAND USE DYNAMICS OF UTTARA KANNADA

