|
RESULTS AND DISCUSSION
Population census of 2011 [103] shows that majority (56%) of urban households have four or less members. The analysis of 1967 sample households reveals a similar trend of 4.5 persons per household. Fig. 5 illustrates the distribution of household family size in urban areas - 4 persons per family dominates the sample (45.9%) followed by 19.2% family having 5 persons, 14.5% family with 3 persons. A larger family of greater than 6 constitutes 6.5% of the total sample. Spatial distribution of size of the households in the study area i.e. different wards of Greater Bangalore illustrate that majority of the households (902) have household size of 4, while 128 households have more than 6 persons indicating the prevalence of joint family in Bangalore.
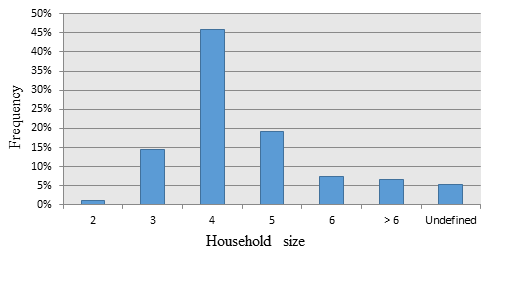
Fig. 5. Household size in surveyed area
Age structure composition forms an important characteristic of any population, which varies significantly with age. Demographic variables such as population expansion, rapid urbanization, aging society and shrinking household size drives carbon emissions [104] evident from higher consumption of energy and higher emissions in the population aged between 15 and 64, [105, 106, 107] and lower energy consumption by senior (>65 years) citizens [108] and contrary results are reported by some [109, 110, 111]. The influence of demographic agents on energy consumption and carbon emissions was comprehensively established in macro-level analysis which highlight that higher population density is associated with lower levels of energy consumption and emissions [112]. Similar analyses [113,114] in developing countries considering household size conclude that larger size of household were associated with lower levels of aggregate carbon emissions. Thus, demographic data is useful in regional planning when it is cross classified by variables like marital status, literacy educational attainment, economic activity, etc.
In sampled households of 1967 households, children and youth (<21 years) dominate (39.2%), followed by age group 41-60 with 31.3%. Middle age individuals (21-40) constitute 21.2% and senior citizens (>60 years) is about 8.1%. The distribution of various age groups shows that senior citizens is one per house in 271 households, while 141 samples had 2 senior citizens per house Age group distribution reveal that the individuals of 40-60 of one person per house in 702 samples and two persons per house in 731 samples, illustrates the age group of 21-40. 790 households are with only one member followed by 248 houses (2 members), 51 households (3 members), and 23 households (4 members). Children and youth form the major section of the society (39.28%). Large proportion of the households have two children (839 samples) followed by 511 (one child), 162 households (3 children), 40 households (4 children), 10 households (5 children) and about 5 households have more than 6 children per family.
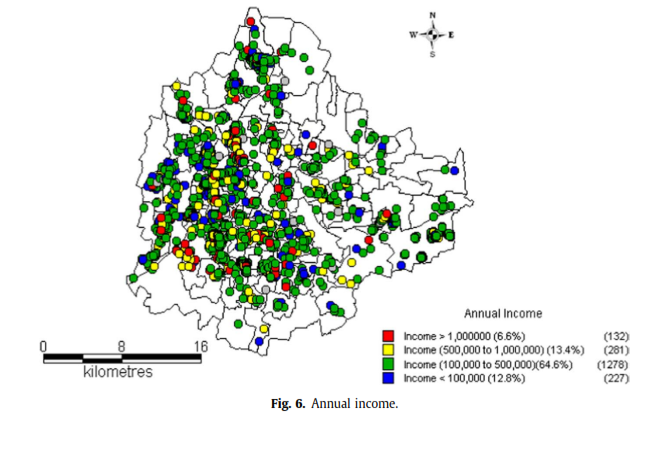
Earlier studies have revealed the linkage of family income with the level of energy consumption, evident from 3 times higher consumption of electricity in high income category compared to low income homes [1]. Earlier studies also highlight the linkage between economic growth of a family and emissions indicating as the income increases the emissions increase and at a stage it stabilizes and subsequently decreases [115, 116, 117]. Income is one of the major parameter influencing household energy consumption and Fig. 6 gives the distribution and grouping of households based on annual income. Middle income (Rs. 1-5 lakh per year) with 64.6% (1278 samples) constitutes the major category among the surveyed households. The spatial distribution of various income categories is given in Fig. 6. 132 households have the annual income > 1 million Rs. in wards such as Doddanekundi, Raja Rajeshwari Nagar, Ullal, Chowdeswari, etc.
Most of the sampled residential houses have floor area <1200 sq. feet (135 sq.m), while 775 samples are between 1200 to 2400 sq. feet and 6.2 % of them having the floor area in the range of 2400 to 5000 sq. feet mainly in the southern part of Bangalore. Small fraction of the sample (1%) have floor area >5000 sq. feet at Doddanekundi, HSR layout, Laggere etc. Higher energy consumption and per capita emissions is in residential households with larger floor area.
Bangalore grew rapidly subsequent to the globalization and consequent opening up of markets leading to unplanned urbanization. This is evident from intense urbanization at city center and dispersed growth at outskirts. Zone wise distribution of houses (depending on the year of construction) is given in Fig. 7, which illustrates that about 52% of houses in all zones except NW are have been constructed recently (explained before, due to IT and BT boom). Industrial layouts, residential townships spurted in S and SW zones.
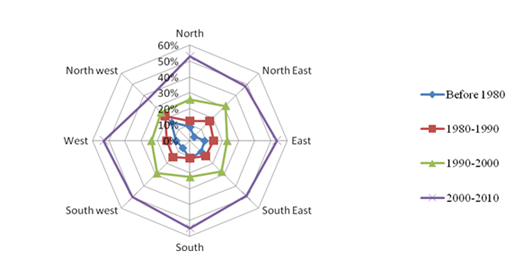
Fig. 7. House unit built
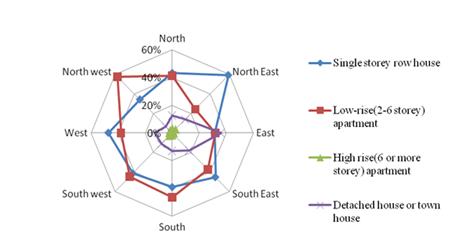
Most of the buildings in Bangalore are either low raise apartment (41.99%, 826 units) or single-storey row houses (40.72%, 801units), 15% were detached houses mainly in SE zone and only 2% are high-rise apartment which are concentrated in the center of the city. Zone wise distribution of different types of buildings (Fig. 8 ) indicate that single-storey row houses are concentrated in the NE (59%) followed by W(47.2%), SE (45.1%), N (43.0%), S (39.0%), NW (33.8%), and E (31.0%) zones. Similarly, 57% low-raise apartments are in NW and 21.1% in NE. E zone has large proportion of detached houses or town houses (35.9%). High raise apartment constitutes 1.1% in E to 3.4% in NE zones. High rise apartments have come up in the recent decade with the relaxation of FAR (Floor area ratio) with rapid urbanisation. Higher energy consumption is in nuclear families and buildings with higher FAR. This necessitates exploration of alternate sources of energy to meet the growing energy demand in decentralized way.
Solar energy is the most abundant permanent energy resource on earth and it is available for use in its direct (solar radiation) and indirect (wind, biomass, hydro, ocean, etc.) forms [118]. Solar energy is clean, safe, easy to maintain and sustainable method of generating power. Solar energy is widely accessible and it is free from greenhouse gases emission and does not contribute to global climate change. India has a higher insolation of solar energy due to its favorable location in the solar belt (40°S to 40°N) and receives annual sunshine of 2600 to 3200 hours. Solar cookers, dryers, improved cook stoves can be used in domestic sector whereas, solar and wind driven pumps are reliable in irrigation. Captive electric energy generation using solid waste, bagasse, agricultural and horticultural residues, wind and solar are viable in industrial sector. Hence the Renewable sources can replace the present energy mix with higher share with distributed generation and micro-grid (rooftop) generation. Assessment of solar potential in India reveals nearly 58% covering 1.89 million km2 of the geographical area potentially represents the solar hotspots in India with more than 5 kWh/m2/day of annual average Global insolation [5]. The identification of solar potential and appropriate policy interventions of the federal governments have hastened the penetration off-grid and grid-connected solar energy based systems. The decentralized electricity generation has reduced T & D losses while meeting the regional energy demand. A techno-economic analysis of the solar power technologies and a prospective minimal utilization of the land available within these solar hotspots demonstrate their immense power generation as well as emission reduction potential. Renewable energy sources and technologies have potential to provide solutions to the longstanding energy problems being faced by the developing countries like India and have potential to offset a huge volume of GHG emissions [119].
The National Action Plan on Climate Change (NAPCC) under Jawaharlal Nehru National Solar Mission (JNNSM) identified the development and deployment of solar energy technologies in the country to achieve parity with grid power tariff by 2022 [120]. Energy is required for heating, lighting and motive power (pump water) in the domestic sector. Water heating for bathing purposes constitutes one of the energy activities in most households. Using clean energy such as electricity for low-end energy inefficient activities such as water heating necessitates the energy auditing in household sector and also the extent of penetration of energy efficient devices. Heating systems used for water heating (bathing purpose) includes fuel wood stove, solar water heater, electrical heaters and others. Majority samples (39.76%) use electric heaters, followed by solar water heaters (24.76 %), others (which include LPG, etc.) constituting 20.1%. Higher penetration of solar water heaters in Bangalore could be attributed to the energy policy of the federal government. The Government has mandated compulsory installation of Solar water heaters in the residential and commercial buildings having plinth area of more than 600 sq. ft. in Karnataka [121]. About 8.1% of the population still use traditional fuel wood stove for water heating purpose. Improved cook stoves, CFL/LED lamps, energy efficient heaters and coolers will help in reducing the significant amount of energy in the household sector. Solar water heater and rooftop solar PV installation helps in substituting electricity (lighting, etc.) and biomass (water heating) respectively [68].
About 53.4% of samples have adopted solar devices for water heating and these households have adopted solar devices for water heating as the option is environment friendly (17.49%, 344 samples), saving energy (16.73%, 329 samples) or due to subsidy from the government (3.30%, 65 samples). The spatial distribution of use of electric heater, solar heaters, etc. for water heating highlights the success of alternate technologies for water heating especially in some locations such as K.R.Puram, Hosakerehalli, Kengeri and Dasarahalli etc.
Expenditure on heating bill with subsidy indicates majority households (497, 25.97%) spend monthly about Rs. 200-500 whereas 250 households (13.62%) spend less than 200 rupee per month. Energy used for cooking purposes in domestic sector includes electricity, fuel wood, LPG, etc. In India, about 33.6 million households uses the LPG as cooking fuel [123]. The fuel wood, LPG, etc. contribute emissions of greenhouse gases. LPG is used for cooking in the majority (78.75%, 1549) households. LPG and electric heaters are used in 11.54% or 227 households. Most of the households have major rooms towards east (39.76%, 782 samples) and north (22.01%, 433 samples) from better ventilation perspective.
Majority (62.89%, 1237 samples) are keen to conserve energy to reduce the carbon emission while 398 samples for economic reasons and 7.47% want to conserve to save energy as well as money. Analysis shows the deployment of solar appliances in 584 samples. Among these, 430 households have availed the facility of government subsidy. About 55.47% (1091 samples) wants to switch over to solar appliances as they are environment friendly. 14.79% (291) wanted to adopt solar appliances to save money as well as for environment friendliness. About 22.42% of household (441) have plan to install solar appliances. However, large proportions of the sample (997, 50.69%) are not sure of installing solar appliances.
3.1. Spatial Variations in Household Energy Consumption
The domestic sector plays a dominate role in energy consumption across various income classes in urban areas. [7]. In India, about 30% of total residential electricity is consumed for lighting followed by the refrigerators, fans, electric water heaters, televisions, mobile charging, etc. [21]. Electricity consumption in the domestic sector has been increasing rapidly in Greater Bangalore. Usage of air conditioners and high energy gadgets has enhanced the energy consumption in high income households. The annual per capita electricity consumption variation spatially reveals that about 700 households use annual per capita electricity in the range 100-400 kWh. About 226 households use annual per capita electricity in the range 400-600 kWh. An energy guzzler (1000 units per year per person) happens in 140 households. 36 households are highly energy intensive consuming more than 1000 units (kWh)/Year.
Zone wise analysis of annual electricity consumption given in Table 3.1, shows the variation from 917.21± 754.05 (NE) to 1764.03±1362.29 (S) zone. Similar trends are observed in per capita annual electricity consumption (Table 3.2 and Fig. 9), which varies 230.91±210.84 (NE) to 412.30±297.75 (S). Zone wise variation of per capita electricity consumption shows the variation of 30 kWh/year to a max of 1796 kWh/year (SW) followed by the North East with 9.64 to 750 kWh/Year. East Zone is with minimum per capita electricity consumption 18.57 to 2337 kWh/year.
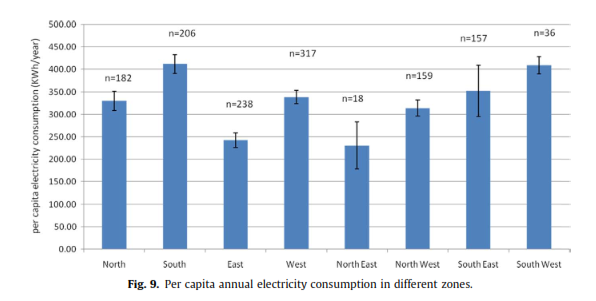
Table 3.1 Total electricity consumption (KWh/Year)
Zones |
Minimum |
Maximum |
Mean |
SD |
North |
150.00 |
8018.00 |
1377.24 |
1135.77 |
South |
169.00 |
7610.00 |
1764.03 |
1362.29 |
East |
104.00 |
9349.00 |
1152.34 |
1226.92 |
West |
100.00 |
6924.00 |
1420.84 |
1075.14 |
North East |
106.00 |
3000.00 |
917.21 |
754.05 |
North West |
108.00 |
5112.00 |
1273.28 |
891.61 |
South West |
155.00 |
4822.00 |
1723.83 |
1006.52 |
South East |
127.66 |
6023.70 |
1472.31 |
1245.31 |
Table 3.2 Electricity consumption per capita (KWh/Year)
Zones |
Minimum |
Maximum |
Mean |
SD |
North |
30.00 |
1796.00 |
330.30 |
276.69 |
South |
28.00 |
1902.50 |
412.30 |
297.75 |
East |
18.57 |
2337.25 |
242.85 |
245.34 |
West |
17.00 |
1731.00 |
338.72 |
262.31 |
North East |
9.64 |
750.00 |
230.91 |
210.84 |
North West |
24.60 |
1056.25 |
314.03 |
220.62 |
South West |
48.80 |
1577.67 |
409.65 |
240.18 |
South East |
31.91 |
1505.93 |
352.96 |
326.62 |
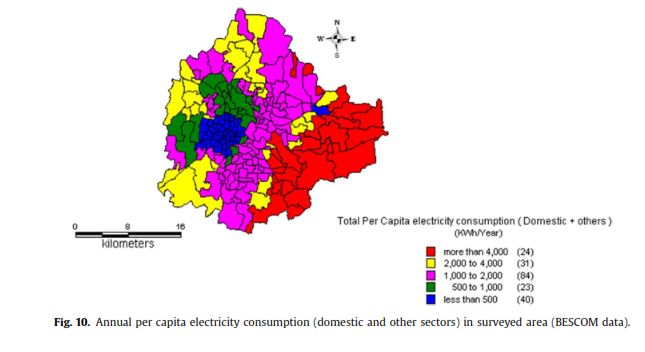
Ward-wise electricity consumption details were compiled for 2011-12 from the respective zonal offices of BESCOM (Bangalore Electricity Supply Company) were synthesized to understand variations across zone considering all sectors shown in Table 4. Fig. 10 reveals that about 40 wards have annual per capita electricity consumption of 500 kWh, 23 wards have consumption of 500-1000 kWh. Majority of wards (84) are in the range of 1000-2000 kWh/person/year, 31 wards have the consumption of 2000-4000 kWh/person/year. A very high consumption of more than 4000 kWh/person/year is in 24 wards of SE Bangalore, mainly due to IT and BT industries and large scale high raise apartments [60]. Per capita annual electricity consumption ranges from 112.16 kWh (Devsandara ward) to 7668.48 kWh (Ejipura ward).
Table 4 Per capita electricity consumption in zones according to BESCOM
Zones |
Minimum |
Maximum |
North |
0 |
1796.00 |
South |
0 |
1902.50 |
East |
0 |
2337.25 |
West |
0 |
13796.50 |
North East |
0 |
750.00 |
North West |
0 |
3252.40 |
South West |
0 |
5718.75 |
South East |
0 |
14849.10 |
LPG is a dominant fuel used in the domestic sectors. The spatial distribution of monthly LPG consumption (Fig. 11) reveals that majority (1499, 76.2%) consumes one cylinder (of 14 kg LPG) per month while 219 samples require 2 cylinders. The average per capita LPG consumption is 15.5 kg/month. Wards like K.R.Puram, Kengeri, Hoskerehalli, JnanaBharathi consumes 2 cylinders of LPG. Zone wise LPG consumption and per capita LPG consumption are listed in Table 5 and 6 respectively. The LPG consumption varies from 181.46±57.94 (W) to 208.75± 97.50 (SE). Per capita annual LPG consumption varies 42.33±20.02 (E) to 54.02±34.76 (SE).
Table 5 Total LPG Consumption (Kg/Year)
Zones |
Minimum |
Maximum |
Mean |
SD |
North |
84 |
504 |
186.40 |
58.42 |
South |
84 |
504 |
183.80 |
57.57 |
East |
42 |
504 |
189.33 |
83.09 |
West |
42 |
504 |
181.46 |
57.94 |
North East |
84 |
336 |
189.78 |
64.20 |
North West |
84 |
336 |
186.47 |
59.86 |
South West |
84 |
504 |
185.27 |
64.58 |
South East |
84 |
504 |
208.75 |
97.50 |
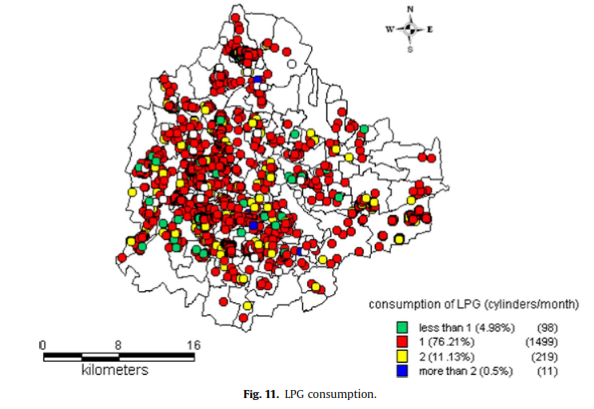
Table 6 Per capita LPG consumption (kg/year)
Zones |
Minimum |
Maximum |
Mean |
SD |
North |
12 |
168 |
45.11 |
20.39 |
South |
14 |
112 |
43.03 |
14.39 |
East |
7 |
126 |
42.33 |
20.02 |
West |
5.09 |
112 |
42.97 |
16.51 |
North East |
21 |
168 |
46.66 |
29.96 |
North West |
12 |
168 |
47.00 |
19.04 |
South West |
12.92 |
168 |
44.09 |
18.87 |
South East |
21 |
168 |
54.02 |
34.76 |
The annual electricity and LPG consumed in each household were aggregated with common energy unit gigajoules (GJ) and was divided by the respective household family size to get the per capita energy consumption. Analysis shows that 767 households consume < 2 GJ/year while 888 households consuming 2-4 GJ/year. The energy consumption ranges from 0.129 GJ/year to 12.39 GJ/year with the average of 2.9±1.4 GJ/year and this is comparable to earlier reports [63].
Fig. 12 reflects the zone wise monthly electricity consumption. E (19.03kWh) and NE (19.41) have average lower per capita monthly electricity consumption compared to SW (31.81 kWh) and SE (30.28 kWh). Fig. 13 represents the seasonal variation of electricity consumption in different zones. Bangalore enjoys tropical climate and this is reflected in season wise household electricity consumption. In summer there is a higher consumption than winter and rainy seasons. In summer per capita electricity consumption is minimum in NE zone (20.41 kWh) and maximum in SW (34.69 kWh), whereas in winter and rainy seasons minimum consumption is 19.02 kWh (E) and 19.75 kWh (NE) respectively and maximum is 33.33 kWh (SW) and 34.56 kWh (SW).
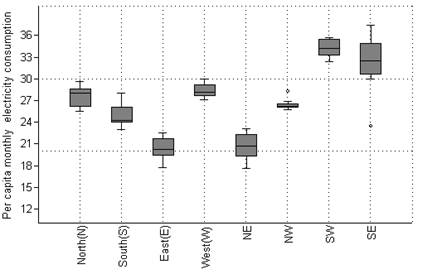
Fig. 12. Per capita monthly electricity consumption in different zones
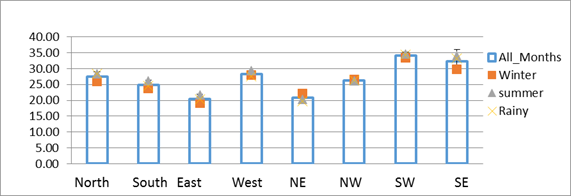
Fig. 13. Seasonal variation in different zones
3.2. Spatial Pattern of Domestic CO2 Emission in Bangalore
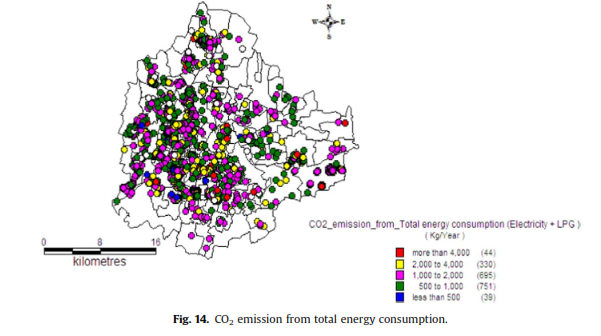
Domestic sector plays major role in the emission of greenhouse gases [11]. An emission due to electricity consumption in the domestic sector is computed as explained earlier in the methods section. CO2 emissions from electricity consumption in 419 households range between 1 to 2 tons/year followed by 379 households with 0.5 to 1 ton/year. 29 households with higher consumption of electricity emit more than 4 tons/year. Similarly, emissions due to LPG consumption is computed and results shows that most of the households (1501 households) have emission ranging between 0.4 to 0.6 tons/year followed by 230 households with 0.6 ton/year. Fig. 14 provides the CO2 emission from total energy (including LPG and electricity), which illustrates that 40% households (751samples) emits between 0.5 to 1tons/year, followed by 37% households (695) emitting 1 to 2 tons/year. 44 households emit more than 4 tons/year.
Based on the survey data, considering the population of the wards, CO2 emission from electricity and LPG are extrapolated for different wards of Greater Bangalore. CO2 emissions from electricity consumption show that majority of the wards (71 wards) emits in the range of 10 to 15 Gg/year while 9 wards in the city center emits more than 20 Gg/year. Wards such as Atturu, Kadugodi located at outskirts of the city emits between 15 to 20 Gg/Year and 16 wards emits less than 4 Gg/Year. The emissions due to electricity consumption in Bangalore is about 11,112 Gg/Year and emission from electricity consumption in domestic sector from the sample of 1907 households is 2246 Gg/Year, which is about 20% of total emission.
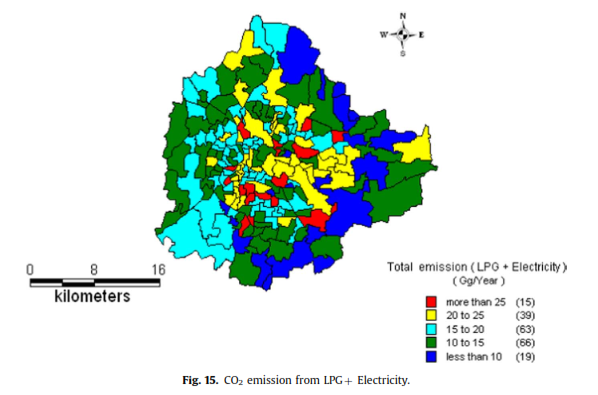
CO2 emission due to LPG consumption (Fig. 15) shows that 48 wards mostly located in the outer zone of the city emits CO2 in the range of 4 to 5 Gg/year. 28 wards emit less (4 Gg/year) and 26 wards in the city center like Chickpet, Shanti Nagar, Vijay Nagar emits CO2 more than 7 Gg/year. Wards such as Nandini layout, Benniganahalli, Shettihalli emits 6 to 7 Gg/year. Fig.15 depicts the total CO2 emission including LPG and Electricity from different wards of Greater Bangalore. Emission from most of the wards (66 wards) ranges between 10 to 15 Gg/year, wards located at city center such as Kacharkanahalli, Vijnanapura, Sarvagana Nagra, Malleswaram have emissions more than 25 Gg/year. Maximum carbon dioxide emission is 46.56 Gg/Year in Sarvagna nagar ward and minimum emission is 3.66 Gg/Year in Konena Agrahara ward. Total carbon dioxide emission from all wards of Greater Bangalore is 3350 Gg/Year.
3.3. Role of socioeconomic factors in residential energy consumption and CO2 emission
Household energy demand and associated carbon emissions depend on many factors, like household size, income levels, attitude towards energy savings which is related to the education level, government policies, etc. Earlier studies have focused on the role of education, family size, climatic parameters on the level of energy consumption in rural area [1] and the role of education on household energy requirement in Australia, Brazil, Denmark, India and Japan [123]. Fig. 16 indicate the decline in per capita LPG as well as electricity consumption with the increase in the number of persons per household and the probable relationship is Y = 9.4007 e-0.266x (r=0.973, p<0.05) comparable to the earlier study [124] comparable to the earlier study where the household size had negative correlation with energy consumption [123]. Family income is a key variable in the household energy consumption intensity [15], evident from Table 7, which illustrate the increase of per capita electricity consumption with the increase in income and the probable relationship is y= -.0002x2+29.287x+2E+06(r= 0.983, p<0.05). A proportional increase in the per capita energy consumption with the family income mainly due to dependence on high level energy services (Fig. 17), which suggests that economic level of a family, is an important parameter in the domestic energy consumption and GHG emissions.
Table 7 Consumption pattern of electricity in the surveyed area of Greater Bangalore
Income catgory |
Electricity Consumption
(KWh/month) |
No of households |
Percent |
Per capita consumption
(KWh/month) |
Income < 100000 |
3482.50 |
156 |
9.0 |
22.32 |
Income (100000 to 500000) |
22617.11 |
816 |
58.6 |
27.72 |
Income (500000 to 10,00000) |
8230.42 |
193 |
21.3 |
42.64 |
Income > 10,00000 |
4284.99 |
92 |
11.1 |
46.58 |
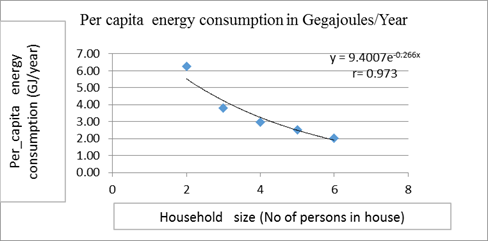
Fig. 16. Relationship between per capita residential energy consumption and household size.
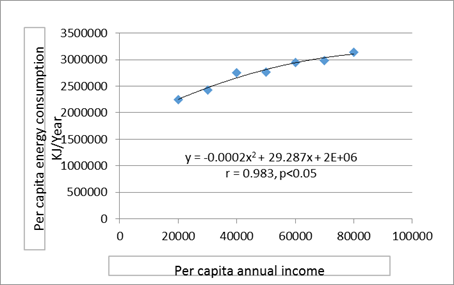
Fig. 17. Per capita income and residential energy consumption
|