|
INTRODUCTION
Energy constitutes a fundamental and strategic tool to attain the minimum quality of life and energy consumption patterns are closely linked to the agro-climatic conditions and socio-economic factors [1, 2]. Recent estimates indicate of sharp escalation in the energy demand, increasing by one-third over the period to 2035 [3]. The study also highlights of an increase of approximately 56% during next two decades of energy demand, which are mainly from the domestic sector (raise from 524 quadrillion Btu in 2010 to 820 quadrillion Btu in 2040 [3]. Exploitation and conversion of natural resources through various energy conversion devices for heating, lighting, etc. have made significant improvement in lifestyles. The dependency of human on energy has increased from 2,500 kJ/day to more than 2 lakh kJ/day. India is the seventh largest geography and ranks fourth among high energy consuming countries in the world with over 1.27 billion population. During past three decades, energy consumption has increased from 18 MTOE (in 1980) to 104 MTOE (2011) in India [4]. The per capita energy consumption is higher in the developed nations (USA-7.3 TOE, Canada- 7.6 TOE, Japan 3.7 TOE) compared to the developing (India- 0.6 TOE, China- 1.8 TOE, Brazil-1.4 TOE) and less developed nations (<0.4 TOE). Energy consumption per capita versus GDP per capita among the countries (Fig. 1) reveals Norway is high in GDP per capita (99,933 million USD) followed by Switzerland (79,024 million USD), Australia (65,430 million USD) and Sweden (55,341 million USD) which shows the effective utilization of energy. The per capita GDP value of India is 1555.50 million USD, which is lowest among these countries. Energy intensity of India is about 0.42 kgoe/million USD which is more than 12 times that of Switzerland (0.033 kgoe/million USD), more than 4 times that of Germany (0.092 kgoe/million USD), more than 3 times that of USA (0.137 kgoe/million USD) and about 1.3 times that of China (0.325 kgoe/million USD) in illustrated in Fig. 2. Most of the Asian countries have high energy intensity (energy/GDP) and lower per capita consumption, which illustrates the inefficient use of energy [5, 6].
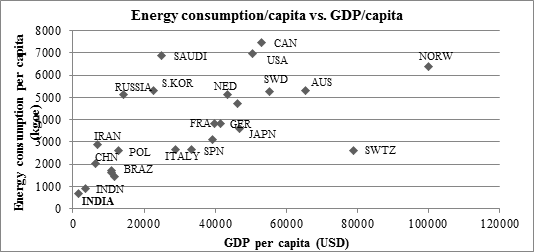
Fig. 1. Country wise energy consumption per capita versus GDP per capita
Fig. 2. Country wise energy consumption per GDP versus GDP per capita
However, over exploitation of natural resources especially fossil fuels for meeting the ever increasing energy demands and unplanned developmental activities has affected the environment and health [7, 8, 9]. Conventional fossil fuels in the form of coal, diesel, petroleum (gasoline) and electricity used by road, rail and air are responsible for emission of 80%, 13% and 6% respectively [10]. Consumption of fossil fuels is the prime reasons for enhanced greenhouse gases (GHG) in the atmosphere trapping heat and light in the earth’s atmosphere, resulting in the global warming. Carbon dioxide (CO2), methane (CH4), nitrous oxide (N2O), hydro fluorocarbons (HFCs), per fluorocarbons (PFCs) and sulfur hexafluoride (SF6) are the major greenhouse gases. Among the GHG’s, carbon dioxide is the most predominant gas causing global warming [11].
In developing countries like India, the urban population is growing at rate of 2.3% per annum and global urban population is increasing from 220 million in 1900 to 3.2 billion in 2005 and is projected to step up to 4.9 billion by 2030 [11]. In terms of the global total anthropogenic GHG emission, cities contribute roughly 75– 80% and the domestic sector is one of the major energy consumer in cities [10]. Assessment of GHG footprint (Aggregation of Carbon dioxide equivalent emissions of GHG’s) across major cities in India reveals of emissions to the tune of 38633.2 Gg, 22783.08 Gg, 14812.10 Gg, 22090.55 Gg, 19796.5 Gg, 13734.59 Gg and 9124.45 Gg CO2 eq respectively in Delhi, Greater Mumbai, Kolkata, Chennai, Greater Bangalore, Hyderabad and Ahmedabad. Sector-wise synthesis indicate that transportation sector (contributing 32%, 17.4%, 13.3%, 19.5%, 43.5%, 56.86% and 25%), domestic sector (contributing 30.26%, 37.2%, 42.78%, 39%, 21.6%, 17.05% and 27.9%) and industrial sector (contributing 7.9%, 7.9%, 17.66%, 20.25%, 12.31%, 11.38% and 22.41%) of the total emissions in Delhi, Greater Mumbai, Kolkata, Chennai, Greater Bangalore, Hyderabad and Ahmedabad respectively [11]. Macro level analyses emphasized the need for detailed investigations to major sectors such as transportation [10] and domestic sectors.
This communication focusses on the GHG emissions due to energy consumption in the domestic sector considering household activities and socioeconomic parameters. Domestic energy consumption has various interrelated characteristics (ex. regional climate, building architecture, etc.). During the last decade, empirical studies have been receiving good attention in terms of domestic consumption and have included factors that are economical important such as fuel prices and economic stability [12] and variants of analytical techniques [13]. Most of these studies use aggregated time series data, and only a few research involves household-level data [14]. In India, these studies are limited [15] focusing on household socio-economic, demographic, geographic factors role in energy consumption. Estimation of residential energy demand in Seoul [16] based on 380 household samples revealed that the energy consumption pattern depends on the variables such as size of a house [17, 18], family size, level of affluence, etc. [13, 19, 20].
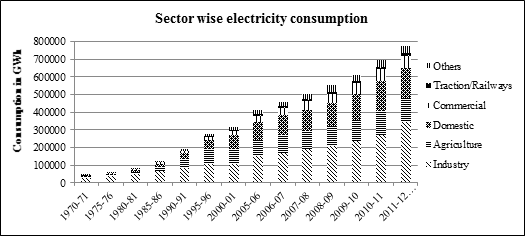
Urban areas support 50% of the world population and are responsible for 67% of the world’s energy demand and these region are under acute problem of energy consumption and GHG emissions [21]. It is estimated that by 2030, 73% of the world energy use will be in cities [22]. Urban households in India, for example, are responsible for about 45% of total primary energy use nationwide [23]. The sector wise temporal electric energy consumption in India (Fig. 3) shows that the industries sector is the highest consumption with 44.8%, followed by agriculture (17.3%), domestic (22%) and commercial sector (9%) [24]. Socio-economic growth coupled with urbanization, industrialization and burgeoning population lead to increase in the residential energy consumption for heating, lighting, electric appliances in many towns and cities in India [10] and the increase in energy demand is proportional with the urban growth [25]. Energy is required for heating, lighting, and motive power (to pump water, compressors, etc.) in the urban domestic sector and the increase in energy consumption in recent times has necessitated studies on carbon emissions due to energy consumption [26, 27], in the residential sector [28, 29]. The looming threat of climate change, urban household energy consumption and GHG emission have become a focus of investigations [30] for evolving appropriate adaptive and mitigation strategies to reduce warming of the Earth [31]
In this backdrop, the current communication examines the household energy consumption and CO2 emission in Bangalore city, Silicon Valley of India. Bangalore has been experiencing rapid unplanned urbanisation since 1990 resulting in the clumped growth with intense economic activities at some pockets and dispersed (sprawl) growth at outskirts. Circumstantial evidences show that some wards have higher energy consumption and CO2 emission than others, but an understanding of the spatial patterns is yet to be acquired. Thus, the objectives of the current research are to 1) analyze the spatial patterns carbon dioxide emission due to energy (electricity and LPG) consumption in the residential sector; and 2) assess the effect of socioeconomic factors such as household size, income level on the energy consumption and emission.
|