Results and Discussion
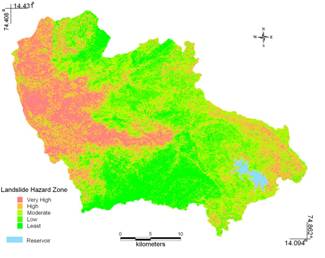
Frequency ratio computed for related factors are listed in Table 2. With high intensity rainfall, slope in the range of 35º to 45º with convex curvature, south and south–west aspect, land uses like barren or agricultural or built up and geological aspects such as metamorphic rocks (migmatites and granodiorite - tonalitic gneiss, laterite, and quartz chlorite schist with orthoquartzite) or residual capping or unconsolidated sediments are highly susceptible to landslides. LSI values computed were classified into five classes (Very high, High, Moderate, Low and Least) based the degree of vulnerability are listed in Table 3 and LHS map is given in Fig. 3. Higher values (14.39 % of study area) of LSI indicate higher probability of landslide occurrences (which coincides with the field data of latest occurrences). Validation of LHS map, showed an accuracy of 89% as 25 of the 28 regions tallied with the field data of highly vulnerable landslides.
Fig 3 : LHS map for Sharavathi Down stream using Frequency ratio

Table 3 : LHS for the downstream of Sharavathi river basin
Category |
LSI |
Spatial Coverage |
Validation Accuracy |
Very high |
18.3-27.8 |
14.39% |
89% |
High |
14.9-18.3 |
21%, |
|
Moderate |
12.3-14.9 |
27.98% |
|
Low |
10.1-12.3 |
22.54% |
|
least |
5.3-10.1 |
14.09 |
|
Conclusion
Frequency ratio method based mapping of landslide for Sharavathi river downstream show that 14.39% of the study area is very highly susceptible to landslide and 14.09% of the area being very safe or least prone to landslide. The validation of the LHS map generated had an agreement of 89% between the susceptibility map and the field data.

