
METHOD
Method adopted for landslide susceptibility analysis is given in Fig 2. Field investigations were carried out in the Sharavathi river basin located in central Western Ghats. Major components of the study are:
1. Identification of causal variables : Review of literature indicates the major causal variables are: topographical (aspect, slope, curvature, drainage network), geo-morphological (lineament, genesis), lithological (lithology, soil texture, soil permeability and soil depth), infrastructure (road network, location of buildings), land cover (NDVI), land-use (agriculture, waterbodies, forests, built-up, barren land). Field surveys were carried out of landslide spots (temporal as well as latest ones), attribute data of training polygons of land use analysis using pre-calibrated GPS.
Fig 2 : Flow chart of landslide susceptibility analysis
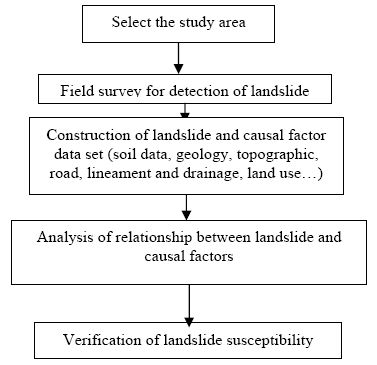
Table 1: Spatial data |
|||
Classification |
Sub-classification |
Data Type |
Scale |
Base layers |
Topographic |
Lines and points |
1:50000 |
|
Geological |
Lines and polygons |
1:250,000 |
|
Soil |
Polygon |
1:250,000 |
|
Elevation |
GRID (SRTM) |
90m x 90m |
Remote sensing data |
Land cover |
GRID (IRS-1D) |
23.5m x 23.5m |
|
Rainfall |
Points |
Taluk level |
Geological Hazard |
Landslide |
Points |
|
2. Creation of base layers of spatial data – soil, geology, topography, geo-morphology, land use, etc. These information were collected from the respective government agencies and supplemented with the remote sensing data and other spatial layers. Indian Remote Sensing (IRS) 1C/1D satellite, LISS III (linear imaging self scanner) data of spatial resolution 23.5 m (acquired during Nov 2004), of bands 2, 3 and 4 (corresponding to G, R and IR bands of electro magnetic spectrum) were used for land use and land cover (NDVI) analysis. Supervised classification using Gaussian maximum likelihood classifier was carried out for deriving seven land use categories- agricultural, barren land, built up, moist deciduous forest, plantation, semi-evergreen forest and water body. Road and drainage networks with administrative boundaries were digitised from Survey of India (SOI) topographic maps (1:50,000 scale). Soil types and spatial extent were digitised from the soil map of National Bureau of Soil Sampling and land use planning (NBSS& LUP) of 1:250,000 scale. From this, texture, depth and permeability were derived. Spatial data with type are listed in Table 1.
Geomorphological variables such as lithology, lineament, rock type were extracted from geological and structural maps of Geological Survey of India (1:250,000 scale). Shuttle radar topographic mapping (SRTM 3 arc-sec) of 90 m resolution was used to derive layers of slope, aspect and curvature. This constitutes predisposing factors for the landslide activity.
Slope was classified into 10 classes. Aspect represents the angle between the geographic north and a horizontal plain for a certain point. This was classified in eight major orientations (N, NE, E, SE, S, SW, W, NW). The curvature controls the superficial and subsurface hydrological regime of the slope and the classes considered are concave, flat and convex slope areas, which were directly derived from the DEM.
The distance from drainage and road was calculated using the vectorised drainage and road from the topographical sheets of scale 1:50,000. The drainage and road buffer was calculated at 90 m intervals. The lithology and genesis was extracted from the available geology map prepared by the Geological Survey of India (GSI). In addition the lineament database from GSI, was used to create distance from lineaments map. The lineament buffer was calculated at 90 m intervals.
3. Development of spatial database : Considering the spatial resolution of the data available, all data layers were resampled to 90 m. Landslides (both latest and earlier ones) corresponding to 120 occurrences were used for computing LSI as well as for sensitivity analysis.
4. Frequency ratio : Frequency ratio is the ratio of occurrence of probability to non-occurrence probability, for specific attributes. In the case of landslides; if landslide occurrence event is set to B and the specific factor’s attribute to D, the frequency ratio for D is a ratio of conditional probability. If the ratio is greater than 1, greater is the relationship between a landslide and the specific factor’s attribute; and if the ratio is less than 1, the lower the relationship between a landslide and the specific factor’s attribute.
5. Computation of Landslide Susceptibility Index (LSI) : Landslide Susceptibility Index (LSI) is the summation of each factor’s frequency ratio values as in Eq. 1. Landslide susceptibility value represents the relative hazard to landslide occurrence, as higher values are associated with landslide hazards.

(where, LSI: Landslide Susceptibility Index; Fr: rating of each factor’s type or range). The landslide hazard map was made using the LSI values.
Table 2 : Frequency ratio – Spatial relationship between landslides and related factors
Factors with domain |
No of pixels in domain |
No of landslide |
% of domain |
% of landslide |
Frequency ratio |
||||
Aspect |
|||||||||
South |
15924 |
24 |
0.135 |
0.261 |
1.939 |
||||
South-West |
16018 |
13 |
0.135 |
0.141 |
1.044 |
||||
North-West |
16308 |
13 |
0.138 |
0.141 |
1.026 |
||||
North-East |
13337 |
11 |
0.113 |
0.120 |
1.061 |
||||
South-East |
12758 |
12 |
0.108 |
0.130 |
1.210 |
||||
West |
16085 |
5 |
0.136 |
0.054 |
0.400 |
||||
East |
11159 |
6 |
0.094 |
0.065 |
0.692 |
||||
North |
16795 |
8 |
0.142 |
0.087 |
0.613 |
||||
Land use |
|||||||||
Agriculture land |
25933 |
40 |
0.219 |
0.435 |
1.985 |
||||
Barren Land |
4536 |
6 |
0.038 |
0.065 |
1.702 |
||||
Builtup |
1145 |
2 |
0.010 |
0.022 |
2.248 |
||||
Moist Deciduous Forest |
32271 |
9 |
0.273 |
0.098 |
0.359 |
||||
Plantation |
3877 |
0 |
0.033 |
0.000 |
0.000 |
||||
Semi-Evergreen Forest |
45460 |
35 |
0.384 |
0.380 |
0.991 |
||||
Water body |
5162 |
0 |
0.044 |
0.000 |
0.000 |
||||
Topographic curvature |
|||||||||
Convex |
95956 |
77 |
0.811 |
0.837 |
1.033 |
||||
Concave |
22428 |
15 |
0.189 |
0.163 |
0.861 |
||||
Distance from Drainage (m) |
|||||||||
Buffer 90 |
65833 |
30 |
0.5561 |
0.3261 |
0.5864 |
||||
Buffer 180 |
32190 |
34 |
0.2719 |
0.3696 |
1.3591 |
||||
Buffer -270 |
11125 |
22 |
0.0940 |
0.2391 |
2.5446 |
||||
Buffer 360 |
4513 |
5 |
0.0381 |
0.0543 |
1.4256 |
||||
Buffer 450 |
2074 |
0 |
0.0175 |
0.0000 |
0.0000 |
||||
Buffer 540 |
1073 |
0 |
0.0091 |
0.0000 |
0.0000 |
||||
Buffer 630 |
583 |
1 |
0.0049 |
0.0109 |
2.2072 |
||||
Buffer 630< |
993 |
0 |
0.0084 |
0.0000 |
0.0000 |
||||
Rock type |
|||||||||
Plutonic rocks |
8674 |
0 |
0.073 |
0.000 |
0.000 |
||||
Metamorphic rocks |
51253 |
55 |
0.433 |
0.598 |
1.381 |
||||
Residual capping |
32837 |
33 |
0.277 |
0.359 |
1.293 |
||||
Unconsolidated sediments. |
735 |
1 |
0.006 |
0.011 |
1.751 |
||||
Volcanics / Meta volcanics |
24885 |
3 |
0.210 |
0.033 |
0.155 |
||||
Lithologic unit |
|||||||||
Grey granite |
8675 |
0 |
0.073 |
0.000 |
0.000 |
||||
Migmatites and granodiorite - tonalitic gneiss |
31698 |
38 |
0.268 |
0.413 |
1.543 |
||||
Laterite |
32836 |
33 |
0.277 |
0.359 |
1.293 |
||||
Alluvium / beach sand, alluvial soil |
735 |
1 |
0.006 |
0.011 |
1.751 |
||||
Greywacke / argillite |
16343 |
11 |
0.138 |
0.120 |
0.866 |
||||
Metabasalt & tuff |
24885 |
3 |
0.210 |
0.033 |
0.155 |
||||
Quartz chlorite schist with orthoquartzite |
3212 |
6 |
0.027 |
0.065 |
2.404 |
||||
Limeament (m) |
|||||||||
Buffer 90 |
9028 |
5 |
0.076 |
0.054 |
0.713 |
||||
Buffer 180 |
10145 |
7 |
0.086 |
0.076 |
0.888 |
||||
Buffer 270 |
10509 |
14 |
0.089 |
0.152 |
1.714 |
||||
Buffer 360 |
10387 |
4 |
0.088 |
0.043 |
0.496 |
||||
Buffer 450 |
9720 |
4 |
0.082 |
0.043 |
0.530 |
||||
Buffer 540 |
8911 |
2 |
0.075 |
0.022 |
0.289 |
||||
Buffer 630 |
8038 |
4 |
0.068 |
0.043 |
0.640 |
||||
Buffer 720 |
7001 |
3 |
0.059 |
0.033 |
0.551 |
||||
Buffer 810 |
6184 |
5 |
0.052 |
0.054 |
1.040 |
||||
Buffer 900 |
5345 |
5 |
0.045 |
0.054 |
1.204 |
||||
Buffer 900< |
33116 |
39 |
0.280 |
0.424 |
1.515 |
||||
NDVI |
|||||||||
<=-0.5 |
192 |
0 |
0.002 |
0.000 |
0.000 |
||||
>0.5 |
47954 |
57 |
0.405 |
0.620 |
1.530 |
||||
>10^-7 and <=0.5 |
62070 |
33 |
0.524 |
0.359 |
0.684 |
||||
>-0.5 and <=-10^-7 |
8168 |
2 |
0.069 |
0.022 |
0.315 |
||||
Slope (degree) |
|||||||||
0-5 |
534 |
0 |
0.005 |
0.000 |
0.000 |
||||
5-10 |
1369 |
0 |
0.012 |
0.000 |
0.000 |
||||
10-15 |
1647 |
4 |
0.014 |
0.043 |
3.125 |
||||
15-20 |
1798 |
0 |
0.015 |
0.000 |
0.000 |
||||
20-25 |
2162 |
3 |
0.018 |
0.033 |
1.786 |
||||
25-30 |
2647 |
10 |
0.022 |
0.109 |
4.861 |
||||
30-35 |
2476 |
1 |
0.021 |
0.011 |
0.520 |
||||
35-40 |
2837 |
10 |
0.024 |
0.109 |
4.536 |
||||
40-45 |
3782 |
14 |
0.032 |
0.152 |
4.763 |
||||
45-90 |
99226 |
50 |
0.838 |
0.543 |
0.648 |
||||
Soil depth |
|||||||||
Moderately shallow |
21094 |
40 |
0.178 |
0.435 |
2.440 |
||||
Deep |
71508 |
49 |
0.604 |
0.533 |
0.882 |
||||
Very deep |
22732 |
2 |
0.192 |
0.022 |
0.113 |
||||
Moderately deep |
3050 |
1 |
0.026 |
0.011 |
0.422 |
||||
Soil permability |
|||||||||
Somewhat excessively drained |
11104 |
17 |
0.094 |
0.185 |
1.970 |
||||
Imperfectely drained |
12740 |
15 |
0.108 |
0.163 |
1.515 |
||||
Well drained |
94540 |
60 |
0.799 |
0.652 |
0.817 |
||||
Soil texture |
|||||||||
Sandy |
895 |
0 |
0.008 |
0.000 |
0.000 |
||||
Clayey |
45088 |
15 |
0.381 |
0.163 |
0.428 |
||||
Clayey-skeletal |
60556 |
57 |
0.512 |
0.620 |
1.211 |
||||
Sandy loamy |
11845 |
20 |
0.100 |
0.217 |
2.173 |
||||
Distance form road(m) |
|
|
|
||||||
Buffer 90 |
16992 |
74 |
0.131 |
0.804 |
6.144 |
||||
Buffer 180 |
14707 |
9 |
0.113 |
0.098 |
0.863 |
||||
Buffer 270 |
12278 |
3 |
0.095 |
0.033 |
0.345 |
||||
Buffer 360 |
10279 |
1 |
0.079 |
0.011 |
0.137 |
||||
Buffer 450 |
8606 |
2 |
0.066 |
0.022 |
0.328 |
||||
Buffer 540 |
7256 |
1 |
0.056 |
0.011 |
0.194 |
||||
Buffer 630 |
5108 |
0 |
0.043 |
0.000 |
0.000 |
||||
Buffer 720 |
6295 |
0 |
0.053 |
0.000 |
0.000 |
||||
Buffer 810 |
4348 |
1 |
0.034 |
0.011 |
0.324 |
||||
Buffer 810< |
32515 |
1 |
0.251 |
0.011 |
0.043 |
||||
