| Previous Session | Paper 1 | Paper 2 | Paper 3 | Paper 4 | Paper 5 | Paper 6 | Paper 7 | Paper 8 | Next Session |
SESSION-15 : Geographic Information System (GIS), and Remote Sensing
PAPER-2: Landuse / Landcover Change Detection: Why and How?
An Overview Using Aids of Geoinformatics and Image Processing
Afsari Jaan* & M.R.Vijaindra**
CONTENTS-
Abstract
Introduction
Brief Description of Study Area
Objective
Methodology
Results
Conclusion
Acknowledgement
Bibliography
| Abstract | up | previous | next | last |
Landuse and landcover are two different aspects of land, which are spatial in nature and accredit to describe the multi-temporal changes in various facets of the lithosphere and hydrosphere. In this paper an attempt is made to present the need for change detection in regional and infrastructure planning. Digital Image Processing and Geographic Information System have been used as tools to derive fast and accurate results for immediate application. The conventional maps are very old and consume a colossal amount of time, money and manpower for preparation, and their updating is a big hassle, which involves extensive field survey, men and money. When the map comes to planning table for recommendation the scenario in reality would have changed giving way to only piecemeal implementation. Here the satellite data with temporal resolution acts as a boon providing instant information, which is true, explicit and un-tampered. When the information is processed to the desired need, it gives near perfect information depending on the resolution of the sensor, which decides the clarity of the imagery. A brief account of various techniques of change detection and some examples of practical implementation is cited with an action plan, which can be implemented to any big city.
| Introduction | up | previous | next | last |
The urban land cover scenario is continuously undergoing changes in its structure and has been the reason of deep concern to the urban planners and decision-makers. The main contributor to the urban change is the steady increase in the urban population that mainly includes the migration from small towns and rural areas which by far is the main factor of the ever increasing land costs and slum proliferation in the urban areas and illegal occupation of government land and protected forest cover by migrants and greedy construction companies. One arrives at a conclusion that these changes are happening fast and the methods to curtail them or nip them in the bud are not happening which is not true at all. There is lack of awareness among people regarding new technology due to which they resort to age old methods of problem identification and irradiation that takes a lot of time and money and not to forget heavy manpower and to make all these factors work in a single smooth fashion is just another problem, there are hitches and hurdles in conventional surveys and ground truthing. By the time all the information is collected and a action plan is developed the ground reality would have changed so much that the plan does not stand any chance of success. This is one of the major problems, which most of the Government machineries and various other organisations are facing today.
Remote Sensing Technology is a tool, which identifies the problem instantly and provides the planners and decision makers with ample time to find solution for it and monitor it, so that such type of problems do not surface again. The remote sensing data being repetitive, is useful in providing information on physical growth pattern, development trends of urban areas, changes in landuse pattern etc., which will help the administrators to formulate developmental plans, guidelines for maintaining the environment and the quality of life.
Geographic information system is another facet of advanced technology where the entire urban area can be regenerated on the computer monitor with all the information of the urban area fed in to it from various sources with the biggest advantage of regular updation and intelligent queries which, can help solve many crisis situations and provide instant information about any aspect on a precondition that the data is fed to it beforehand. The use of modern technology can really make a serious change towards the betterment of the urban scene. The details to go about are as follows:
1. Remote Sensing
2. Digital Image Processing
3. Geographic Information System
REMOTE SENSING
Remote sensing is the art and science of obtaining information about an object, area, or phenomenon through the analysis of data acquired by a device that is not in contact with the object, area, or phenomenon under investigation. Using various sensors, we remotely collect data that may be analysed to obtain information about the objects, areas, or phenomenon being investigated. The remotely collected data can be of many forms, including variations in force distributions, acoustic wave distributions, or electromagnetic energy distributions.
Electromagnetic energy (Figure 1) sensors that are currently being operated from airborne and space borne platforms assist in inventorying, mapping, and monitoring earth resources. These sensors acquire data in the way various earth surface features emit and reflect electromagnetic energy, and these data are analysed to provide information about the resources under investigation.
The two basic processes involved in electromagnetic remote sensing of the earth resources are data acquisition and data analysis. The elements of the data acquisition process are energy sources:
• Propagation of energy through the atmosphere
• Energy interactions with earth surface features
• Retransmission of energy through the atmosphere
• Airborne or space borne sensors
• Generation of sensor data in pictorial or digital form
• In short, we use sensors to record variations in the way earth surface features reflect and emit electromagnetic energy.
The data analysis process involves:
• Examining the data using various viewing and interpretation devices to analyse pictorial data or a computer to analyse digital sensor data. Reference data about the resource being studied are used when and where available to assist in the data analysis. With the aid of reference data, the analyst extracts information about the type, extent, location, and condition of the various resources over which the sensor data were collected.
• This information is then compiled generally in the form of hard copy maps and tables or as computer files that can be merged with other layers of information in a geographic information system. Finally the information is made available to users who apply it to their decision- making process (Figure1).
In remote sensing, a sensor is a device used to record the reflected electromagnetic radiation from the objects on the earth's surface. The sensor converts these radiations into electrical signals. In the design of an optimal remote sensor, an ideal set of system parameters is an essential requisite. In a multispectral sensor system, these parameters have strong interrelationships with one another. The specific parameters are discussed here:
Spatial resolution: The minimum detectable area on the ground by a detector placed on a sensor is called spatial resolution. Generally, the spatial resolution is understood as the projection of a detector element on the ground. The swath' is a related feature of spatial resolution and IFOV of a sensor, which can be explained as the width of a strip of a terrain recorded by a sensor.
Spectral resolution: The smallest amount of spectral change that can be detected by a sensor is called the spectral resolution. It is the function of location and breadth of the wavelength region. The finer the spectral channels, the better is the spectral resolution, and therefore, the satellite data recorded in the narrow spectral bands are extremely useful for natural resource surveys and mapping
Radiometric resolution: The presence of gray levels defines the radiometric resolution. More the gray levels more is the radiometric resolution.
Temporal resolution: The temporal resolution is characterised by the smaller period of repetitive coverage.
The reflectance / emittance of any object at different wavelengths follow a pattern, which is characteristic of that object known as spectral signature. Proper interpretation of the spectral signature leads to the identification of the object. It is therefore very important to select the images taken in the proper spectral band so that optimum information can be extracted from the images.
The spectral band selection depends upon the following three aspects:
• The location of the central wavelength.
• The bandwidth.
• The total number of bands.
For the study of urban region 0.4-1.0 micrometer, 7-12 micrometer and 3-100 millimeter range of wavelength is considered very useful and informative.
In remote sensing, the acquisition of data depends on the sensor system used. Various remote sensing platforms are equipped with different sensor system. Sensor is a device that receives electromagnetic radiation, converts it into a signal and presents it in a form suitable for obtaining information about the land or earth resources as used by an information gathering system.
Sensors can be grouped, either on the basis of energy source or on the basis of wave band employed. Based on energy source sensors are classified in to two types.
Active sensors operate by emitting own energy, which is needed to detect the various phenomenon. .
Passive sensors operate on the existing sources of energy, like sun (e.g., photographic systems, and multispectral scanners).
Digital image processing involves the manipulation and interpretation of digital images with the aid of a computer. This form of remote sensing actually began in 1960's with a limited number of researchers analysing airborne multi-spectral scanner data and digitised aerial photographs. The central idea behind image processing is quite simple. The digital image is fed in to a computer, one pixel at a time. The computer is programmed to insert these data in to an equation, and then store the results of the computation for each pixel. These results form a new digital image that may be displayed or recorded in pictorial format or other programs further manipulate it. The possible forms of digital image manipulation are literally infinite.
These operations aim to correct distorted image data to create a more faithful representation of the original scene. This mainly involves the initial processing of raw image data to correct for geometric distortions, to calibrate the data radiometrically, and to eliminate noise present in the data. Thus, the nature of any particular image restoration process is highly dependent upon the characteristics of the sensor used to acquire the image data. This is often termed as pre-processing operations because they normally precede further manipulation and analysis of the image data to extract specific information.
The goal of image enhancement is to improve the visual interpretability of an image by increasing the apparent distinction between the features in the scene. The process of visually interpreting digitally enhanced imagery attempts to optimise the complementary abilities of the human mind and the computer. The mind is excellent at interpreting spatial attributes on an image and is capable of selectively identifying obscure or subtle features. However, the eye is poor at discriminating the slight radiometric or spectral differences that may characterise such features. Computer enhancement aims to visually amplify these slight differences to make them readily observable. The range of possible image enhancement and display options available to the image analyst is virtually limitless. Most enhancement techniques may be categorised as either point or local operations. Point operators modify the brightness value of each pixel in an image data set independently. Local operations modify the value of each pixel based on neighbouring brightness value. Either form of enhancement can be performed on single band images or on the individual components of multi-image composites. The resulting images may also be recorded or displayed in black and white or in colour. Choosing the appropriate enhancements for any particular application is an art and often a matter of personal preference. Enhancement operations are normally applied to image data after appropriate image restoration procedures have been performed. Noise removal, in particular, is an important precursor to most enhancements. Without, the image interpreter is left with the prospect of analysing enhanced noise!
Change detection involves the use of multi-temporal data sets to discriminate areas of land cover change between dates of imaging. The type of changes that might be of interest can range from urban fringe development to institutional desertification. Ideally, change detection procedure should have data acquired by same sensor and be recorded using same resolution, viewing geometry, spectral bands, and time of day. Often anniversary dates are used to minimise the sun angle and seasonal difference. Accurate spatial registration is very important in effective change detection. Methods to discriminate change are:
Post Classification Comparison :
In this method two sets of imagery of different dates are independently classified and registered. Then an algorithm can be employed to determine those pixels with a change in classification between dates of images. The accuracy depends on the individual classified images. The error present in the individual classified images gets compounded in the change detection process.
Classification of Multi-temporal Datasets :
A single classification is performed on a combined dataset for the two dates of interest. Supervised or unsupervised classification is used to categorise the land cover classes in the combined image. The success of such efforts depends upon the extent to which change class are significantly different spectrally from the no change classes.
Temporal Image Differencing :
In this procedure DN's from one date are simply subtracted from those of the other. The difference in areas of no change will be very small, and areas of change will manifest larger negative or positive values.
Temporal Image ratio :
This involves computing the ratio of the data from two dates of imaging. Ratios for areas of no change tend toward 1 and areas of change will have higher or lower ratio values.
No matter which technique is employed the analyst must find a meaningful change-no change threshold within the data. A small scale study has been carried out on a small part of the Ranchi City area to see the changes in the region over a period from 1929 to 1999, using toposheet and satellite images.
| Brief Description of Study Area | up | previous | next | last |
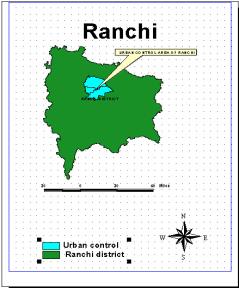
Ranchi is the capital of the newly formed state of Jharkhand, which is situated on the central plateau with its cartesian coordinates between 23 ° 23' North latitude to 25 ° 23' East longitude with an altitude of 2128 feet above mean sea level (Figure 2). Over a period of time there has been the merger of the urban rural fringe area with the increasing urban stretch of buildings and speculative sites, which are currently witnessing the glory of high-rise apartment houses and mini malls. This change can be due to the new status of the city as a political as well as educational capital of Jharkhand state. For the city a five-kilometer radius circular buffer was created along the city center so that the changes can be emphasised.
The main objectives of study were as follows:
1. To create a land use layer of 1975 toposheet on a scale of 1:50,000. So, the change in the landuse can be assessed when compared with satellite imagery.
2. To interpret a panchromatic and LISS III merged image visually to see the change in the urban landuse.
3. To bring out the use of digital image processing and GIS in change detection
DATA USED
The data inputs for the study are toposheet of 1975 prepared by the Survey of India, Number 73 E/7, surveyed in 1972 (FIG-3). The satellite images, the single band panchromatic imagery and LISS III image used were recorded in the month of March 1998, (Figure 5).
LIMITATIONS OF STUDY
As stated earlier the study has been restricted to the buffer around the Ranchi city. The satellite data has been used only to notice the visible change in the spread of urban domain. So that the direction of sprawl of the city can be known and the reasons for it can be understood. There were also limitations on collecting secondary data for analysis. Time constraint was an unavoidable limitation.
| Methodology | up | previous | next | last |
The LISS and PAN images were geometrically rectified and geo-coded with the RMS error within the accepted level and then merged. The toposheet 73E/7 was scanned in Magic scan software and geo-coded. All geocoding was done in ERDAS Imagine software.
Firstly, the buffer was created on the topo-sheet in Arc view 3.1-version software and then the various vector layers were created to produce a broad level landuse class layer.
Secondly, on line visual interpretation was done on the LISS and PAN merged satellite image to create vector layers so as to know the urban landuse change. The accuracy of visual interpretation is based on field survey carried out (Figure 4).
| Results | up | previous | next | last |
1. There is a noticeable change in the urban landuse from 1975 to 1998. The urban area has steadily increased. A new settlement has come up close to the HEC housing colony.
2. An airport has been built.
3. The number of tanks has reduced relatively.
4. The extent of area, which could have been put to agricultural use, has reduced over a period of twenty-three years.
Science alone could solve the problems of hunger and poverty, instantiation and illiteracy, of superstition and deadening customs, of vast resources running to waste, of a rich country inhabited by starving people. The future belongs to science and those who make friends with science. -Jawaharlal Nehru
These were the words of the late Prime Minister of our country. He had long ago signified the importance of advanced science and technology. The change of the CBD (central business district) over the decades of any primate city of the world is noticeable. Though the cause of change in the occupational structure, spatial utility of the built-up urban space, the metamorphosis of transport and communication system with the inception of light rail, trams, underground trains, motor vehicles have changed the shape and extent of urban regions over the years. To develop a general plan applicable to the current cities is not an easy task though an attempt has been made. The features are as follows:
• All the current cities have a trend of growing fast and amalgamating with the surrounding fringe area between the urban city and its surrounding rural peripherals. Remote sensing can monitor this growth and proper planning can be undertaken for a systematic growth along the fringe.
• The problems of unauthorised colonies, encroachments, violation of municipal laws, situation before demolition of structure, census of slum dwelling can be handled efficiently and accurately without any manipulation by high resolution data in a matter of few days which if done in the old ways would take months altogether and by the time a decision is made the ground realities will be altogether different.
• The monitoring of traffic flow and solving the problems of traffic jams can be done effectively through the process of active monitoring through satellites and GPS systems.
| Conclusion | up | previous | next | last |
The process of urban planning has broken the shackles of conventional survey and tedious field work to effective use of various types of remote sensing let it be aerial photographs, satellite images, or global positioning system. All these tools of modern technology have helped to make the decision-making and action implementation process instantaneous and leading to effective results, which have proven the use of remote sensing in the field of urban planning.
We would like to thank Dr. M.S. Nathawat of Department of Remote Sensing, BIT- Ranchi, for his help and guidance.
| Bibliography | up | previous | next | last |
• Remote Sensing and Image Interpretation, third edition- Lillisand and Kiefer
• National Seminar on the challenges for development of urban areas -Dec 6th to 8th, 2001 held at BIT Mesra, Ranchi
• Land information system physical inputs to planning- Oct. 4th, 1985 held at New Delhi
• Journal of the Indian society of remote sensing, vol-17, Sept 1989
• Textbooks on remote sensing- C.S. Agarwal and P.K. Garg
| Address: | up | previous |
* Dept. Of Geography, Bangalore University
** Dept. Of Remote Sensing, Birla Institute Of Technology
Phone: 5561128
E mail: mrvijaindra@yahoo.co.in