| Previous Session | Paper 1 | Paper 2 | Paper 3 | Paper 4 | Paper 5 | Paper 6 | Paper 7 | Paper 8 | Next Session |
SESSION-15 : Geographic Information System (GIS), and Remote Sensing
PAPER-1: Rainfall Information System of Karnataka to Analyse Causes in its Change
and Monitor Using Remote Sensing and GIS
Vijaindra M.R.* & Afsari Jan**
CONTENTS-
Abstract
Introduction
Study Area
Objectives
Methodology
Results
Suggestions to the Primary Sector
Conclusions
Acknowledgements
| Abstract | up | previous | next | last |
This paper deals with IRS P4 satellite data (ocean colour Monitor), which covers whole of Karnataka. The swath of the satellite is 1420 km. The data for 2000 and 2001 was used to make a comparative study to understand change in total rainfall and its distribution. As geographers we have tried to give some answers to this change in rainfall pattern.
A rainfall information system for Karnataka was created using Arc view and Arcinfo softwares. The district-wise rainfall database for both the years were created for performing various spatial queries. This digital database is compatible and can be updated at regular intervals providing a sequential dataset for modeling process and observing the rainfall process and monitoring it. Various suggestions have been given to the primary sector, which will lead to more utilisation of the rainwater and reduce runoff, which also depletes the surface soil in poorly vegetated stretches. Image processing has been used to find the vegetative cover in both the years so that the variations can be understood and the causes identified. This basically is an example as to how GIS can be used in different fields to extract the type of output desired. Noticeable change in the rainfall data showed the unpredictability of monsoons.
| Introduction | up | previous | next | last |
The use of Digital Image Processing and Geographic Information System has been done to show the variation in the rainfall distribution of the years 2000 and 2001 for the state of Karnataka. The results have proved that the analysis can be done over the vast area of Karnataka with an accuracy of more than 80% . With in a time period of a week the satellite data was processed which has shown the area of high and low vegetative growth. The use of spatial data relating to rainfall of both the years (2000 and 2001) has been used to create a GIS layer for this region. The details of the study area are as follows.
| Study Area | up | previous | next | last |
Situated on a tableland where the Western and Eastern Ghat ranges converge into the Nilgiri hill complex, the state of Karnataka is confined roughly within 11.5 ° and 18.5 ° North latitudes and 74 ° and 78.5 ° East longitude. The state is bound by Maharashtra and Goa in the north and northwest; by the Arabian sea in the west; by Kerala and Tamilnadu in the South and by Andhra Pradesh in the east. The state extends to about 750 km from north to south and about 400 km from east to west, and covers an area of about 1,91,791 sq.km. It accounts for 5.83 percent of the total area of the country (32.88 lakh sq.km) and ranks eighth among the major states of the country in terms of size. Physiograpically, Karnataka forms part of two well defined macro regions of Indian Union; the Deccan Plateau and the coastal plains and islands. The state has four physiographic regions. (FIG-1)
Northern Karnataka Plateau comprises of the districts of Belgaum, Bidar, Bijapur and Gulbarga and is largely composed of the Deccan Trap. It represents a monotonous, treeless extensive plateau landscape with a general elevation of 300 to 600 meters from the mean sea level. However the river plains of the Krishna, Bhima, Ghataprabha and the Malaprabha with intervening watersheds, the step like landscapes, lateritic escarpments, residual hills and ridges break the monotony of this extensive plateau. The general slope is towards the east. This region is largely covered with rich black cotton soil.
Central Karnataka Plateau covers the districts of Bellary, Chikmagalur, Chitradurga, Dharwad, Raichur and Shimoga.
The region represents the transitional surface between the northern Karnataka plateau of Deccan Trap and southern Karnataka Plateau with relatively higher surface. By and large, this region represents the area of Tungabhadra basin. The general elevation varies between 450 and 700 meters. The general slope of this region is towards the east.
The Southern Karnataka Plateau covers the districts of Bangalore, Bangalore rural, Hassan, Kodagu, Kolar, Mandya, Mysore and Tumkur. This region largely covers the area of the Cauvery river basin lying in Karnataka. It is bound by 600 meters contour and is characterised by a higher degree of slope. In the west and south, it is enclosed by the Western Ghats and the northern part is an interrupted but clearly identifiable high plateau. In the east the valleys of the Cauvery and its tributaries open out to form undulating plains. The general elevation of the region varies from 600 to 900 meters. However, residual heights of 1,500 to 1,750 meters are found in the Biligirirangan hills of Mysore district and the Brahmagiri range of Kodagu district.
The Karnataka coastal region, which extends between the Western Ghats, edge of the Karnataka Plateau in the east and the Arabian Sea in the west, covers Dakshina Kannada and Uttara Kannada districts. Several ridges and spurs of Western Ghats traverse this region. It has an undulating terrain full of rivers, creeks, waterfalls, peaks and hills. The coastal region consists of two broad physical units, the plains and the Western Ghats. The coastal plains represent a narrow stretch of estuarine and marine plains. The abrupt rise at the eastern flanks forms the Western Ghats. The northern parts of the Ghats are of lower elevation (450-600 meters) as compared to Southern parts (900 to 1,500 meters). The Coastal belt with an average width of 50 to 80 km covers a distance of about 267 km. from north to south.
Karnataka has all types of variations in topography - high mountains, plateaus, residual hills and coastal plains. The state is surrounded by mountains to its west, east and south. It consists mainly of plateau, which has higher elevation of 600 to 900 meters above the mean sea level. The entire landscape is undulating, broken by mountains and deep ravines. Plain land of elevation less than 300 meters above mean sea level is to be found only in the narrow coastal belt, facing the Arabian Sea. There are quite a few high peaks both in Western and Eastern Ghat systems with altitudes more than 1,500 meters. A series of cross-sections drawn from west to east across the Western Ghat generally exhibit, a narrow coastal plain followed to the east by small and short plateaus at different altitudes, then suddenly rising upto great heights. Then follows the gentle east and east-north-west sloping plateau. Among the tallest peaks of Karnataka are the Mullayyana Giri (1,925-m), Bababudangiri (Chandradrona Parvata 1,894 m) and the Kudremukh (1,895-m) all in Chikmagalur District and the Pushpagiri (1,908-m) in Kodagu District. There are a dozen peaks, which rise above the height of 1,500 meters.
Karnataka accounts for about six per cent of the country's surface water resources of 17 lakh million cubic m . About 40 percent of this is available in the east flowing rivers and the remaining from west flowing rivers. There are seven river basins which along with their tributaries drain the State. The river systems include Krishna, Cauvery, Godavari and the west flowing rivers of north Pennar, south Pennar and Palar.
The state enjoys three main types of climate. For meteorological purposes, the state has been divided into three sub-divisions namely: coastal Karnataka (Dakshina Kannada and Uttara Kannada districts), north interior Karnataka (Belgaum, Bidar, Bijapur, Dharwad, Gulbarga and Raichur districts) and south interior Karnataka (the remaining districts of Bangalore Rural, Bangalore, Bellary, Chikmagalur, Chitradurga, Kodagu, Hassan, Kolar, Mysore, Mandya, Shimoga and Tumkur districts)
The entire coastal belt and the adjoining areas have a tropical monsoon climate. The climate in this region is hot with excessive rainfall during the monsoon season i.e., June to September. The southern half of the state experiences hot seasonally dry tropical savanna type of climate while most of the northern half experiences hot, semi-arid, tropical steppe type of climate. The climate of the state varies with the seasons.
The winter season from January to February is followed by the summer season from March to May. The period from October to December forms the post-monsoon season. The period from October to March, covering the post-monsoon and winter seasons, is generally pleasant over the entire State except during brief spells of rain associated with north-east monsoon, which affects the south-eastern parts of the State during October to December.
The months April and May are hot, very dry and generally uncomfortable. Weather tends to be oppressive during June due to high humidity and temperature. The next three months (July, August and September) are somewhat comfortable due to reduced day temperature although the humidity continues to be very high.
Day and night temperatures are more or less uniform over the state, except in the coastal region and high elevated plateau. They generally decrease south-westwards over the state due to higher elevation and attain lower values at high level stations. April and May are the hottest months. In May, mean maximum temperature shoots upto 40 ° C over the north-eastern corner of the State, decreasing south-westwards towards the western Ghat region and the coastal belt. The highest temperature recorded at an individual station in the State is 45.6 ° C at Raichur on May 23, 1928, which are 6 ° higher than the normal for the warmest months. December and January are the coldest months. The lowest temperature at an individual station was 2.8 ° C during1918 December 16 at Bidar.
The annual rainfall in the State varies roughly from 50 to 350 cm. In the districts of Bijapur, Raichur, Bellary and southern half of Gulbarga, the rainfall is lowest varying from 50 to 60 cm. The rainfall increases significantly in the western part of the State and reaches its maximum over the coastal belt. The southwest monsoon is the principal rainy season during which the State receives 80% of its rainfall. Rainfall in the winter season (January to February) is less than one per cent of the annual total, in the hot weather season (March to May) about 7% and in the post-monsoon season about 12%.
Southwest monsoon normally sets in over the extreme southern parts of the state by about 1st of June and covers the entire state by about 10th of June. The rainy months July and August account individually to about 30% and 18% of annual rainfall. There are about 26 rainy days (with daily rainfall of atleast 2.5 mm) during the northeast monsoon, which begins from the northern parts of the state around 2nd week of October and by the 15th October withdraws from the State.
The retreating monsoon current i.e. the north-east monsoon (October to December) effects the eastern parts of south interior Karnataka and accounts for about 30% of rainfall in this region. Out of the 14 heavy rainfall stations in India, with annual rainfall of more than 500 cm., four stations are situated in Karnataka. They are Agumbe in Tirthahalli taluk of Shimoga district (annual rainfall-828 cm) and Bhagamandala (603 cm), Pullingoth (594 cm) and Makut (505 cm) in Kodagu district.
These are the physiographic, climatic and hydrological backgrounds of the study area. This has given insight to the factors, which affect the rainfall and availability of water in this region.
The main objectives of the study were as follows:
• To filter and calculate the Normalized Difference Vegetation Index of the image for 2000 and 2001 to know the change in the vegetative cover and density as it is a parameter of knowing the spatial distribution of rainfall.
• To create a Rainfall Information System of Karnataka to show the change in the rainfall received district-wise between 2000 and 2001.
• To bring out the causes for the differences in rainfall distribution
The satellite data used is from the IRS P4 satellite, which was launched in the year 1999. The data is used for two-time periods r 2000 and 2001. The instrument is the Ocean Color Monitor with 12-bit resolution and a swath of 1420 Kilometers with a repetitive coverage of 2 days. The rainfall data was collected from the meteorology department, Bangalore. .
ARC/INFO AND ARC/VIEW: ARC/INFO is a geographic information system with tools for automation, analysis, display, and management of geographic information. The version used is 7.2. ARC/INFO, is a powerful GIS toolbox that supports the entire spectrum of GIS applications. Arc view version 3.1 has been used to create the GIS layers. The same software can be used to query the data.
EASI PACE: PCI Inc. is a pioneer in the development of innovative geomatica software systems with capabilities in remote sensing, GIS, terrain analysis, digital photogrammetry, data visualisation and image analysis. Over the years, the software has been continually improved to make it easier to use, to adapt it to new developments in computer hardware and peripherals and, most importantly, to add new functions which users are constantly finding they need in their work. The PCI software comprises of more than 500 inbuilt programs. The version used for the present study is 6.2.
| Methodology | up | previous | next | last |
These operations aim to correct the distorted image data to create a more faithful representation of the original scene. This mainly involves the initial processing of raw image data to correct for geometric distortions, to calibrate the data radiometrically, and to eliminate noise present in the data. Thus, the nature of any particular image restoration process is highly dependent upon the characteristics of the sensor used to acquire the image data. This is often termed as pre-processing operations because they normally precede further manipulation and analysis of the image data to extract specific information. The satellite image was geo-coded with the RMS error within the acceptable limit.
The goal of image enhancement is to improve the visual interpretability of an image by increasing the apparent distinction between the features in the scene. The process of visually interpreting digitally enhanced imagery attempts to optimise the complementary abilities of the human mind and the computer. The mind is excellent at interpreting spatial attributes on an image and is capable of selectively identifying obscure or subtle features. However, the eye is poor at discriminating the slight radiometric or spectral differences that may characterise such features. Computer enhancement aims to visually amplify these slight differences to make them readily observable. The range of possible image enhancement and display options available to the image analyst is virtually limitless. Most enhancement techniques may be categorised as either point or local operations. Point operators modify the brightness value of each pixel in an image data set independently. Local operations modify the value of each pixel based on neighbouring brightness value. Either form of enhancement can be performed on single band images or on the individual components of multi-image composites. This has been done to view the image more clearly with the vegetation more clearly visible.
Normalized Difference Vegetation Index (Ndvi)
There are various types of vegetation indices like DVI difference vegetation index, which is calculated by
NIR-R. This index does not compensate for the difference in illumination conditions. So, it's modified to NDVI.
The formula is: NIR-R / NIR+R
The main purpose of the vegetation indices is to determine the vigour, biomass, health and productivity of vegetation. The near infrared band is the reflective band for the vegetation and the red band is absorptive band for the vegetation. This helps in determining the regions of healthy vegetation and sparse vegetation in the satellite images of both the years showing the regions, which received rainfall and which did not, the areas, which were drought hit and which had abundant rainfall (Figure 2).
GIS is defined as a system of computer hardware and software, designed to allow users to collect, manage, analyse and retrieve large volumes of spatially referenced data and associated attributes collected from a variety of sources . GIS is rapidly becoming a useful tool for management of resources, and at present it is difficult to think of a resource planning or mapping without a GIS. Effective utilisation of large spatial data volumes is dependent upon the existence of an efficient geographic handling and processing system that transforms this data into usable information.
Software Modules: Software modules are required for organising the GIS database, integration operations and processing the output. The creation of the rainfall system these modules of a GIS can be classified in to following four categories:
a) Data Input and Editing
b) Database Management
c) Data Display and Output
• Data input: Before any spatial analysis or modeling operations can be carried out in a GIS, it is necessary to feed it with the requisite data. Data input is the procedure of encoding the data into a computer readable form and writing the data to a GIS database. It is essential that the data should be accurate and sufficiently comprehensive. The earth surface data for any GIS application can be derived from various sources. They are mainly of two types.
• Spatial Data : It consists of maps, which have been prepared either by field surveys, Survey of India or by the interpretation of remotely sensed data. Many of these maps are available in analog form and some map information is available directly in digital format. Thus, the incorporation of these maps into a GIS depends upon whether it is in analog or digital format, each of which has to be handled differently. This data can be reduced to three basic topological concepts, as described below:
1. Point Data: It consists of observations that occur only at points, or occupy very small areas in relation to the scale of the database. Features like wells, buildings, etc., can be shown as point data.
2. Line Data: Features such as highways, railways, elevation contours, and pipelines exemplify Line data. Vector-based GIS systems can show line data in fine detail, whereas raster-based systems depict a linear feature only as a chain of grid cells.
3. Aerial Data: It includes soil, land cover, water bodies, vegetation and objects that occupy an area at the working scale of a GIS. Vector-based systems provide detailed delineation of boundaries of the classes.
• Non-Spatial Data : It consists of attributes that are complementary to the spatial data, and describes what is at a point along a line or a polygon. The attribute usually represents the properties or characteristics of the spatial data, which may include socio-economic characteristics from census or from other sources.
The non-spatial data is mainly available in tabular records in analog form and needs to be converted in to digital format for incorporation in GIS. This has been done by arcview after the topology for the Karnataka vector was built as a polygon. Then, the data was attached to it.
• Database Management: A Database Management system (DBMS) comprises a set of programs that manipulate and maintain the data in a database. DBMS manages the storing of data in an orderly manner and ensures that the integrity of the database is maintained. It acts as a central control over all interactions between the database and the application programs, which in turn interact with the user. One of the major benefits of a DBMS is that it provides data independence; i.e., the user does not need to know how the data is physically stored.
c) Data Output: The processed output from a GIS can be taken in several forms as hardcopy, softcopy or electronic. Hardcopy outputs are permanent means of display, and can be printed on paper, Mylar , photographic film or others. Maps and tables are common outputs in this format. Softcopy output is the display as viewed on a computer monitor, such as text or graphics. Output in electronic format consists of computer compatible files. These files are usually stored on a magnetic medium, such as a floppy, magnetic tape or compact disk.
| Results | up | previous | next | last |
• The area, which was bare of vegetation, has considerably reduced from 2000 to 2001.
• The red part on the NDVI image shows the healthy vegetation in the coastal and Malnad region.
• The rainfall information system has the parameters of Normal rainfall, actual rainfall, temperature, population,(decinnial) for the years 2000 and 2001. The advantage is this data can be updated annually which would help in performing more up-to date spatial queries.
| Suggestions to the Primary Sector | up | previous | next | last |
• The meteorological department provides advanced information about the movement of monsoon winds, which cause rain. The amount of cloud cover helps in understanding the precipitation it can provide at a particular region.
• The runoff of the soil at the slopes can be avoided by contour ploughing and bunds with intermediate dug holes on the regular runoff slopes so that the stagnant water can percolate in and cause less runoff.
• The seasonal variations in the rainfall and the underlying topography over a region has to be understood and cropping pattern has to be changed in accordance to the variations in the precipitation especially in the rainfed regions.
• Inconsiderate expanses in the wooded area have to be avoided as it will increase runoff and affect the rainfall. The total forest cover of Karnataka is 23%, which is less than the normal level of 33%. If this reckless destruction of our forests is not stopped the seasonal rainfall mechanism will be further disturbed leading to more uncertain rainfall, which would disturb the entire fabric of seasons.
• The increase in the man - induced desertification is causing havoc to the environment this can be rectified by reclamation of the forestland by mangroves.
| Conclusion | up | previous | next | last |
Indian Meteorological Department has declared the year 2002 as a drought year. Three meteorological sub divisions in Karnataka- north interior, south interior and coastal Karnataka have experienced moderate drought. These areas have received 31%, 44%, and 30% less rainfall (till Oct 5) respectively when compared to the previous years. The main reason for the unpredictability of monsoon is not a local phenomenon but a global phenomenon, which is affected by the Jet streams in the lower stratosphere. The various physiographic and climatic factors have been dealt already in the beginning of this paper itself. The truth is technology can give fast and accurate output but it is finally man whose actions in his environment leads to the microclimatic changes which cause devastating results upsetting his surrounding ecosystem. Each and every person in his own way has to protect his surrounding environment. We should leave the environment alive and breathing for the coming generation and not as beautiful pictures on walls and museums.
PHYSIGRAPHIC DIVISIONS OF KARNATAKA
2000 2001
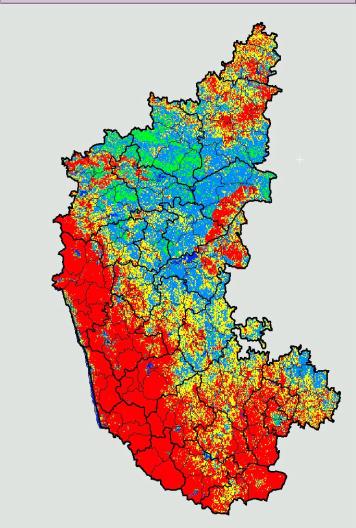
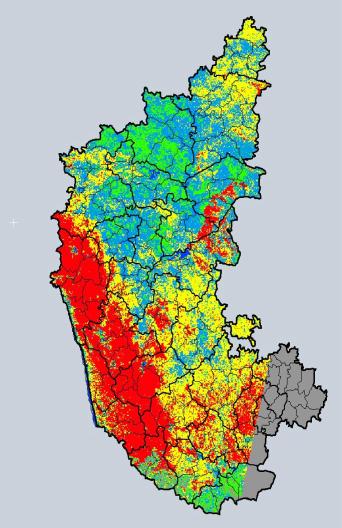
![]() HEALTHY VEGETATION
HEALTHY VEGETATION![]() WATER BODY
WATER BODY![]() MEDIUM VEGETATION
MEDIUM VEGETATION
![]() SPARSE VEGETATION
SPARSE VEGETATION![]() BARE OF VEGETATION
BARE OF VEGETATION ![]() DATA UNAVAILABLE
DATA UNAVAILABLE
| Acknowledgement | up | previous | next | last |
We would like to thank the department of Meteorology for providing the rainfall data used in creating the rainfall information system and we also would like to extend our thanks to Miss. Shobha Naidu for her assistance in creating NDVI images for digital analysis.
| Address: | up | previous |
** Dept. Of Geography, Bangalore University,
* Dept. Of Remote Sensing, Birla Institute Of Technology
Phone: 5561128
E-mail: mrvijaindra@yahoo.co .in