Southern WesternGhats
India ranks 10th amongst the most forested nations of the
world (FAO, 2006), with 21.71 percent (71.38 million ha) of its
geographical area under forest and tree cover (FSI, 2021). India
has four major hotspots, and the Western Ghats is one of the
primary hotspots of it. This region is recognized as one of the
eight ‘hottest hotspots’ of biological diversity in the world
(Myers et al., 2000) and among the 200 globally most important
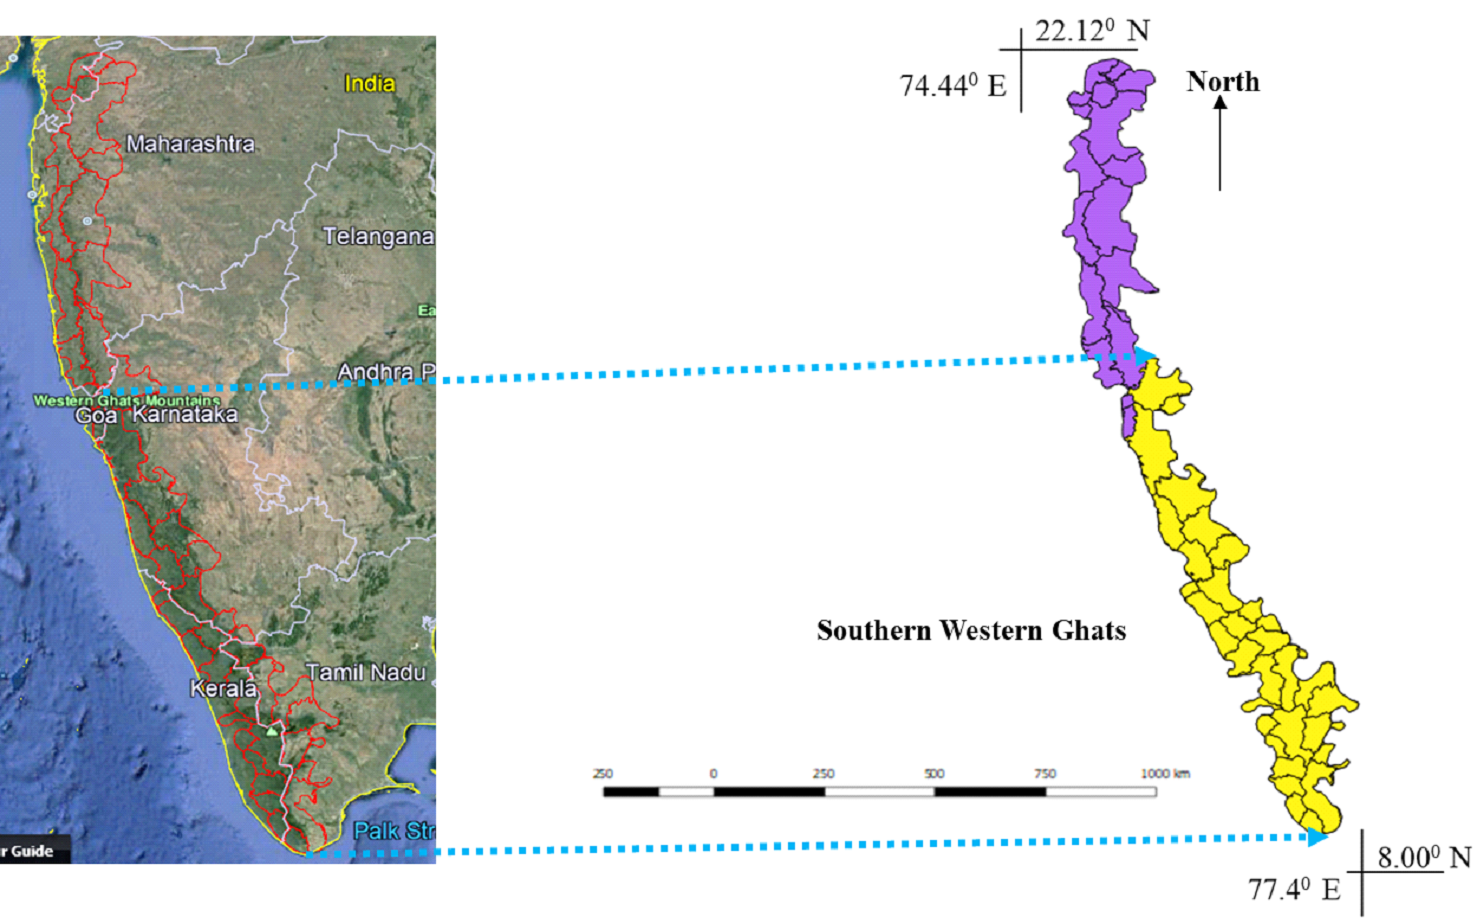
Ecoregions (Olson and Dinerstien, 1998). It covers an area of
approximately 160,000 sq km, with an elevation range of 300–2700
m, and extends from 8° N to 21° N latitudes and 73° E to 77° E
longitudes (Figure 2). It stretches to a width of 210 km in
Tamil Nadu and narrows to as small as 48 km in Maharashtra
(leaving the Palghat gap).
The mean elevation of the Western Ghats is higher than 600 m
and exceeds 2000 m at some places. The Western Ghats falls in
six states: Gujarat, Maharashtra, Karnataka, Kerala, Goa, and
Tamil Nadu. Nearly 2000 species of higher plants, 84 species of
fishes, 87 species of amphibians, 89 species of reptiles, 15
species of birds, and 12 species of mammals are endemic to the
Western Ghats
(Daniel, 1997)
.
The Western Ghats sector receives rains from the southwest
monsoon. It rains all year round in southern parts while the
areas in the north remain dry for 8-9 months. The average annual
rainfall in the Western Ghats region is 2500 mm. Rainfall is as
high as 7600 mm in localities such as Agumbe village in the
Shimoga district of Karnataka
(Daniels and Vencatesan,
2008) .
The climate is generally warm and humid but becomes hot in
summer and cold in the winter months. Mean temperature ranges
from 18° to 24° C, rises beyond 30° C in the summer season and
sometimes down up to 0° C in the winter season in places of high
altitudes. The Western Ghats act as an important watershed for
the peninsula. There are 38 east-flowing and 27 west-flowing
major rivers originating from the Western Ghats. The
west-flowing rivers drain into the Arabian Sea, whereas the
east-flowing rivers merge into one of the three major river
systems, Cauvery, Krishna, or the Godavari, before joining the
Bay of Bengal (Dahanukar et al., 2004).
The Southern Western Ghats (SWG) include mainly Kerala,
Karnataka, and Tamil Nadu. The moist forests cover 13,314 km2 in
the SWG harbors greater levels of biodiversity and endemism than
the rest of the Western Ghats
(Das
et al., 2006) . It forms one
of the largest contiguous blocks of ‘thick’ forest cover with
rich carbon sequestration
(Ramachandra and Bharath,
2020) . The
Anaimudi peak in the high ranges of Kerala rises to the height
of 2695 m, is the highest peak south. There is a major
discontinuity in the otherwise continuous hill tract, stretching
from the north to south and is known as the Palghat gap, which
is about 30 km long and 100 m high above mean sea level
(Reddy
et al., 2016) . A study in the southern region,
comprising the
states of Karnataka, Kerala, and Tamil Nadu, showed that between
1920-1990 about 40% of the original vegetation cover was lost or
converted to another form of land use
(Menon and Bawa, 1997) .
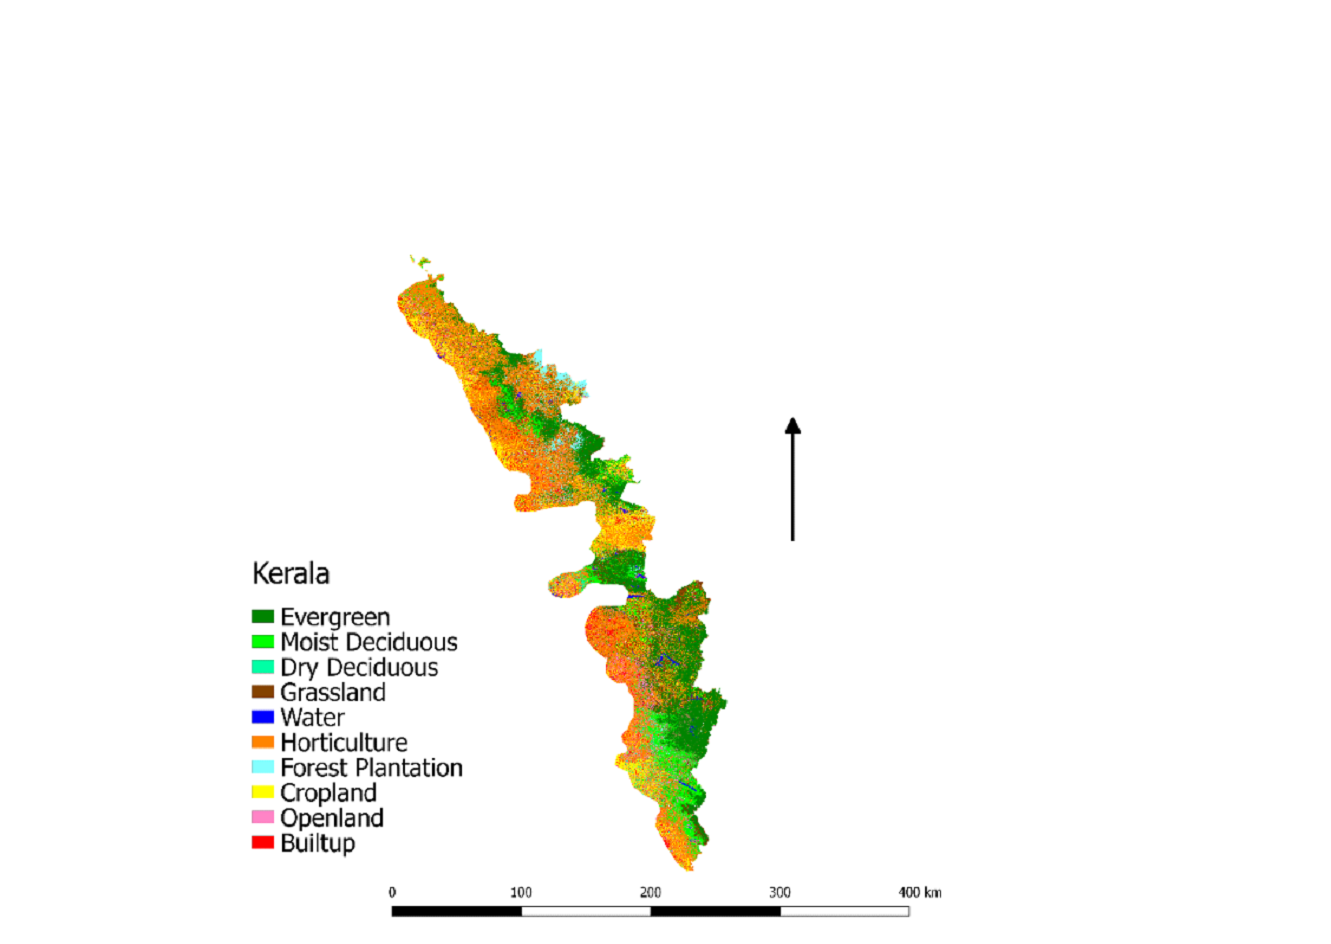
The landscape comprises a variety of eco-zones ranging from
lush green to moist evergreen forests. The variability in
precipitation and topographic diversity generates various
vegetation types ranging from wet evergreen and semi-evergreen
forests on the western side and at high altitudes to dry
deciduous forests on the eastern slopes and lowlands
(Champion
and Seth 1968) . The major vegetation types are tropical
evergreen forests, moist deciduous forests, scrub jungles,
sholas, savannas, and high rainfall savannas. The highly dense
forest has several wildlife parks, including the Silent Valley
National Park, which is considered to be the only virgin forest
in the country. Tropical dry deciduous and thorn forests occur
in the low-lying rain shadow of the eastern slopes, while
tropical moist deciduous and wet evergreen forests dominate the
windward side of the landscape up to an elevation of 1500 m,
beyond which the vegetation mainly comprises montane grasslands
and shola forests
(Champion
and Seth 1968).
Nearly 4000, or 27% of the total plant species in India,
have been recorded from the Western Ghats
(Nair and Daneiel,
1986) . The evergreen forests of the Western Ghats are
characterized by a very high percentage of species endemic to
the region. The total number of endemic plant species is
estimated to be 1500
(Pascal et
al., 2004) . Among the evergreen
tree species, 56% are endemic, making the Western Ghats one of
world's biodiversity hot spots. Studies on plants from across
the Western Ghats have revealed that the SWG are incredibly
diverse and have high endemicity compared with the central and
NWG
(Gimaret-Carpentier et
al., 2003; Pascal et al., 2004;
Davidar et al., 2007) . Additionally, birds, amphibians,
and
fishes also exhibit similar diversity and endemicity patterns.
The SWG is more diverse with a higher proportion of endemics
than the central and north Western Ghats
(Dahanukar et
al., 2004; Aravind and Gururaja, 2011) .
Figure 2. Western Ghats with district boundary
Population density estimation: Population data for Southern
Western Ghats was collected from the Census of India portal
(http://censusindia.gov.in/).
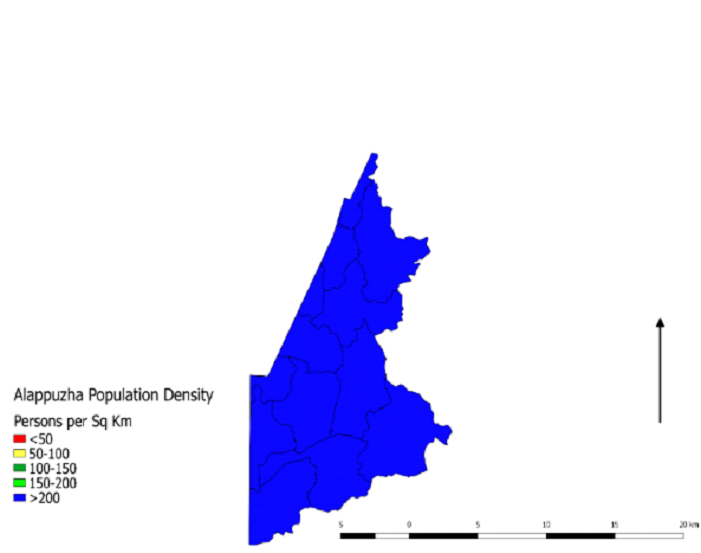
Kerala population density
Kerala has a population density
of 860 persons per sq km as per the 2011 census. It consists of
14 districts which are further divided into sub-districts called
taluks (Table 1). Some of the major towns of Kerala are
Trivandrum, Kollam, Kochi, Chengannur, Palakkad, and Nilambur.
The population data was collected from the census 2011 for each
taluks falling under SWG.
Table 1. Population Density of Kerala
| Land Use |
Land Use
Comment |
Land Use
|
Kasaragod(M) has the highest population density (13216
persons per sq km).
Two villages Balal (180 persons per sq km) and Edanad
(183 persons per sq km) have population density under
150-200 persons per sq km.
|
|
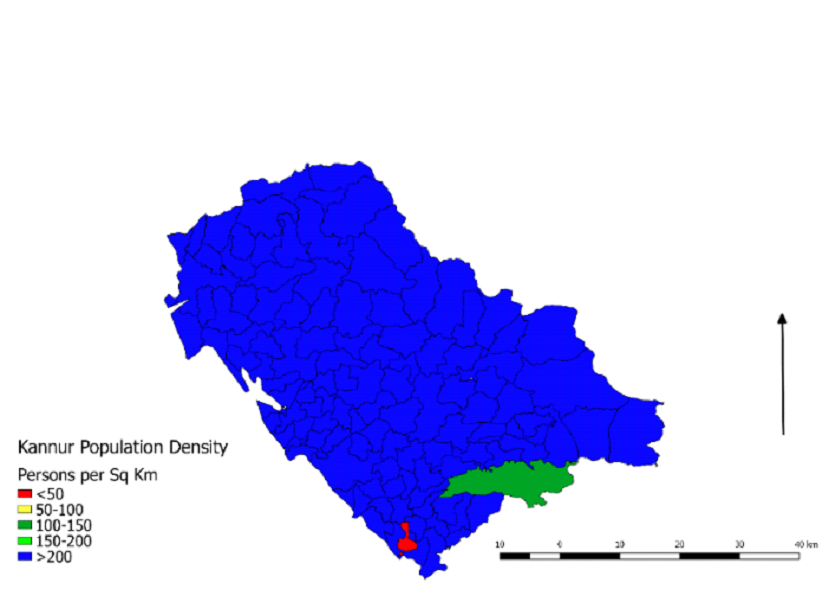
Kannur(M) has the highest population density (6319
persons per sq km). Only one of the village,
Cheruvanchery have the lowest population density of 103
persons per sq km.
|
|
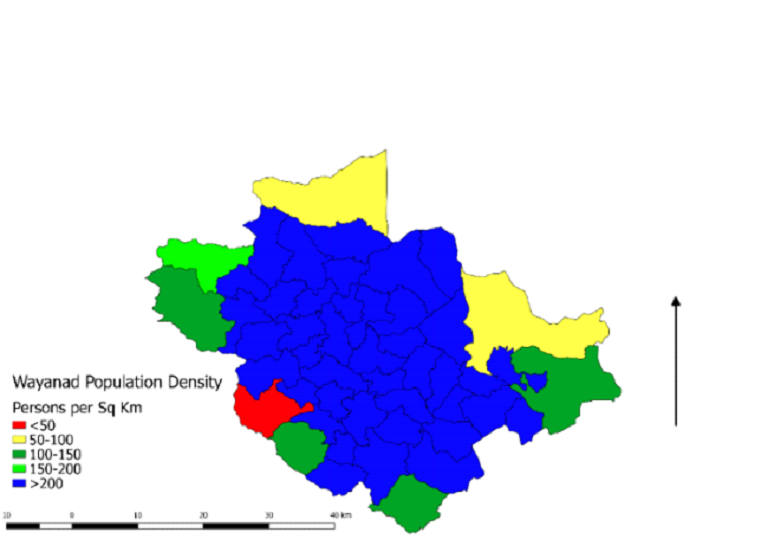
Sulthanbathery village has the highest population
density of persons 1123 per sq km. The lowest population
density is of Thariyode village i.e 30 persons per sq km
in the district.
|
|
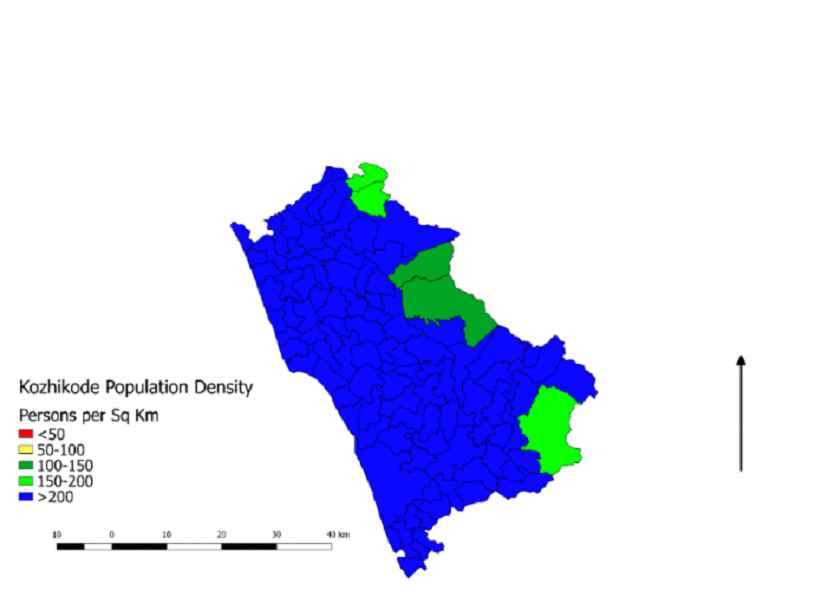
Beypore (CT) has the highest population density (7305
persons per sq km). The lowest population density is of
Chakkittapara with 101 persons per sq km in the
district.
|
|
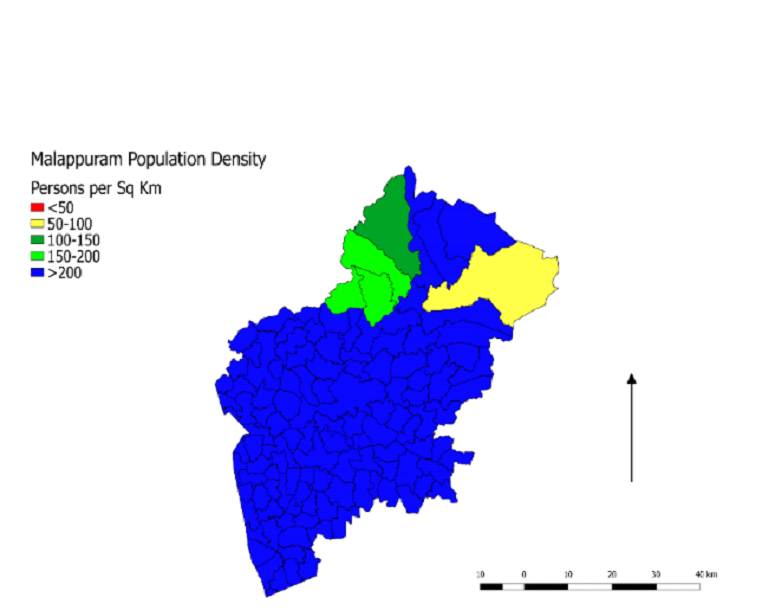
Ponnani(M) has the highest population density (3885
persons per sq km). The lowest population density is of
Karulai with 87 persons per sq km in the district.
|

|
Pirayiri has the highest population density (9782
persons per sq km). The lowest population density is of
Nelliyampathy with 20 persons per sq km in the district.
|
|
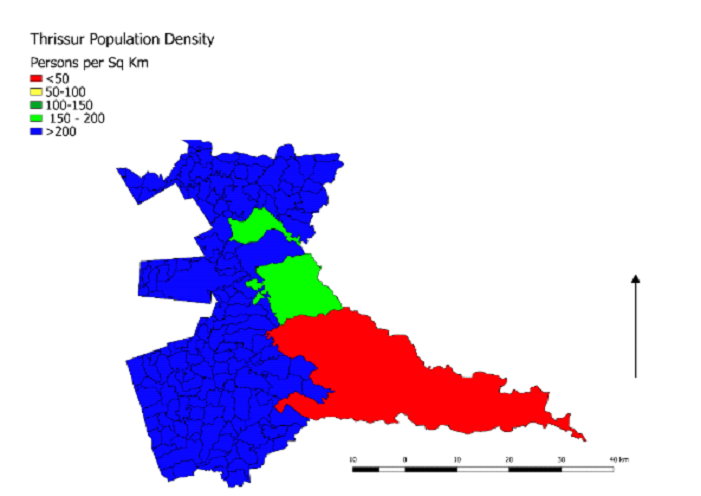
Thrissur (M Corp.) has the highest population density
(3794 persons per sq km). The lowest population density
is of Pariyaram with 44 persons per sq km in the
district.
|
|
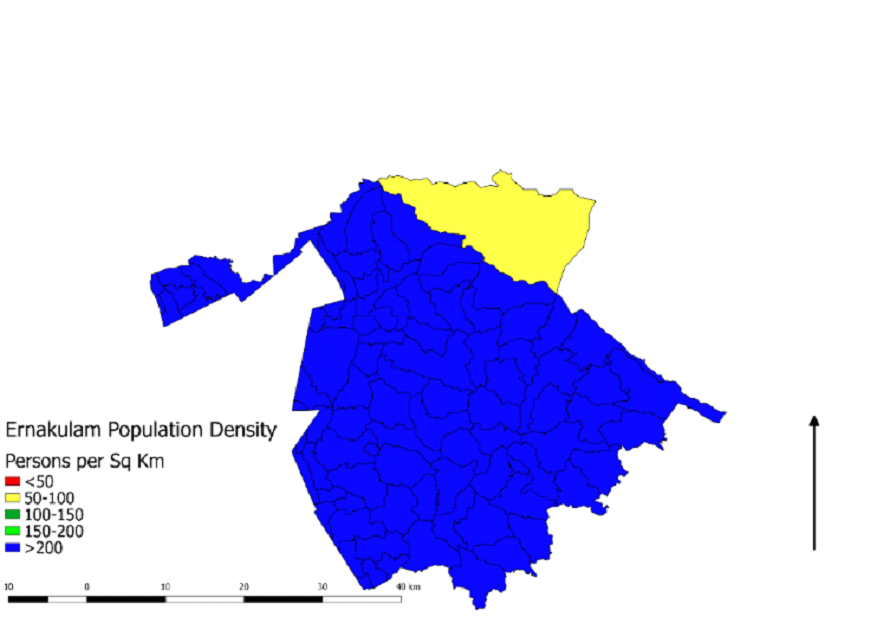
Thrippunithura has the highest population density (6117
persons per sq km). The lowest population density is of
Ayyampuzha with 65 persons per sq km in the district.
|
|
Kumaramangalam (Part) has the highest population density
(655 persons per sq km). The lowest population density
is of Mlappara with 2 persons per sq km in the district.
|
|
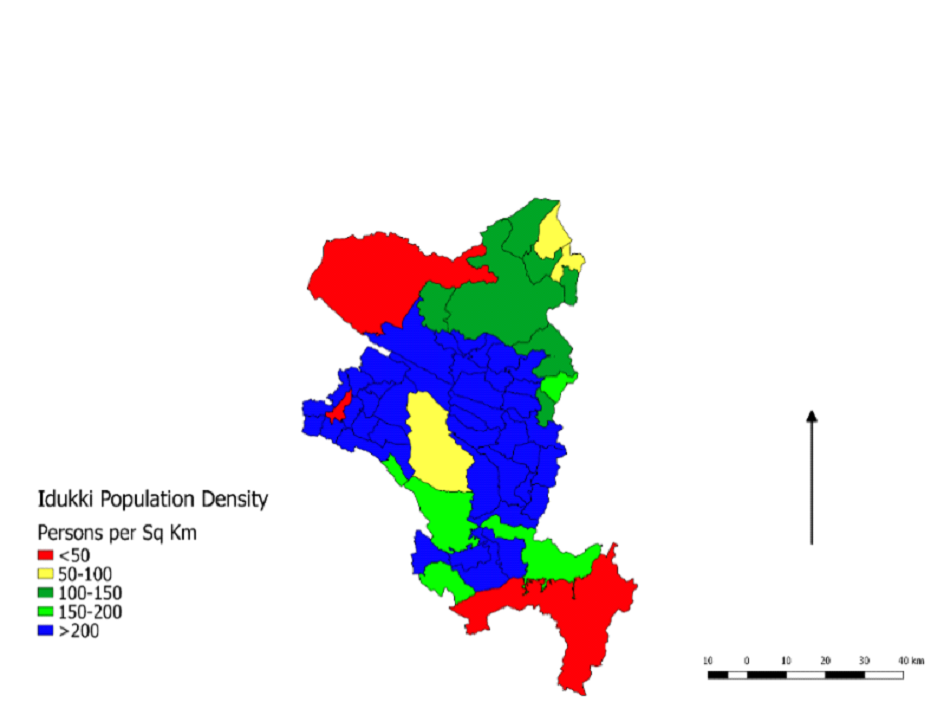
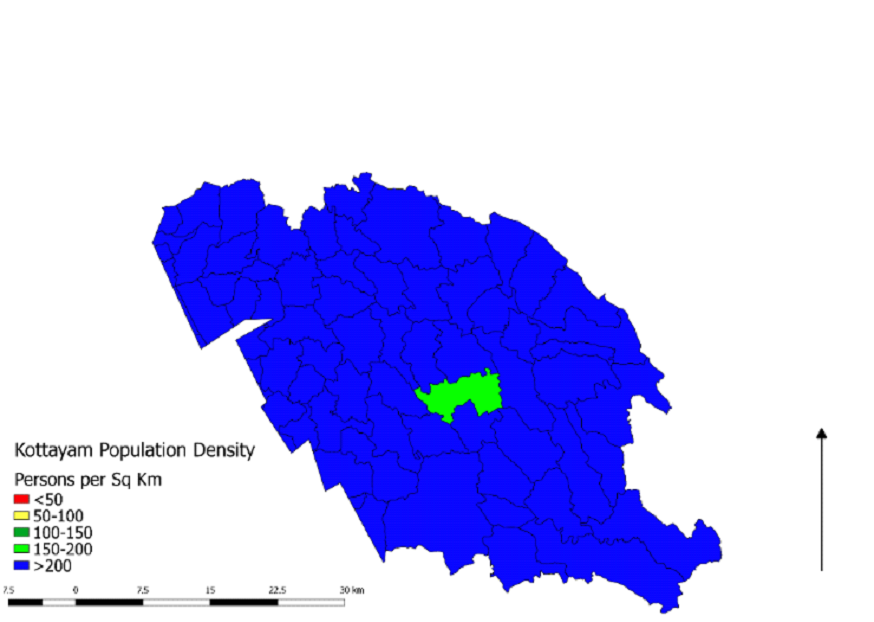
Kottayam (M) has the highest population density (4603
persons per sq km). The lowest population density is of
Chengalam East with 167 persons per sq km in the
district.
|
|
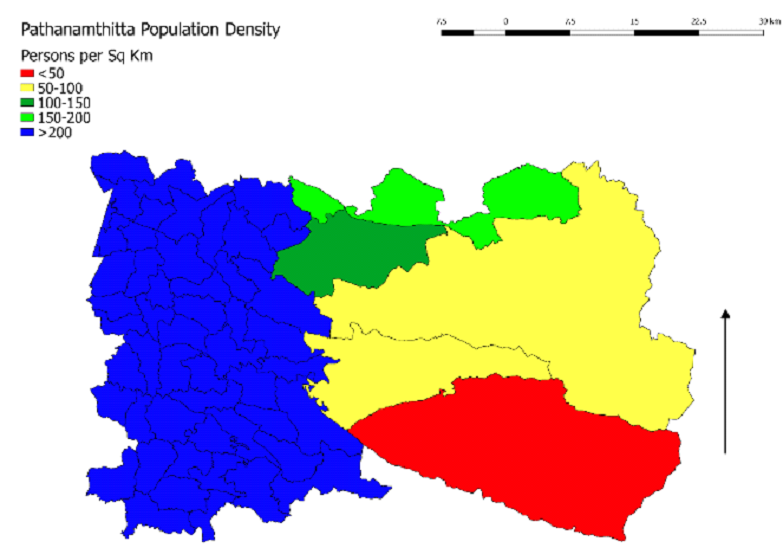
Chengannur (M) has the highest population density (1658
persons per sq km). The lowest population density is
accounted in Venmony with 1085 persons per sq km in the
district.
|
|
Adoor (M) has the highest population density (1941
persons per sq km). The lowest population density is of
Aruvappulam with 32 persons per sq km in the district.
|
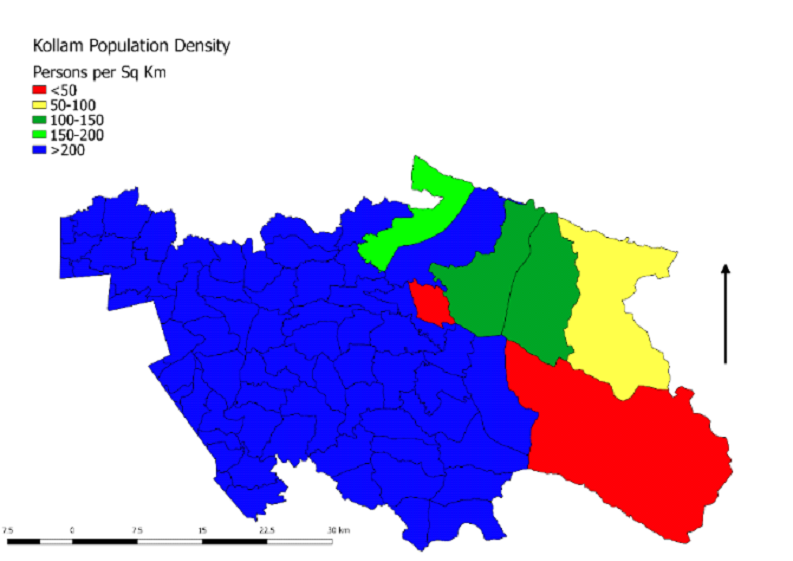
|
Mynagappally has the highest population density (6860
persons per sq km). The lowest population density is of
Valacode (Part) with 4 persons per sq km in the
district.
|
|
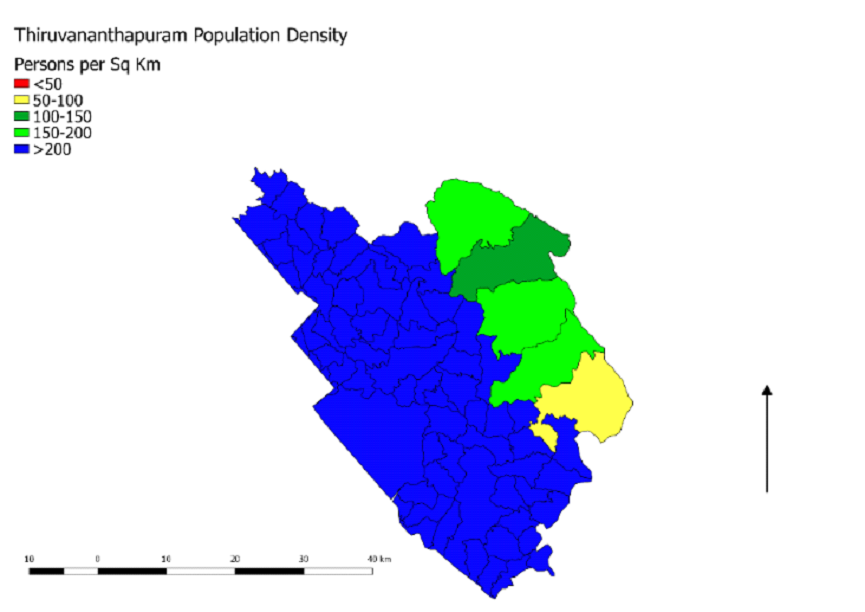
Thiruvananthapuram (M Corp.) has the highest population
density (5128 persons per sq km). The lowest population
density is of Vazhichal with 90 persons per sq km in the
district.
|
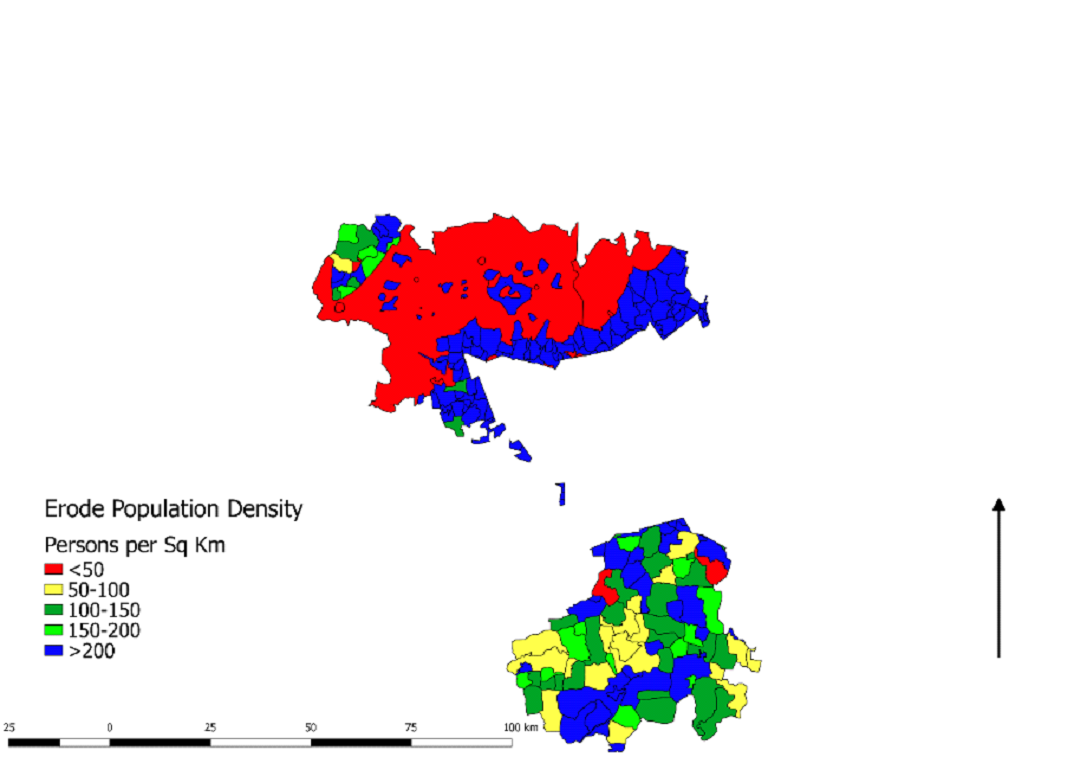
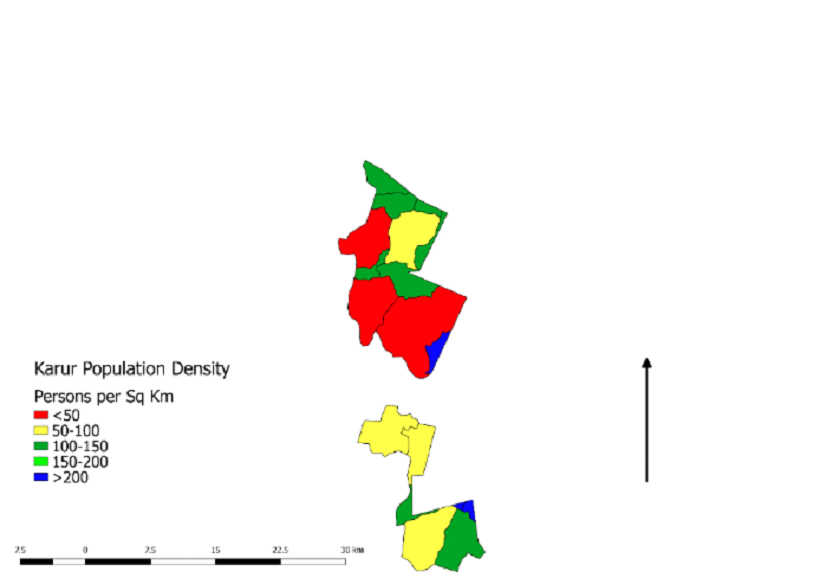
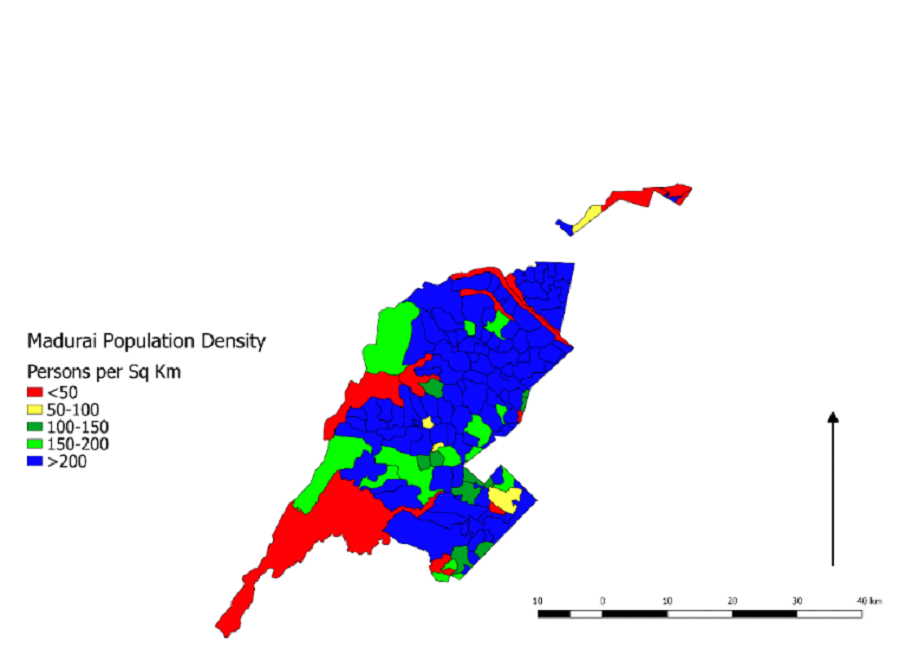
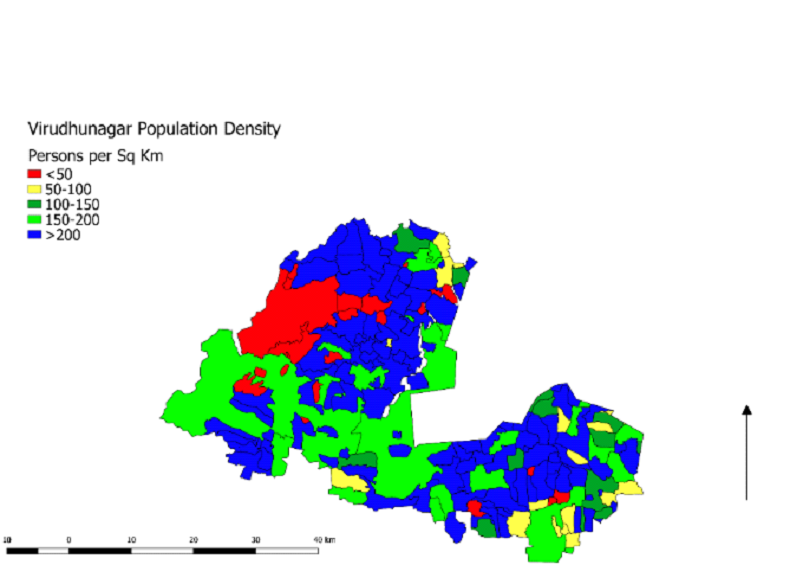
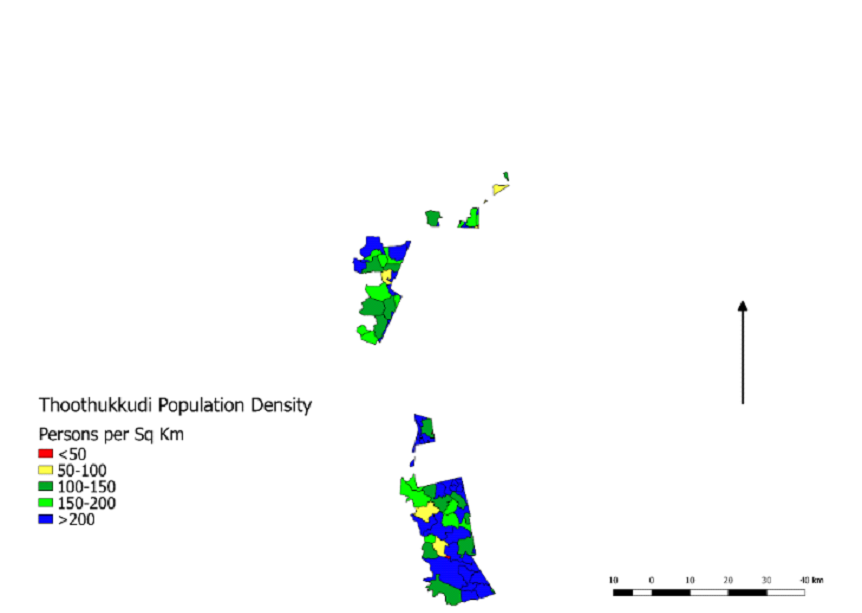
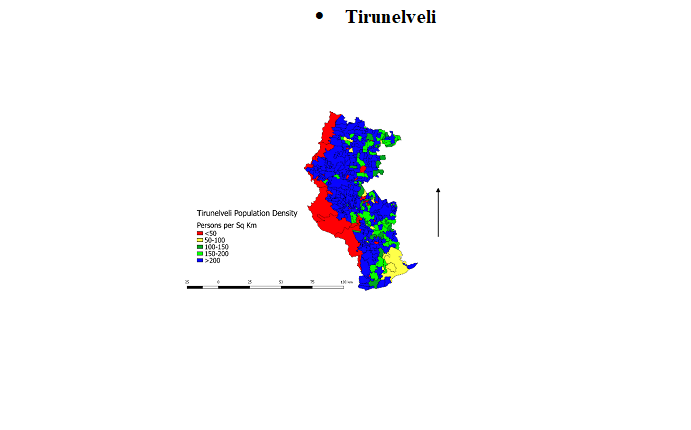
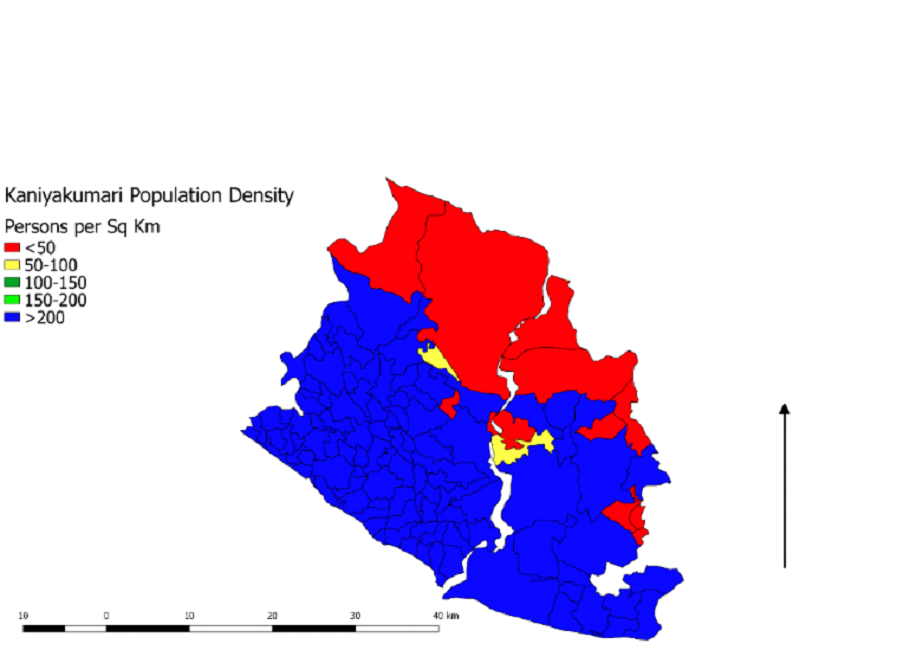
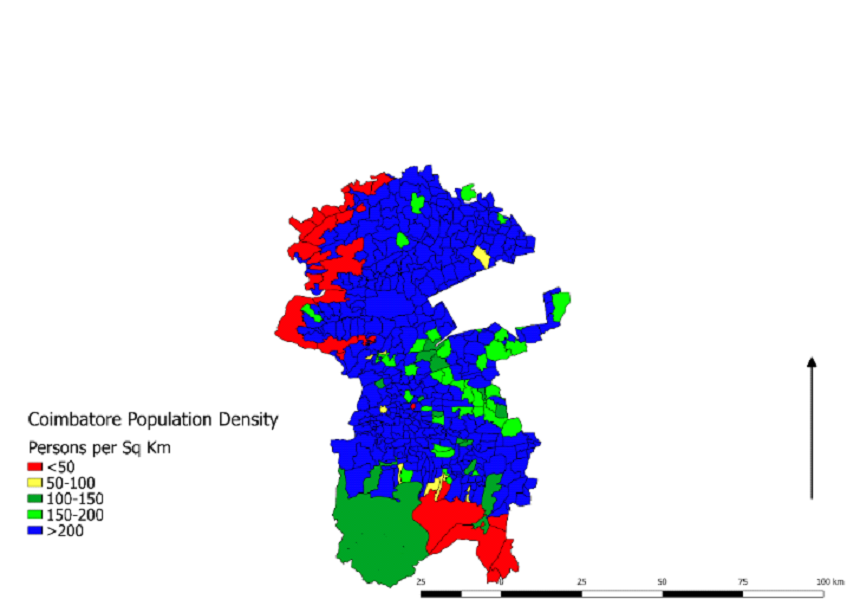
Tamil Nadu population density
Tamil Nadu has a population density of 555 persons per sq.
km as
per the 2011 census. It consists of 32 districts, further
divided
into sub-districts called taluks, out of which 11 districts fall
under the Southern Western Ghats (Table 2). Some major towns are
Nagercoil, Rajapalayam, Bodinayakanur, Pollachi, Ooty. The
population data were collected from the census 2011.
Table 2. Population Density of Tamil Nadu
| District |
Comment |
|
Dharapuram (M) has the highest population density (7626
persons per sq km). The district has the lowest
population density of Barabetta RF with 0 persons per sq
km.
|
|
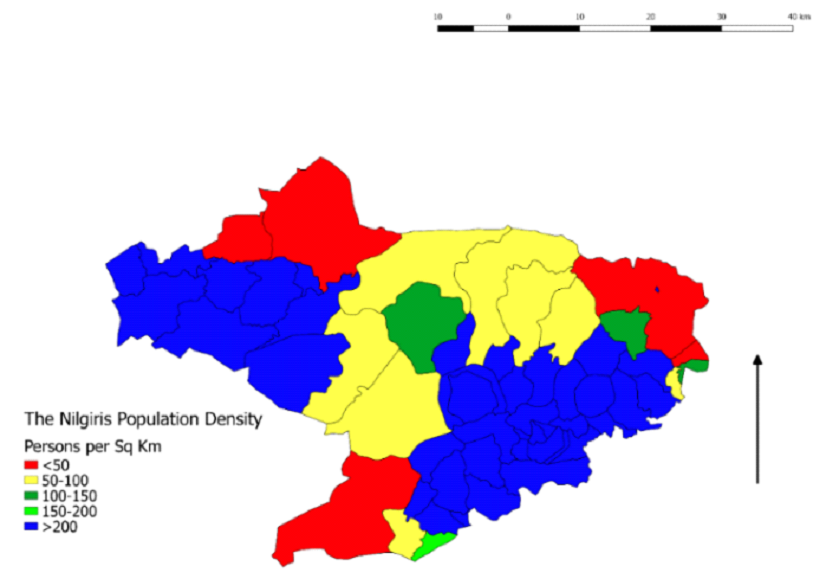
Wellington (CB) has the highest population density (3829
persons per sq km). The lowest population density is at
Mudumalai, with 9 persons per sq km in the district.
|

|
Dindigul (M) has the highest population density (17218
persons per sq km). The lowest population density is in
Kadavakurichi RF with 0 persons per sq km in the
district.
|
|
Monjanur (East) has the lowest population density (33
persons per sq km). The highest population density is of
Pallapatti (TP), with 3447 persons per sq km in the
district.
|
|
Usilampatti (M) has the highest population density (3280
persons per sq km). The lowest population density is in
Erakkalamalai RF, with 0 persons per sq km in the
district.
|

|
Kambam (M) has the highest population density of 11255
persons per sq km. The lowest population density is of
Pandarathurai RF with 0 persons per sq km in the
district.
|
|
Rajapalayam (M) has the highest population density of
12975 persons per sq km. The lowest population density
is in Tiruchalur with 0 persons per sq km in the
district.
|
|
Srivaikuntam (TP) has the highest population density
(1673 persons per sq km). The lowest population density
is in Chettiyiruppu, with 0 persons per sq km in the
district.
|
|
Sankarankoil (M) has the highest population density of
4840 persons per sq km. The lowest population density is
in Puliyarai RF (Part) with 0 persons per sq km in the
district.
|
|
Nagercoil (M) has the highest population density (7605
persons per sq km). The lowest population density is in
Velimalai RF with 0 persons per sq km in the district.
|
|
Velampalayam (M) has the highest population density
(11501 persons per sq km). The lowest population density
is in Pillur Slope RF with 0 persons per sq km in the
district.
|
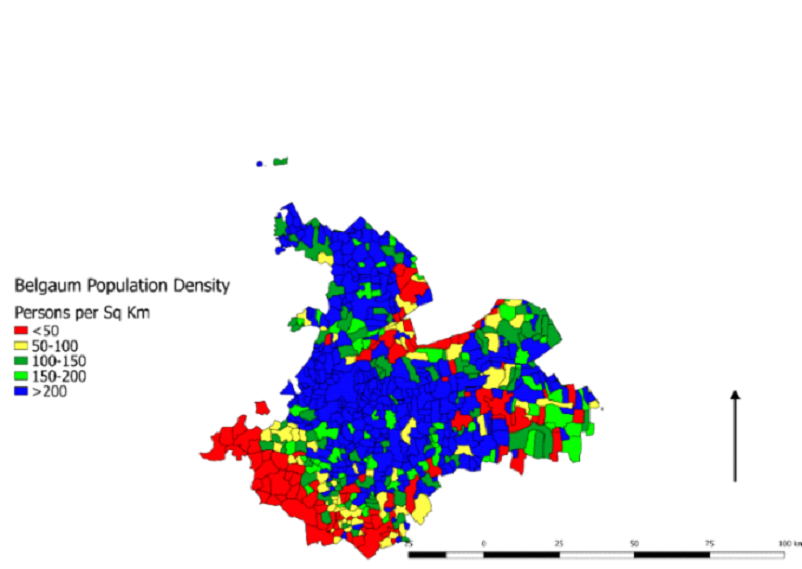
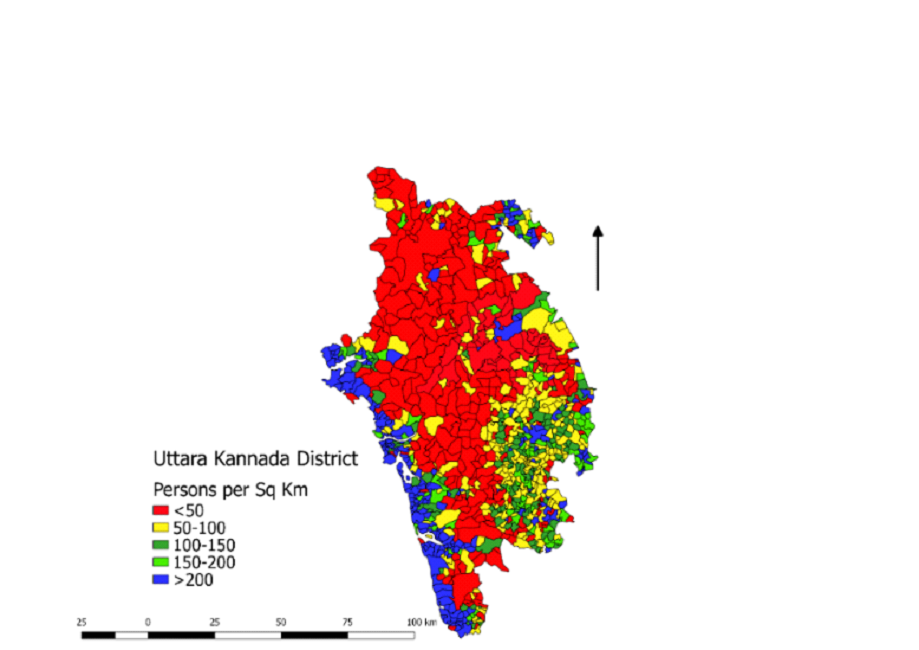
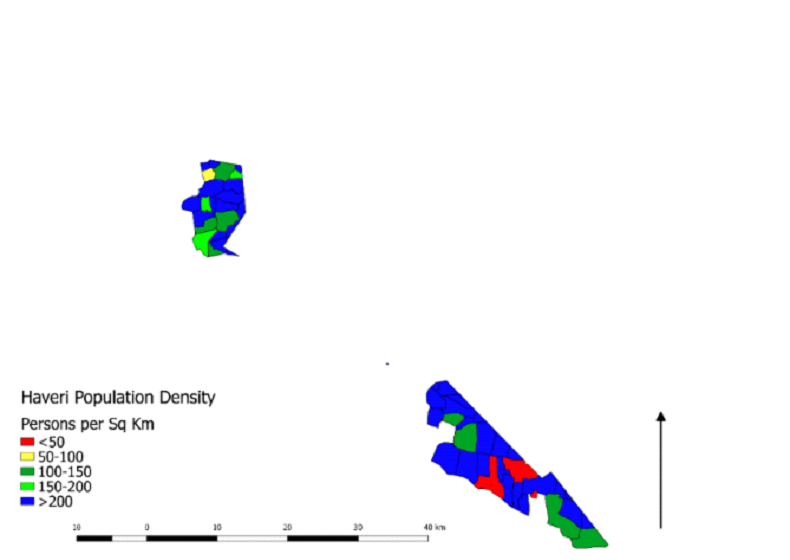
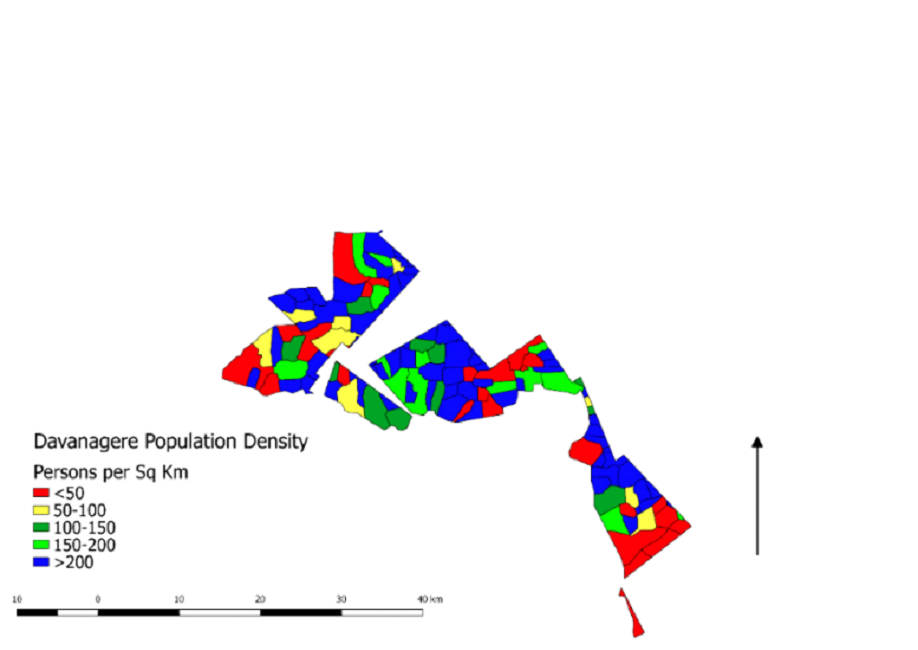
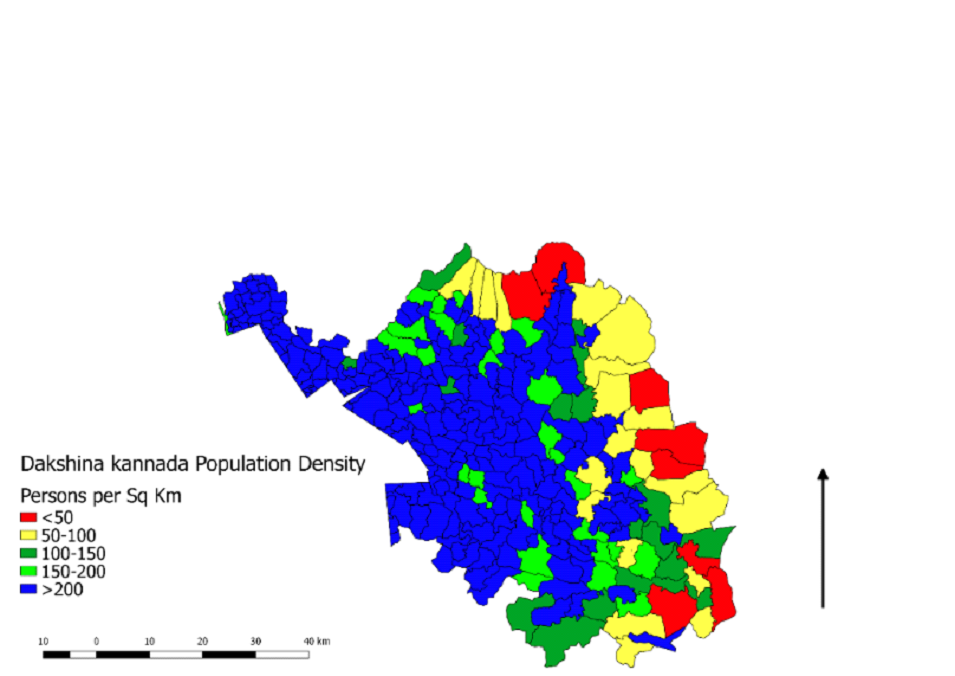
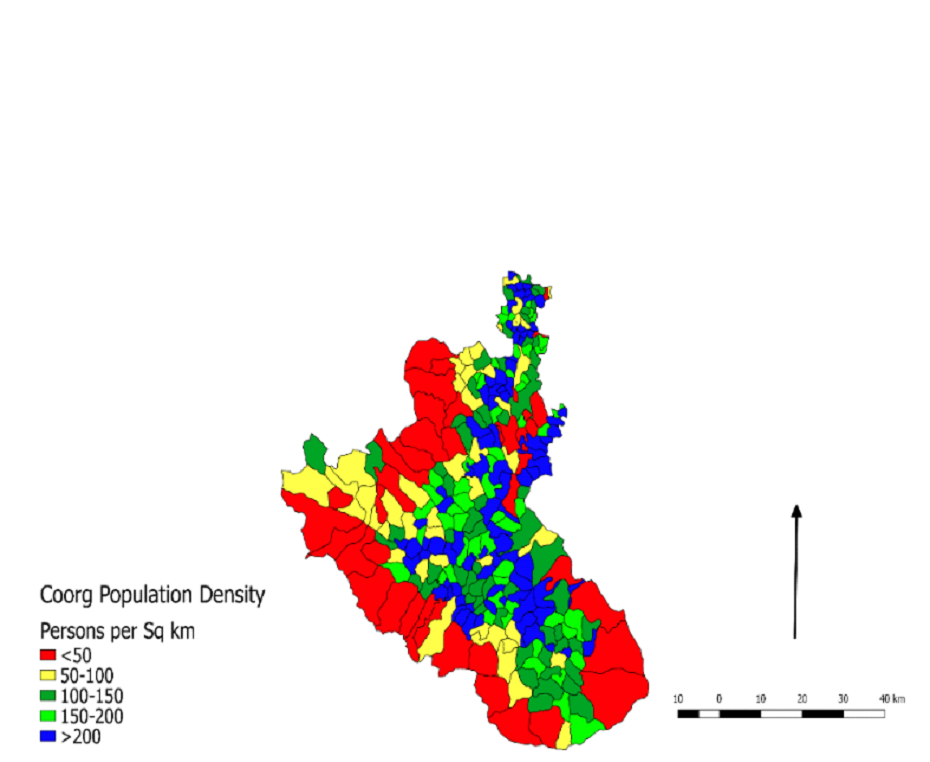
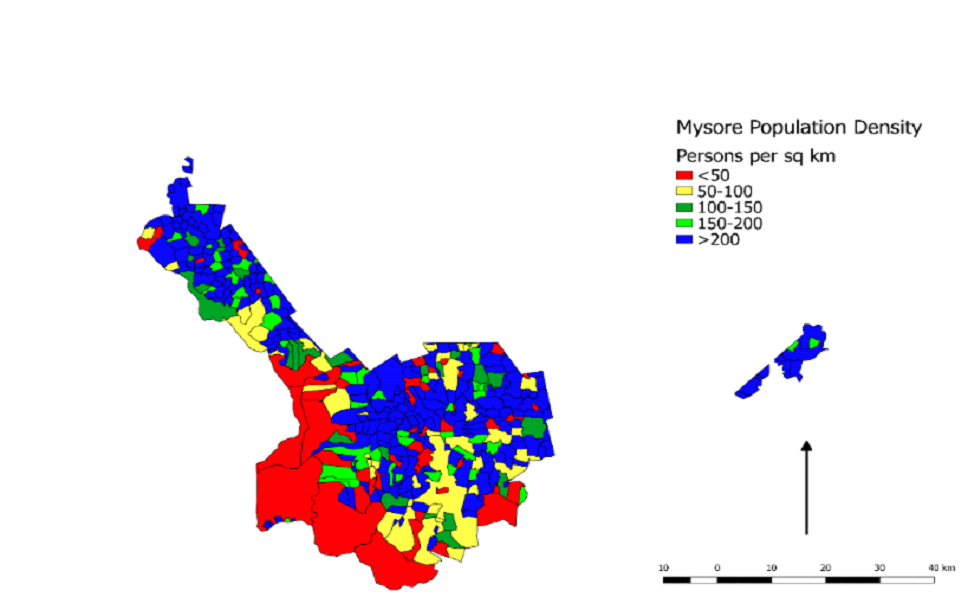
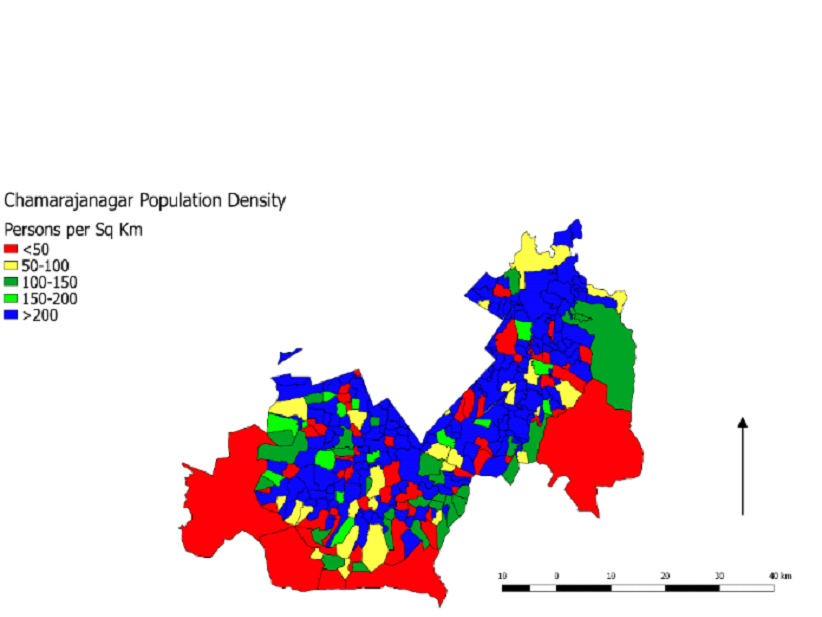
Karnataka population density
Karnataka has a population density of 319 persons per sq km
as
per 2011 census. It consists of 30 districts which are further
divided into sub-districts called taluks, out of which 15
districts
fall under the SWG (Table 3). Gundlupete, Madikeri, Puttur,
Mangalore, Shimoga, Sirsi, Belgavi are some of the major towns
of
Karnataka. The population data were collected from the census
2011.
Table 3. Population Density of Karnataka
| District |
Comments |
|
Bail Hongal (TMC) has 2242 persons per sq km with the
highest population density. The lowest population
density is in Gundlur with 0 persons per sq km in the
district.
|
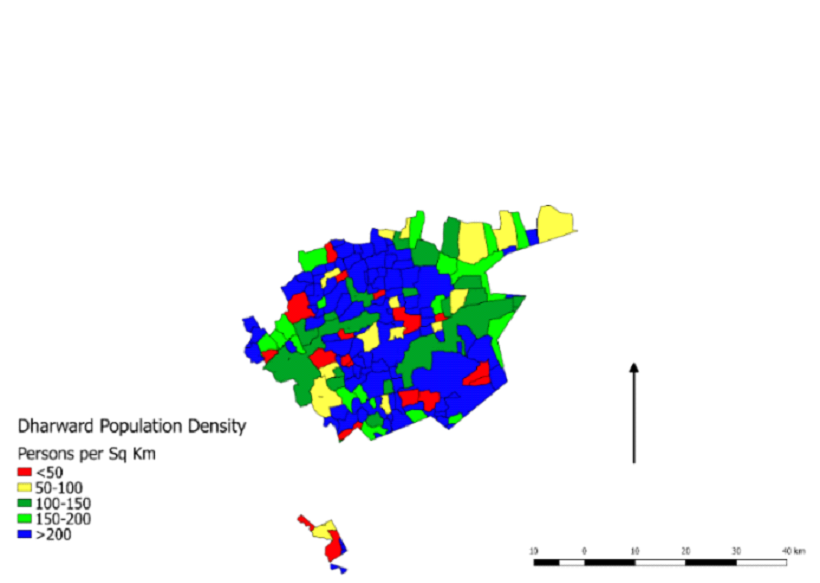
|
Hubli-Dharwad (M Corp.) has the highest population
density of 22110 persons per sq km. The lowest
population density is in Kamalapur (Part), with 0
persons per sq km in the district.
|
|
Bhatkal (TMC) has the highest population density of 8984
persons per sq km. The lowest population density is in
Kakurve with 0 persons per sq km in the district.
|
|
Hirekerur (TP) has the highest population density of
2291 persons per sq km. The lowest population density is
in Thirumalapura with 0 persons per sq km in the
district.
|
|
Surahonne has the highest population density of 1995
persons per sq km. The lowest population density is in
Goravarakatte with 0 persons per sq km in the district.
|
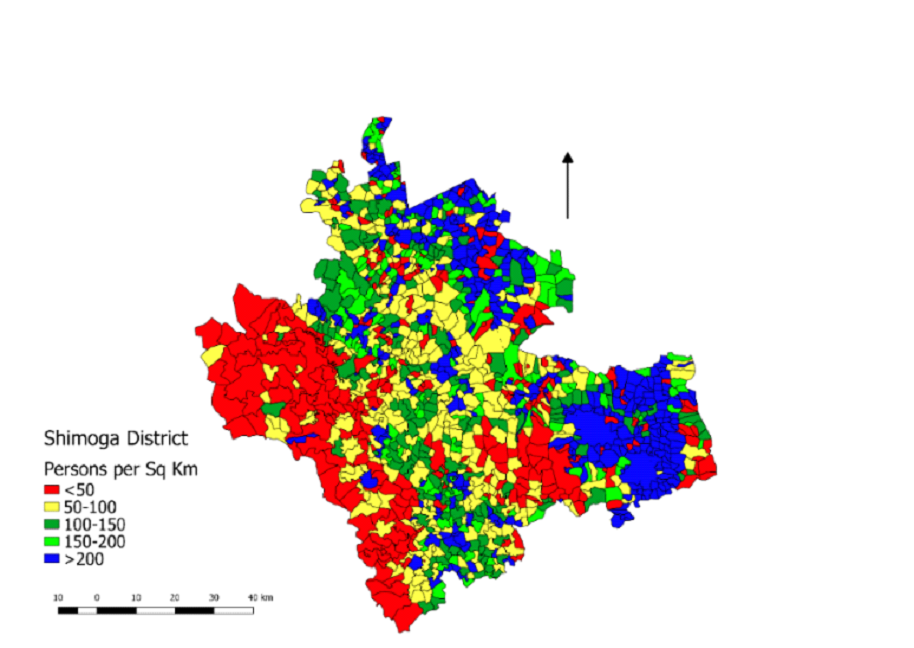
|
Tirthahalli (TP) has the highest population density of
8316 persons per sq km. The lowest population density is
in Maradi, with 0 persons per sq km in the district.
|
|
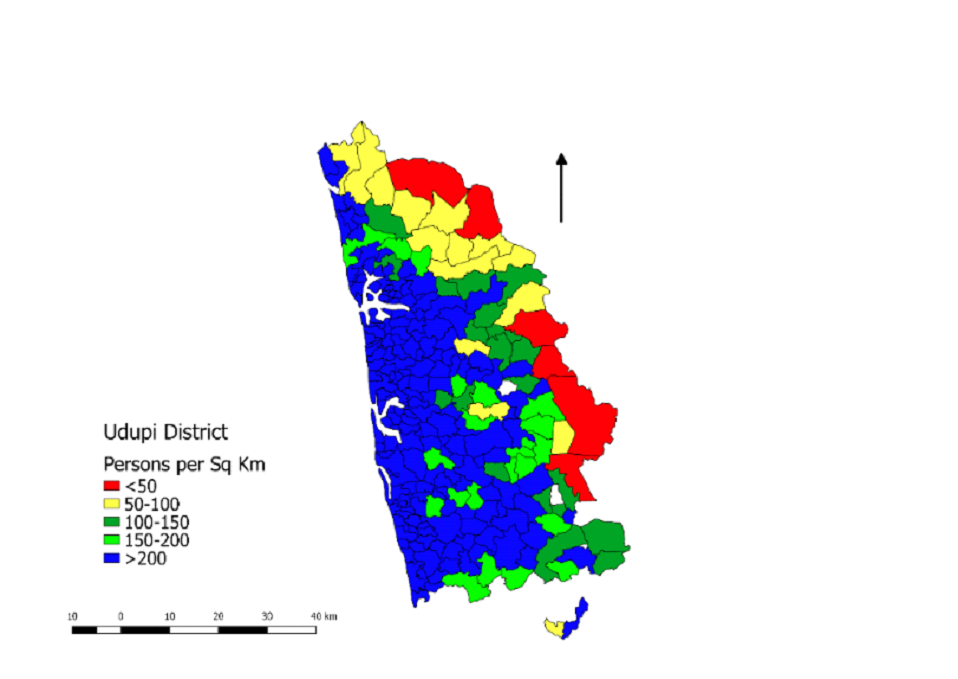
Udupi (CMC + OG) has the highest population density of
6422 persons per sq km. The district has the lowest
population density is in the reserved forests region
with 0 persons per sq km.
|
|
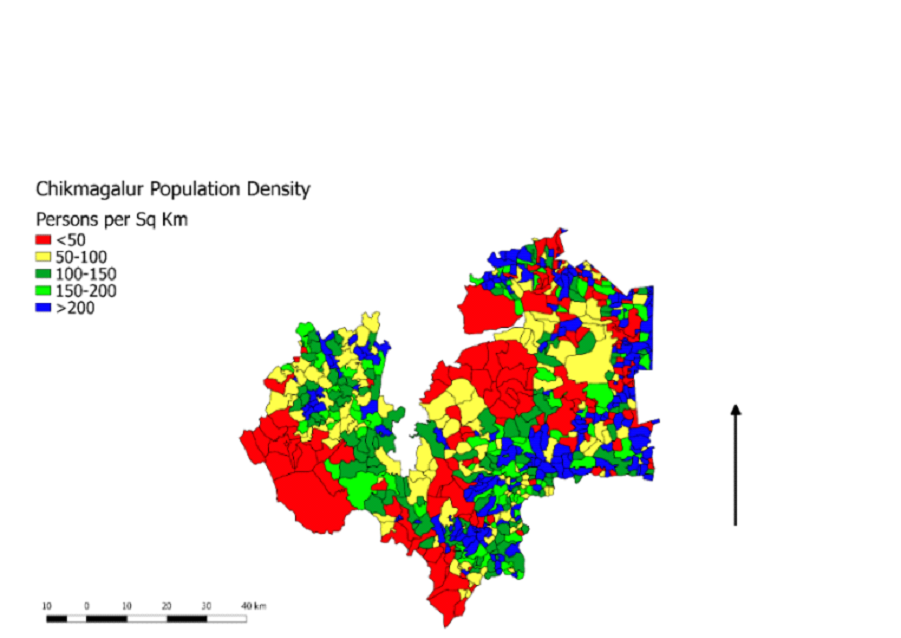
Chikmagalur (CMC) has the highest population density of
7104 persons per sq km. The lowest population density is
in Hipla, with 0 persons per sq km in the district.
|
|
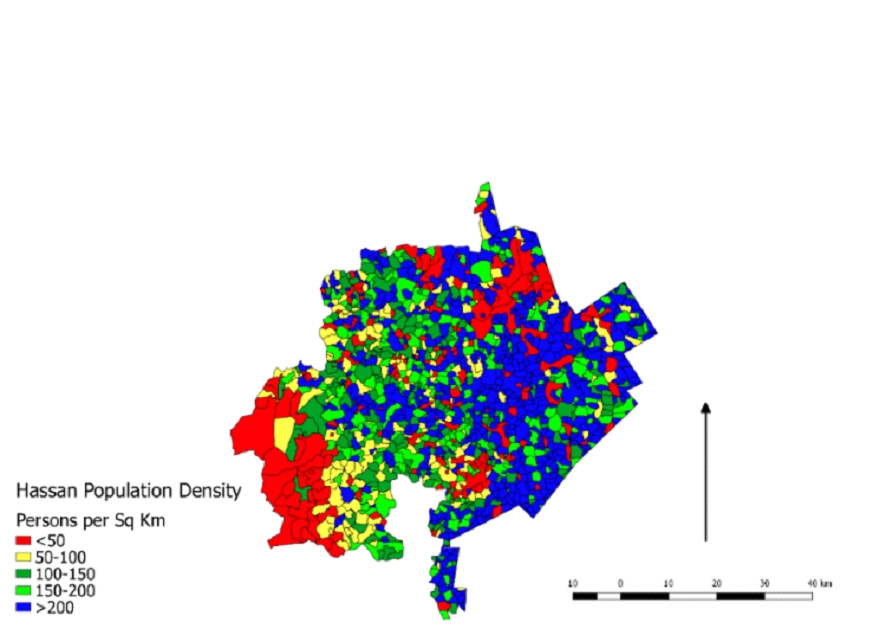
Sakleshpur (TMC) has 5917 persons per sq km with the
highest population density. The district has the lowest
population density in Kagenari State Forest with 0
persons per sq km.
|
|
Puttur (TMC) has the highest population density of 5266
persons per sq km. The lowest population density is in
Navara, with 15 persons per sq km in the district.
|
|
Madikeri (CMC) has the highest population density of
8065 persons per sq km. The lowest population density is
in Syandalkota Forest, with 0 persons per sq km in the
district.
|
|
Heggadadevankote has the highest population density of
1583 persons per sq km. The lowest population density is
in Bidagalu with 0 persons per sq km in the district.
|
|
Gundlupet (TMC) has the highest population density of
4518 persons per sq km. The lowest population density is
in Bandipura State Forest with 0 persons per sq km in
the district.
|
Forest Fragmentation
Land use data were used to characterize the fragmentation
levels around the forested areas in the southern Western Ghats.
A moving window algorithm developed by Riitters et al. (2000)
was used to perform the fragmentation. A 5×5 window was used to
calculate the Pf and Pff and categorize the various types of
fragmentation (Table 4 & Figure 3).
Pf= Proportion of number of forest pixels / Total
number of non-water pixels in the window
Pff=Proportion of the number of forest pixel pairs /
Total number of adjacent pairs of at least one forest pair.
The classification model identified five fragmentation
categories: Interior (Pf=1), Patch (Pf<0.4), Perforated (Pf>0.6
and Pf-Pff>0), Edge (Pf>0.6 and Pf-Pff<0), Transitional (0.4
0.6
).
Table 4. Forest Fragmentation Categories and their
description
| Fragmentation Component |
Description |
| Interior |
All pixels surrounding the center pixel are forest. |
| Patch |
A small forested area that surrounded by non-forested
areas.
|
| Perforated |
Forest pixels form the boundary between an interior
forest and relatively small clearings (perforations)
within the forested landscape
|
| Edge |
The boundary between interior forest and large
non-forested land cover features.
|
| Transitional |
Areas between edge type and non-forest type11. |
Figure 3. KERNEL (5×5) used for computation of Pf and Pff
The conflict data was collected from secondary sources like
newspapers, articles, journals, Government reports, and research
papers. The affected villages and areas were marked on Google
Earth and overlaid on the fragmentation map of SWG to pinpoint
the relationship between the fragmentation of forest land with
human conflict with wildlife (Figure 4). The forest
fragmentation spatial locations and demarcated human-animal
conflict areas were correlated as most of the animal conflicts
occur in fragmented and degraded forest patches and in locations
dominated by monoculture plantations.
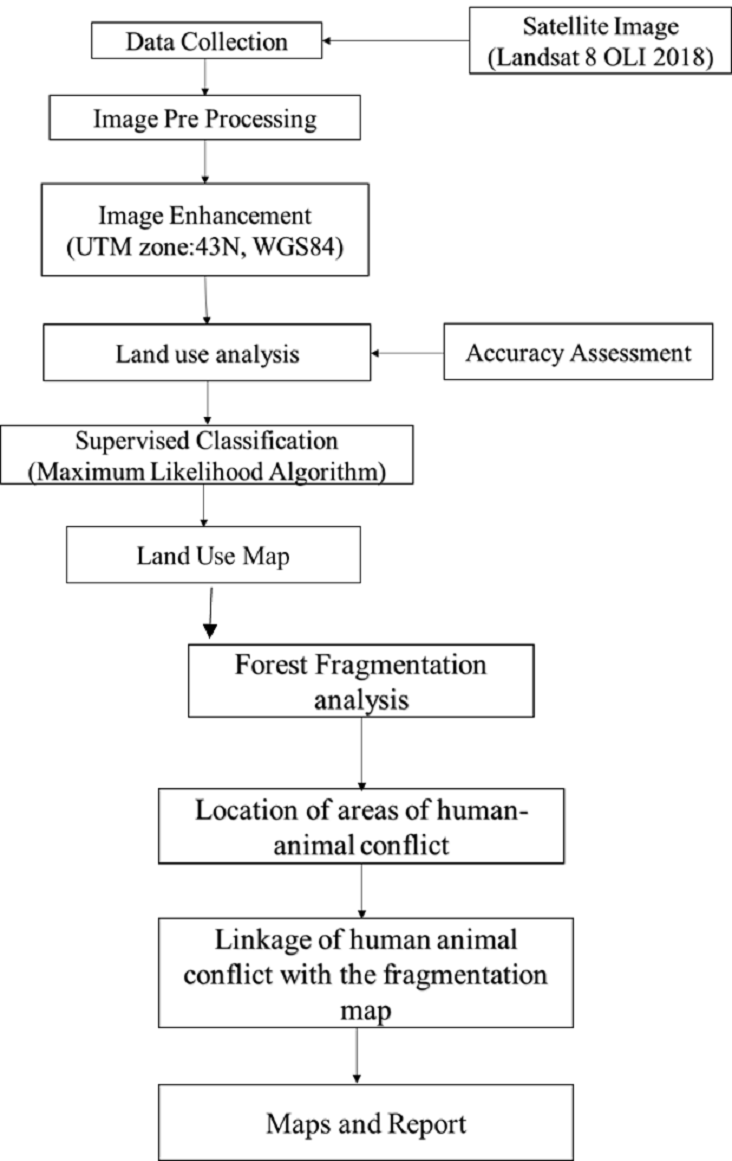
Figure 4. Framework of Methodology used in the study