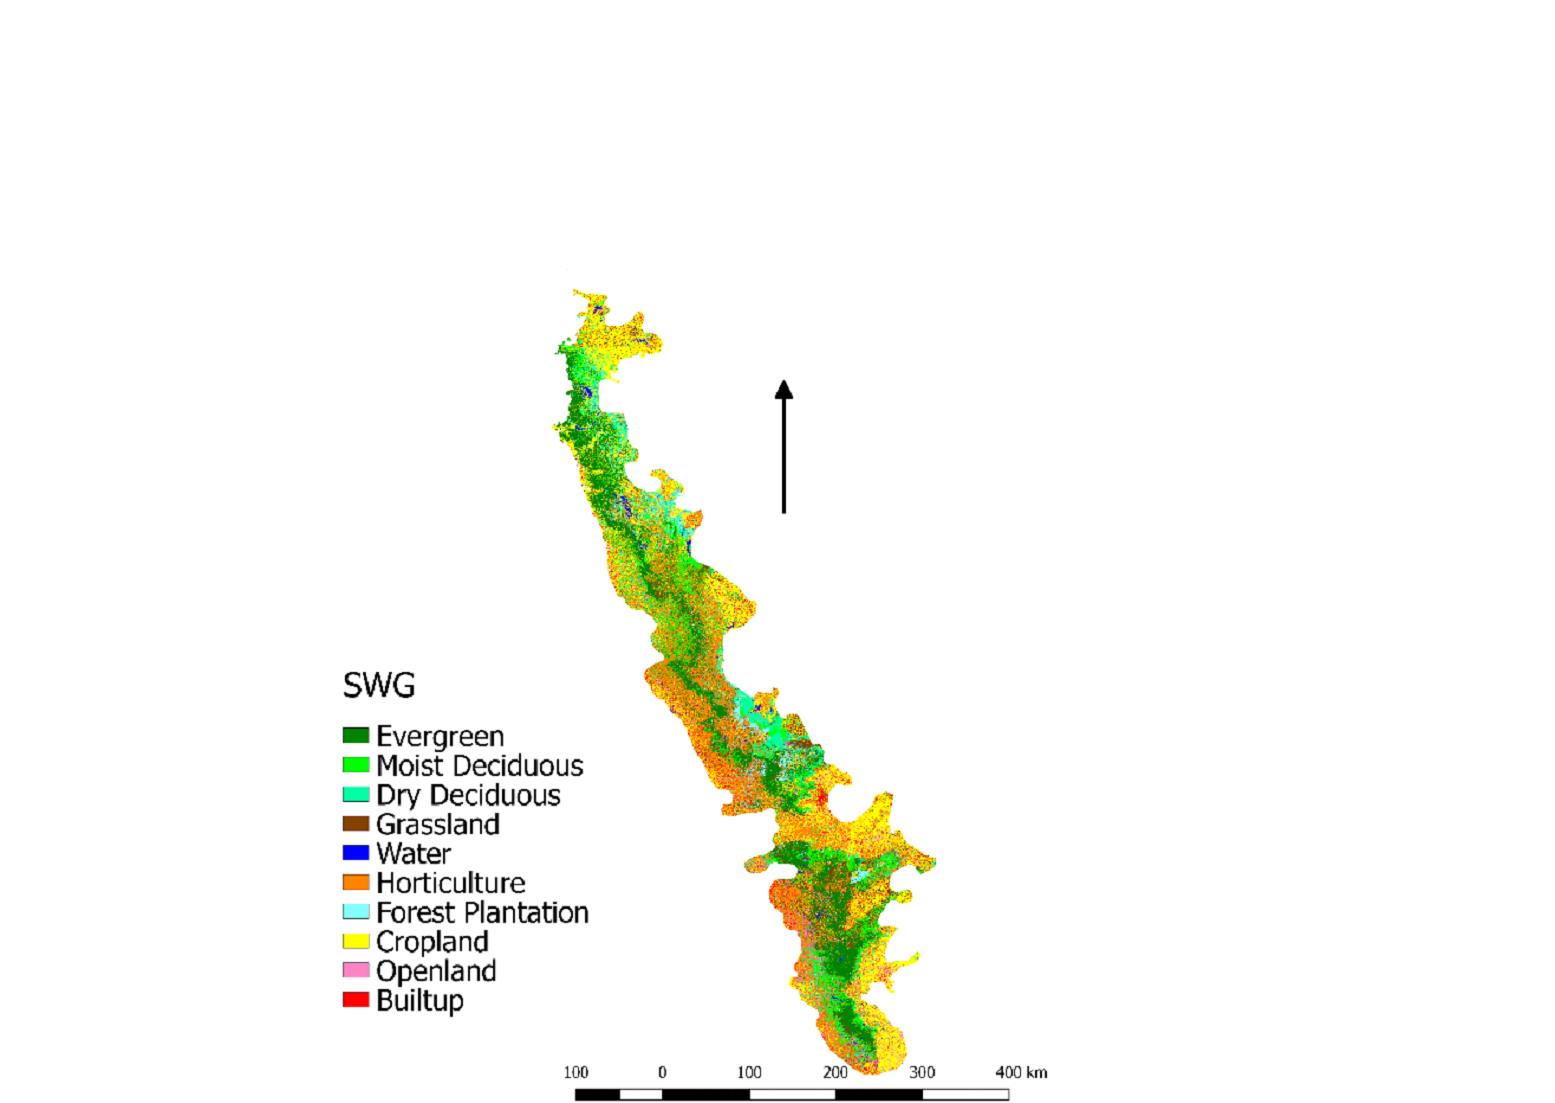
Land Use of SWG
The total forest cover of the southern Western Ghats is
39.2%. The state-wise forest cover shows that Karnataka has
17.6% of the total area, Kerala has 12.3%, whereas Tamil Nadu
has 9.5%.
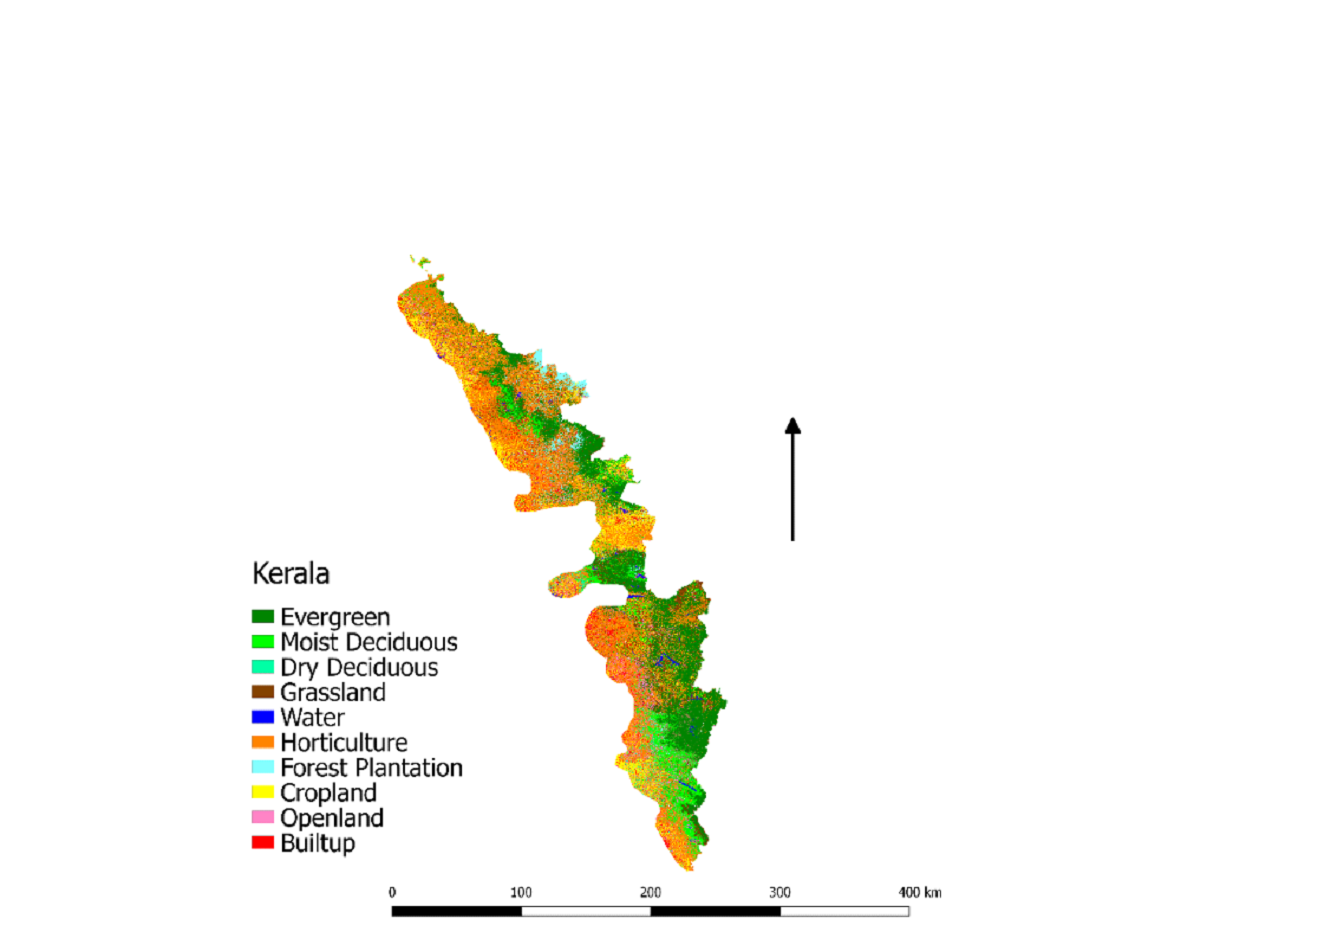
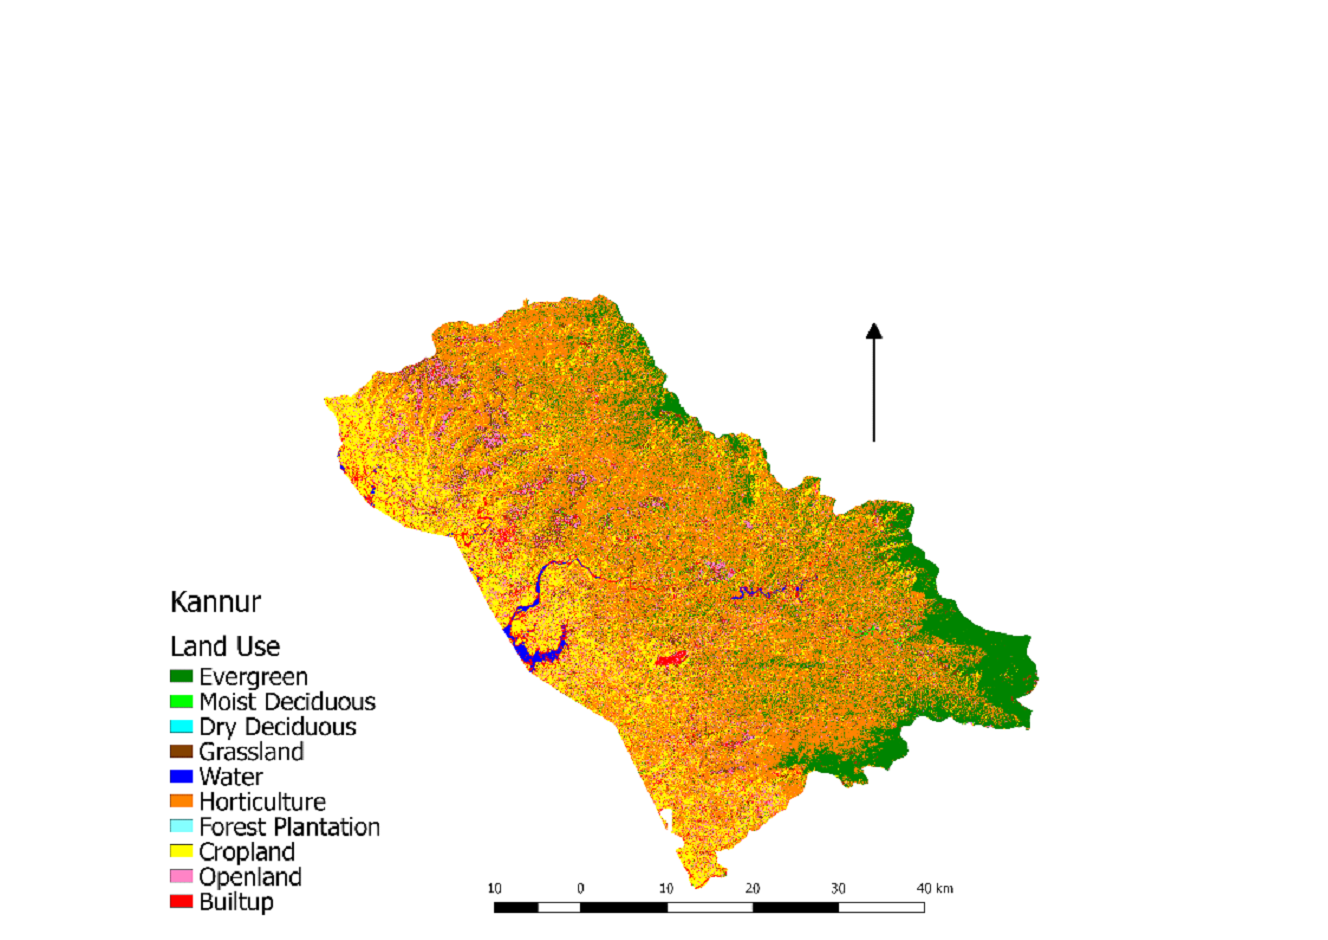
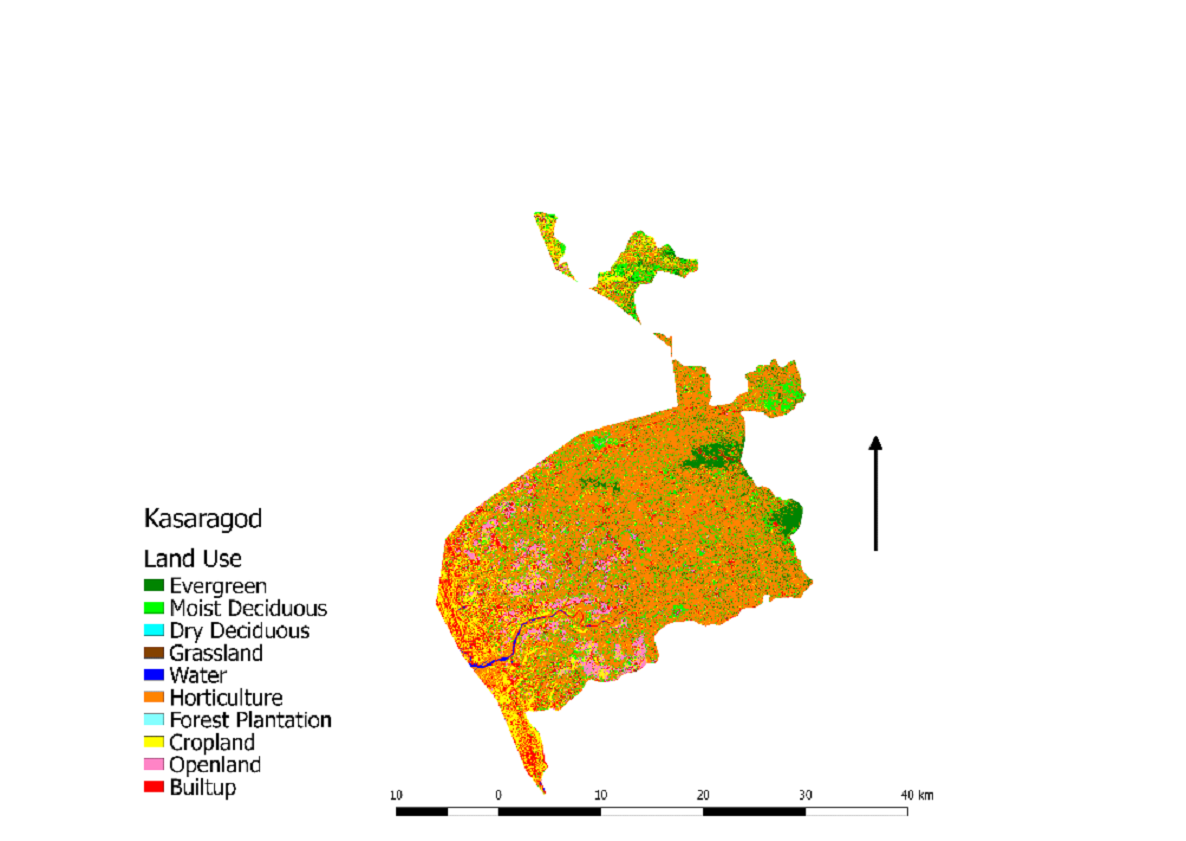
Land use of Kerala
Kerala mainly has 5 categories of forest types, i.e.,
Tropical wet evergreen forest, Tropical Moist Deciduous forest,
Tropical dry deciduous forest, Shola forest, and Grasslands.
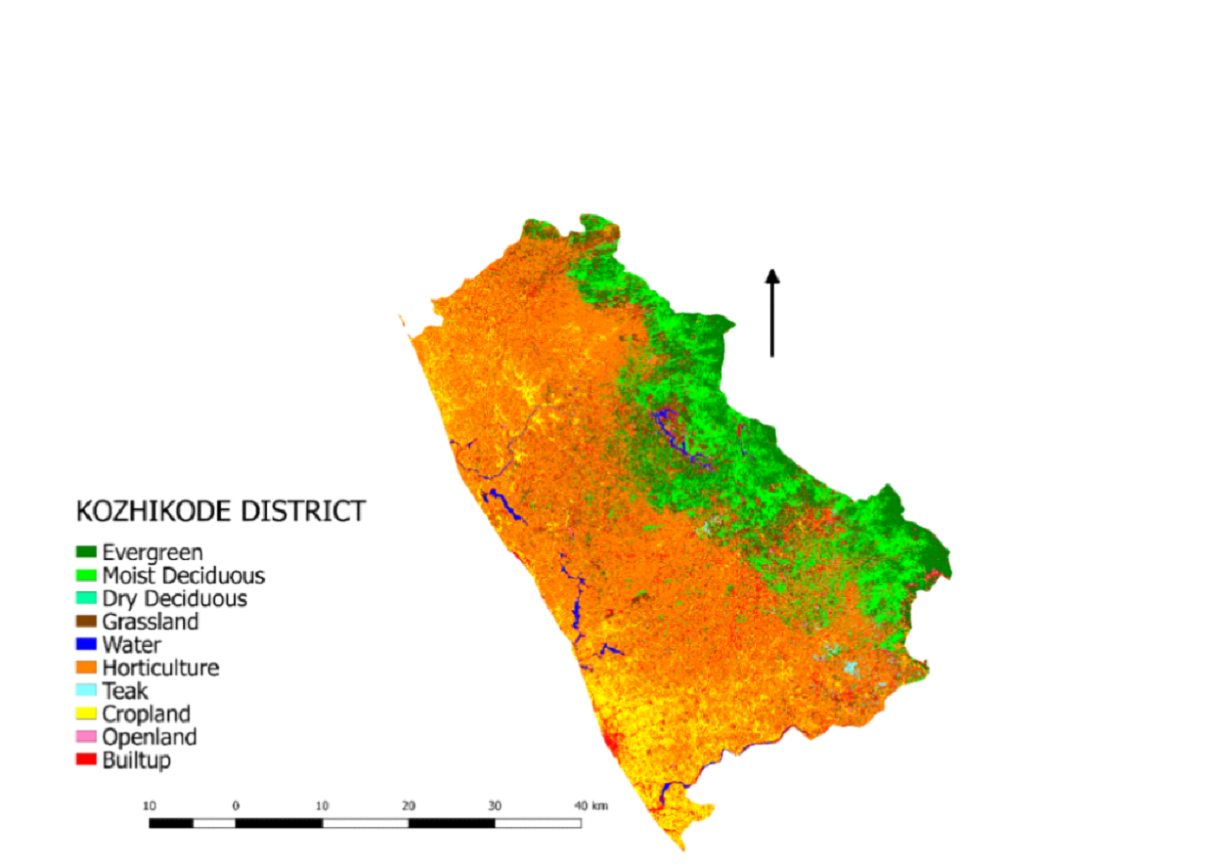
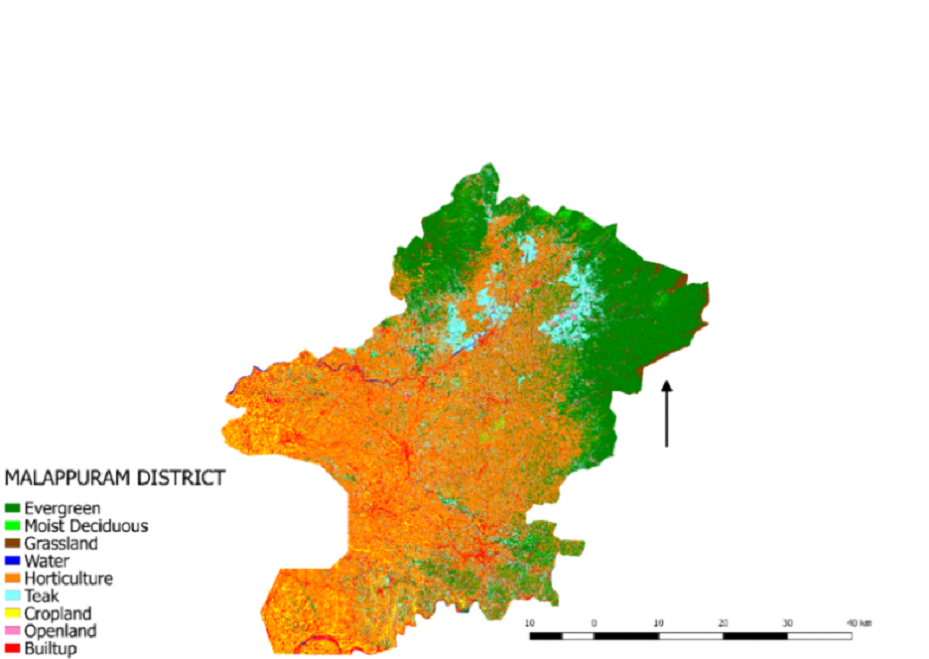
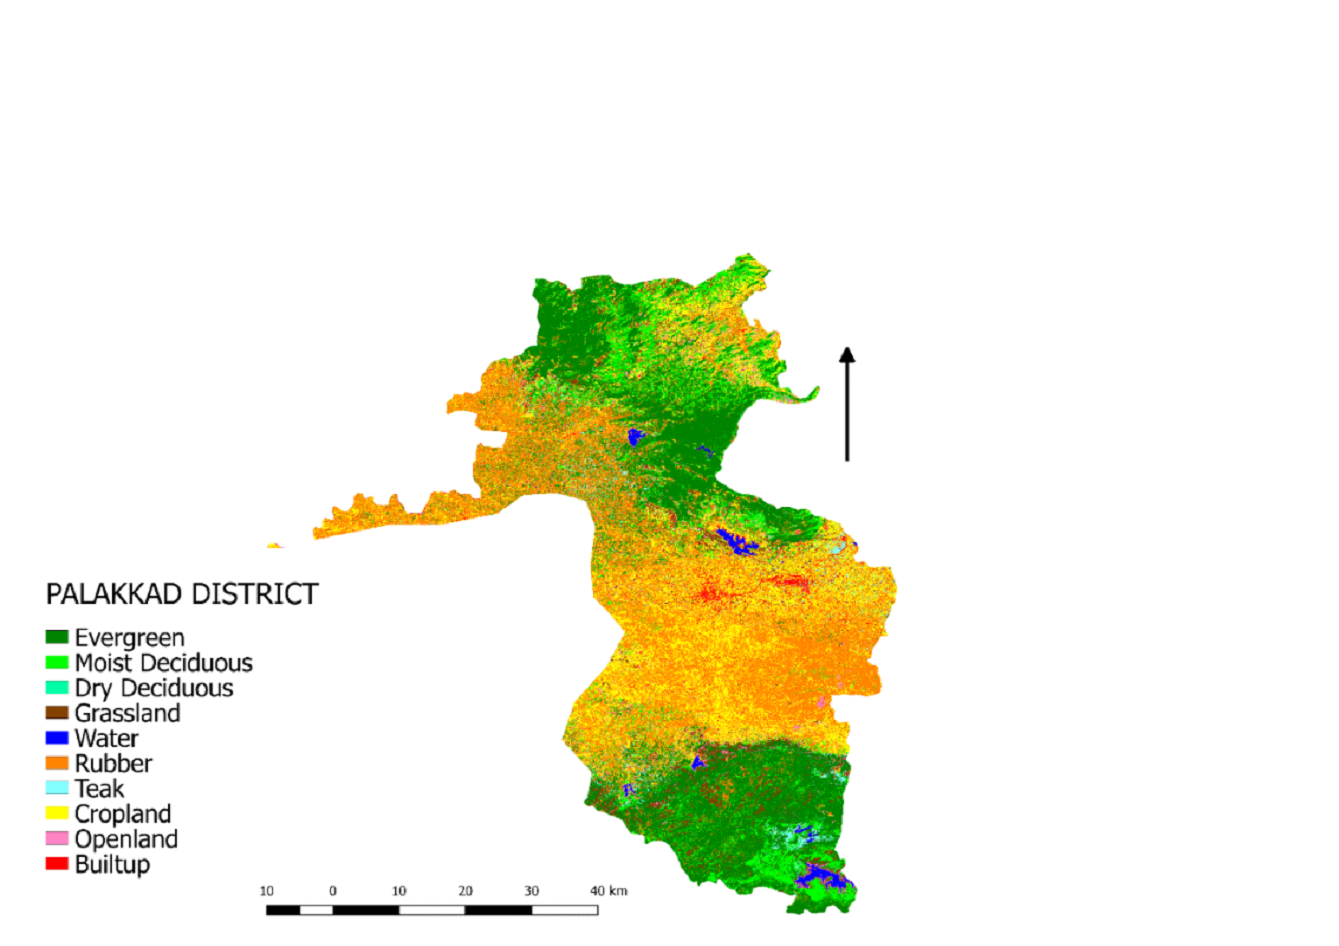
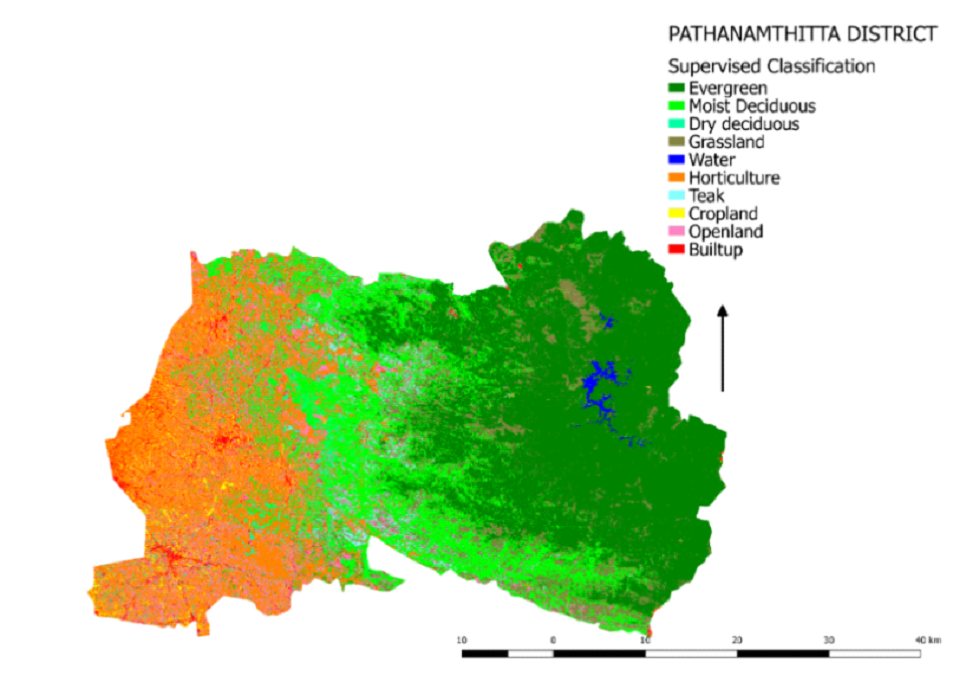
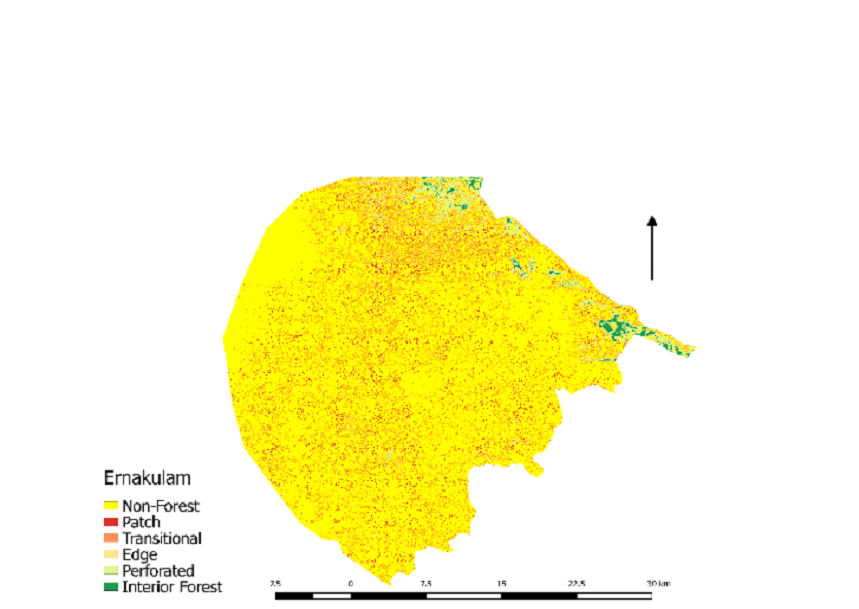
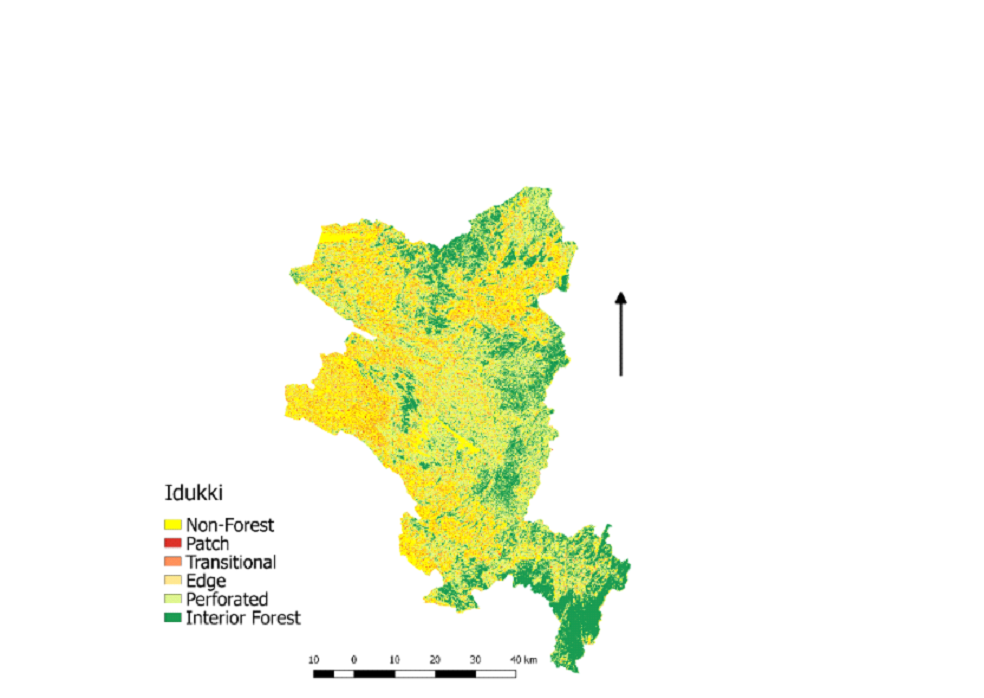
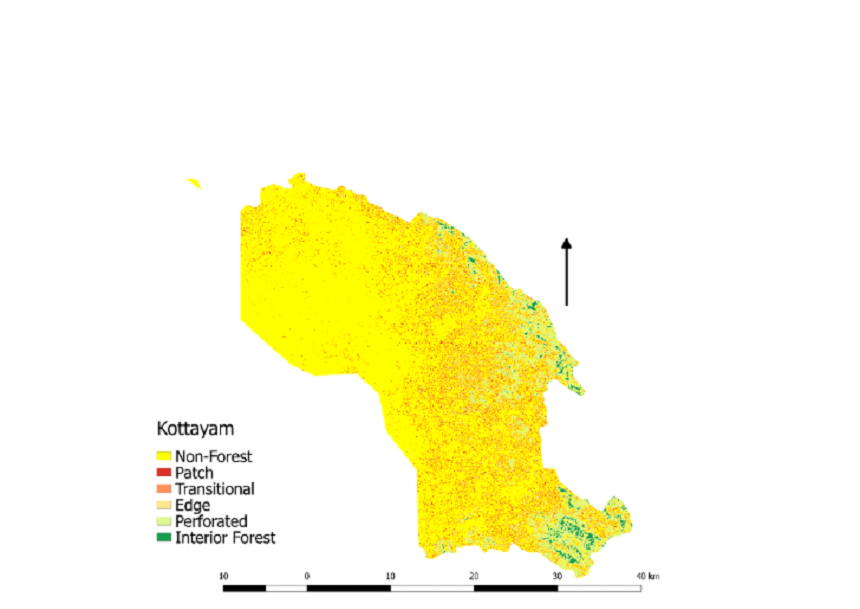
Land Use of Kerala shows overall forest cover in the Kerala
region of Western Ghats. The maximum land use is under
horticulture (2278.72 sq km), with Malappuram having the maximum
horticulture area of 43.5%, which primarily includes rubber and
coconut. The cropland covers 3095.54 Km2 in Palakkad with the
maximum cropland in Kerala (Table 5). This trend of increase in
horticulture from cropland can be termed as coconut (Cocos
nucifera) and rubber (Hevea brasiliensis) boom
(Kumar, 2006) .
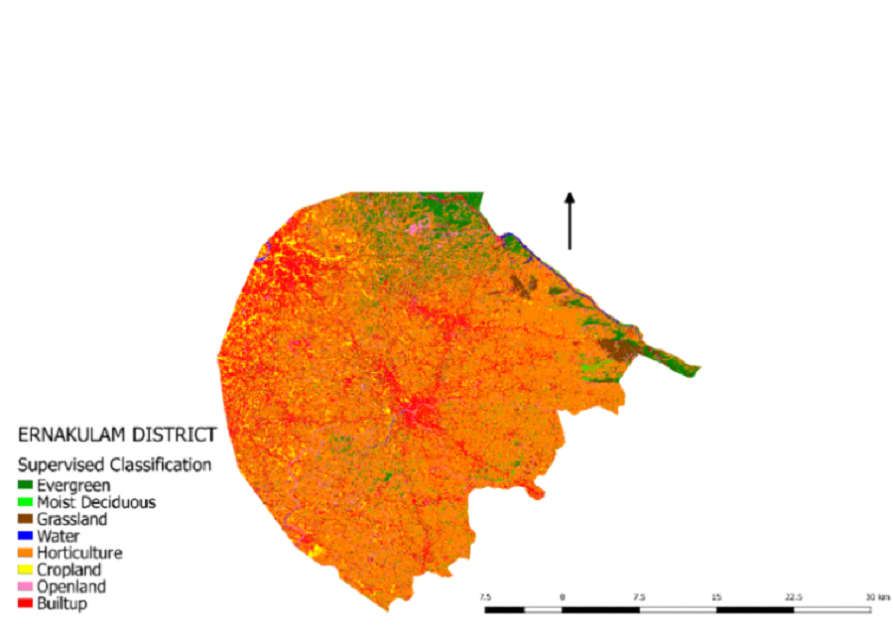
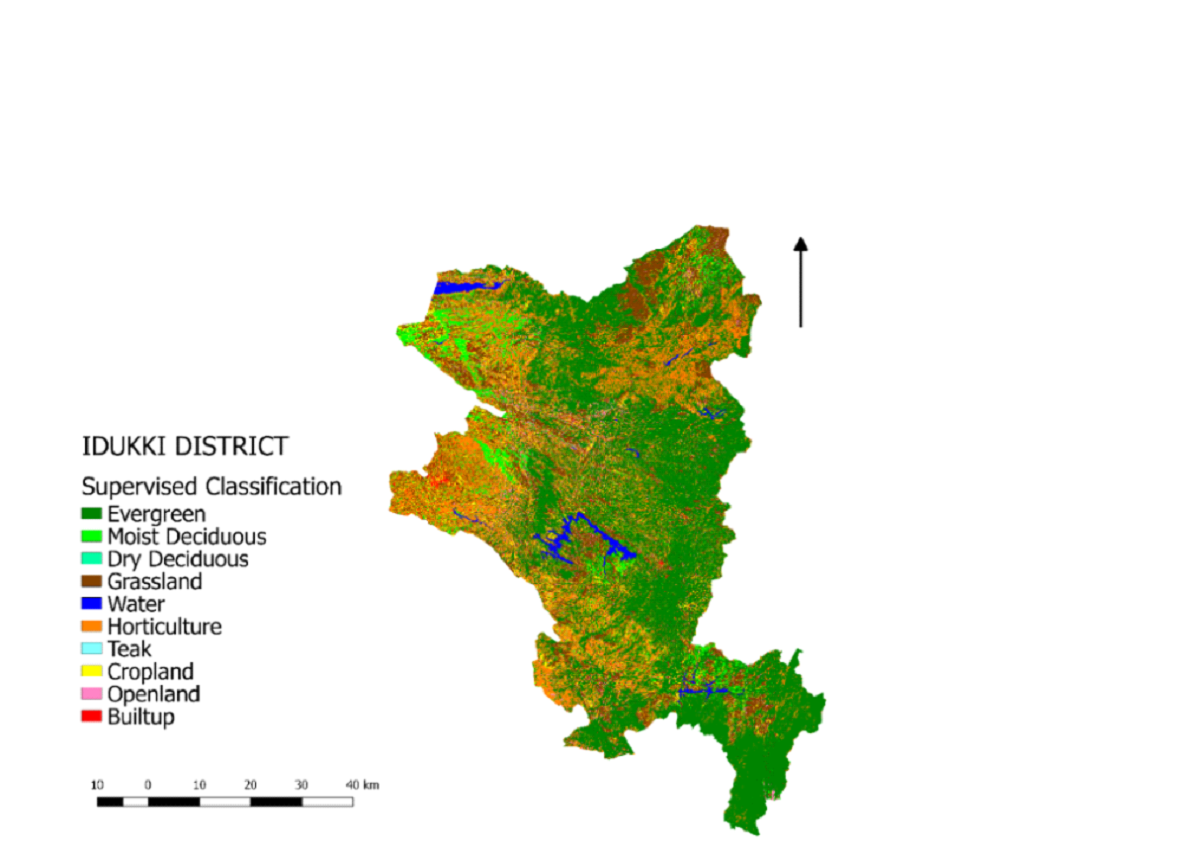
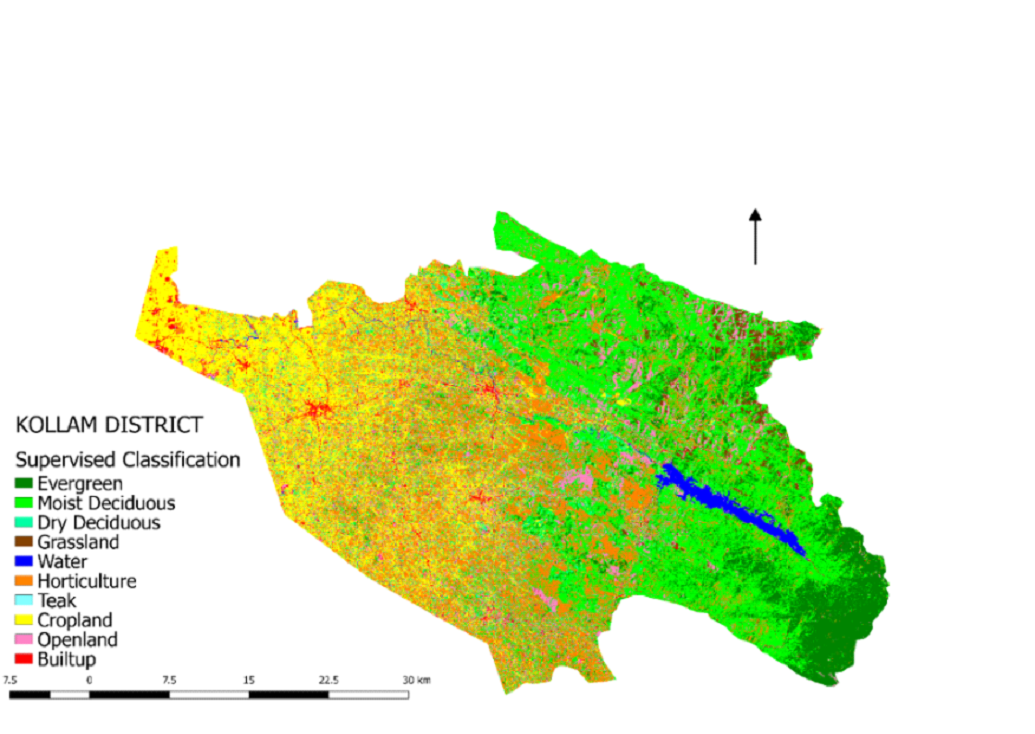
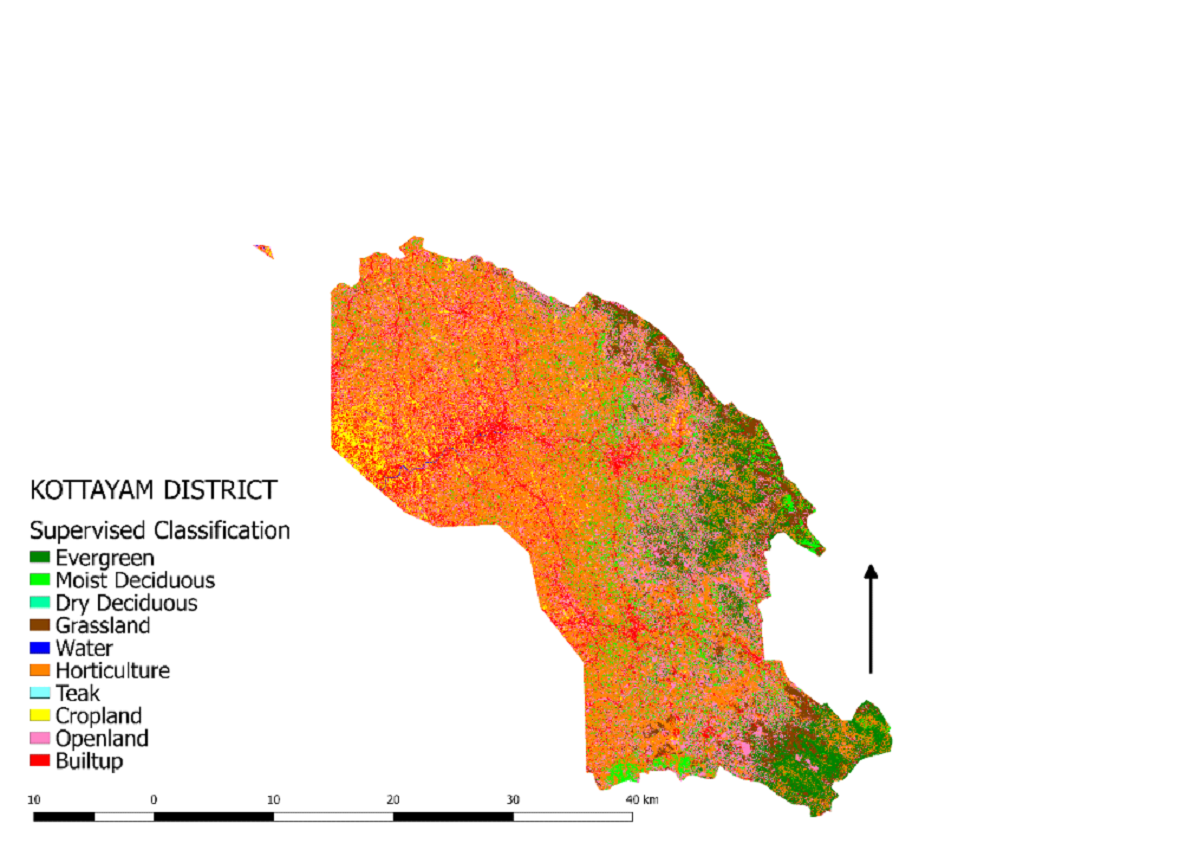
Kerala's predominating land cover category is horticulture,
covering 29.75% of the geographical area (Table 6). The forest
cover was observed to be maximum in Idukki district with 45% of
forest cover as compared to the other districts, whereas
Alappuzha has minimum forest over. Alappuzha is the only
district in Kerala without any forest cover. According to FSI
report 2015, the forest cover of Kerala has been increased to
19239 sq km from 17922 sq km in the 2013 assessment. According
to the recent FSI 2017, the forest cover in Kerala has further
increased to 2.7%, i.e. 1043 sq km, compared to 2015. The Kerala
forest cover is around 20321 sq km (52%). The present result
shows a slight decrease in forest cover, i.e. 45%, which can be
accounted for the increasing anthropogenic activities like
deforestation, monoculture, and land use for agricultural
activities. Increasing population has resulted in an increase in
urbanization, which affects the land use of any state. The total
built-up cover is 4.23% from the whole area, with Ernakulam
covering the maximum in the SWG region. The accuracy of
classification ranges from 0.78 to 0.85 (Kappa value).
Table 5. Land use statistics of Kerala
Table 6. Land Use analysis of Kerala part of SWG
| Land Use |
Land Use
Comment |
Land Use
|
The total forest cover of the southern Western Ghats is
39.2%. The state-wise forest cover shows that Karnataka
has 17.6% of the total area, Kerala has 12.3% of the
total area, whereas Tamil Nadu has 9.5%.
|
|
The maximum land use is under horticulture (2278.72 Km2)
in Kerala. The cropland covers 3095.54 Km2, with
Palakkad having the maximum cropland in Kerala. Kerala
forest cover is 45% of the total area.
|
|
Evergreen- 56.95 sq km
Moist Deciduous- 13.91 sq km
Grassland- 82.50 sq km
|
|
Evergreen- 2272.02 sq km
Moist Deciduous- 291.41 sq km
Grassland- 915.73 sq km
|
|
Evergreen- 109.65 sq km
Moist Deciduous- 591.72 sq km
Dry Deciduous- 96.37 sq km
Grassland- 43.11 sq km
|
|
Evergreen- 88.28 sq km
Moist Deciduous- 69.45 sq km
Grassland- 80.50 sq km
|
|
Evergreen- 248.39 sq km
Moist Deciduous- 253.97 sq km
Grassland- 196.36 sq km
|
|
Evergreen- 776.97 sq km
Moist Deciduous- 46.66 sq km
Grassland- 115.98 sq km
|
|
Evergreen- 1040.19 sq km
Moist Deciduous- 368.16 sq km
Grassland- 178.54 sq km
|
|
Evergreen- 836.54 sq km
Moist Deciduous- 413.05 sq km
Dry Deciduous- 54.91 sq km
Grassland- 191.20 sq km
|
|
Evergreen- 278.24 sq km
Moist Deciduous- 113.48 sq km
Dry Deciduous- 62.81 sq km
Grassland- 85.83 sq km
|
|
Evergreen- 136.34 sq km
Moist Deciduous- 335.48 sq km
Dry Deciduous- 13.02 sq km
Grassland- 81.30 sq km
|
|
Evergreen- NA
Moist Deciduous- NA
Dry Deciduous- NA
Grassland- NA
|
|
Evergreen- 441.64 sq km
Grassland- 123.84 sq km
|
|
Evergreen- 388.20 sq km
Moist Deciduous- 15.85 sq km
Grassland- 170.79 sq km
|
|
Evergreen- 42.16 sq km
Moist Deciduous- 99.79 sq km
Grassland- 13.04 sq km
|
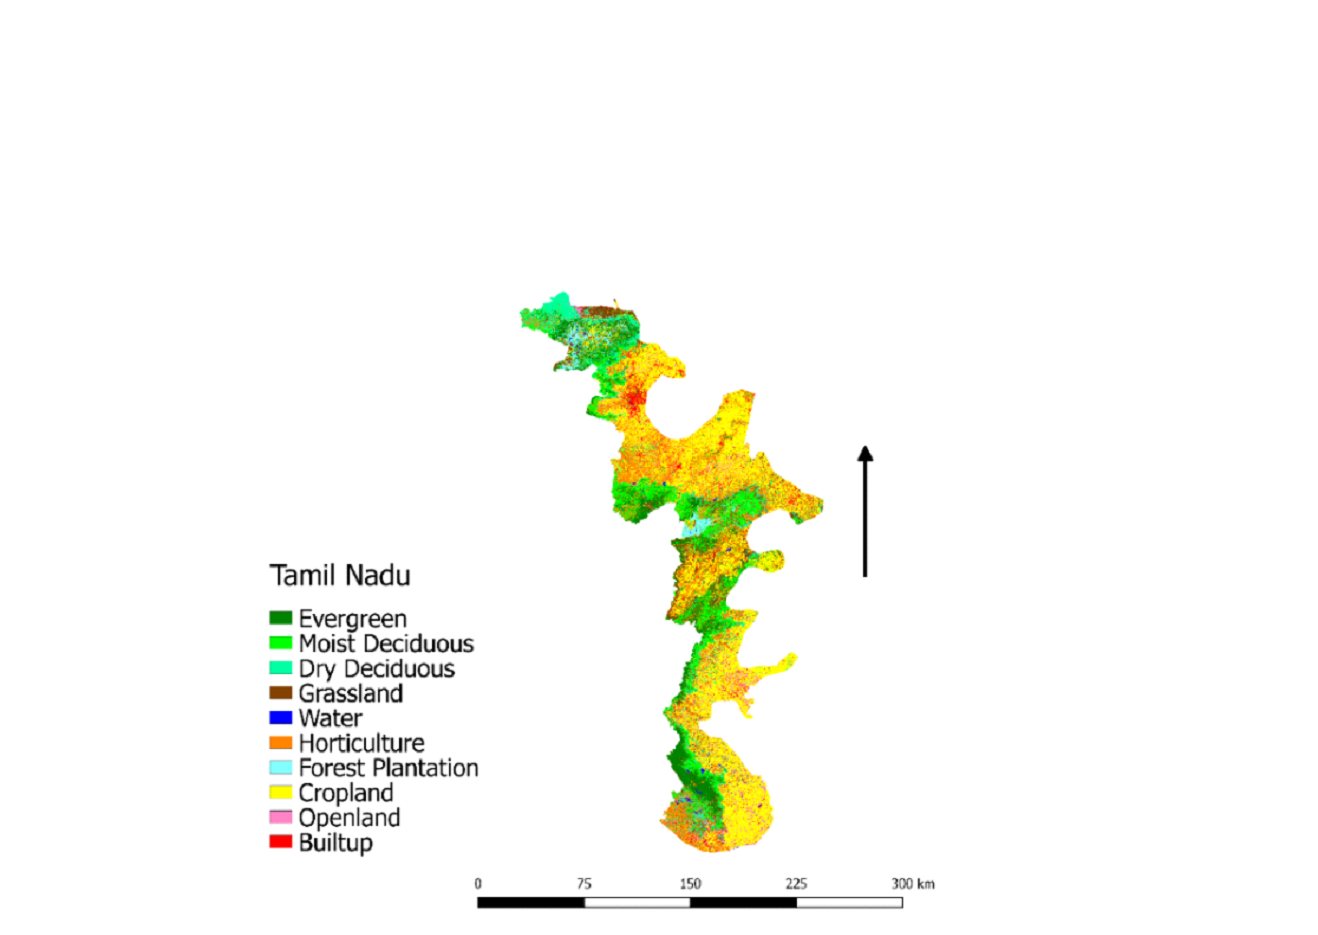
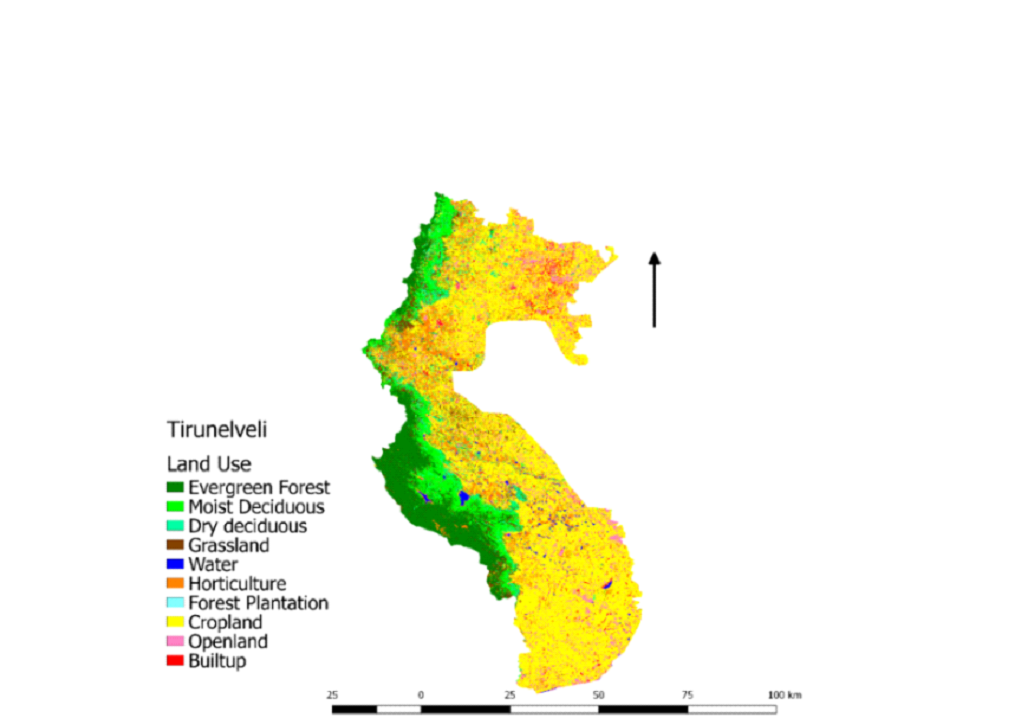
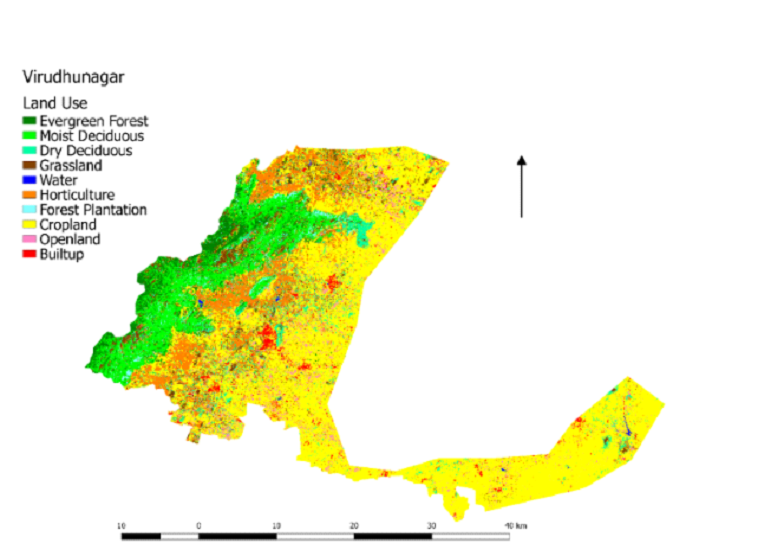
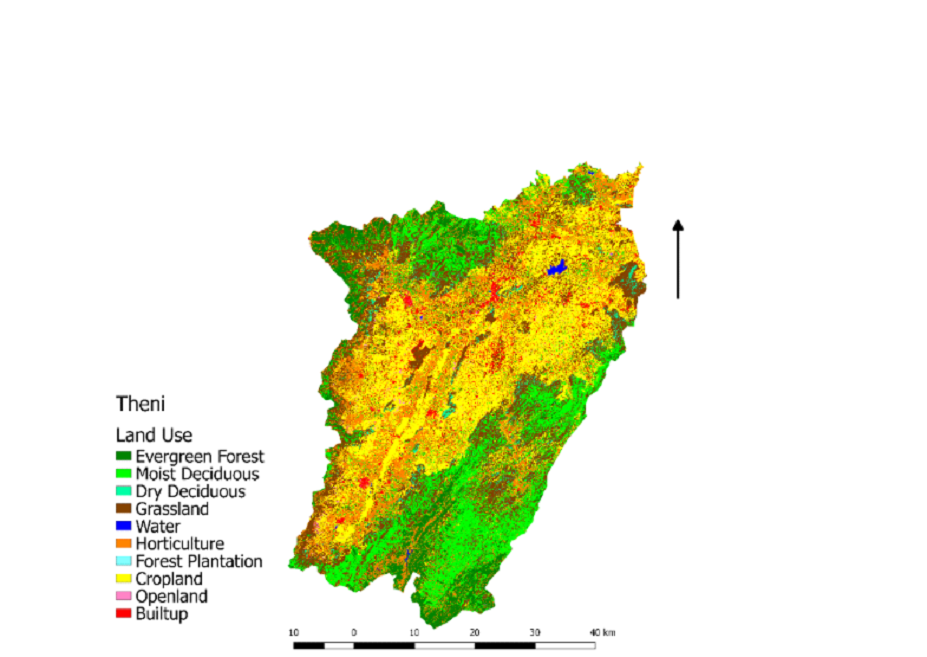
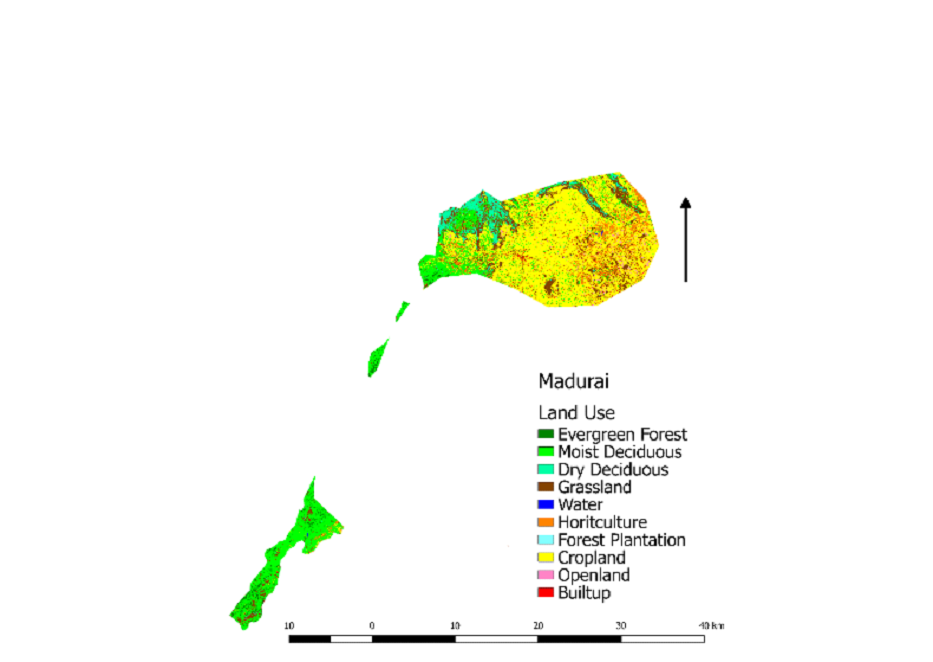
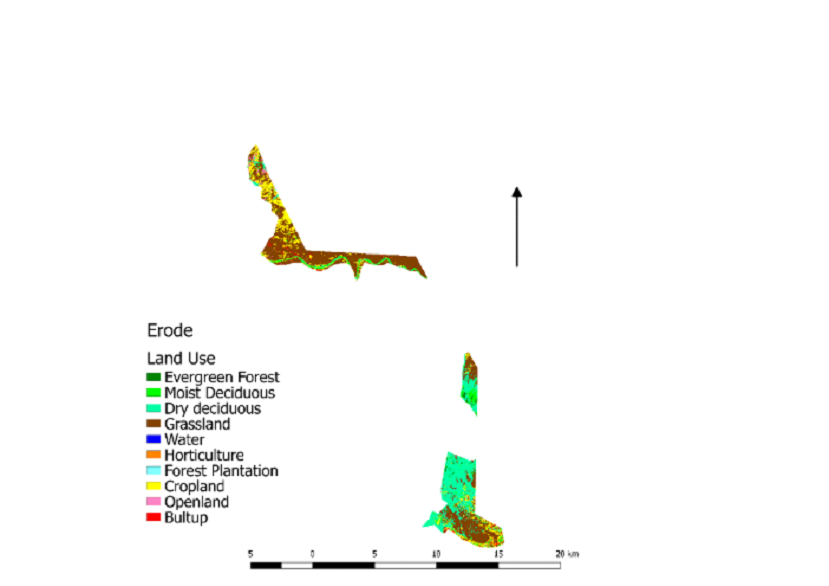
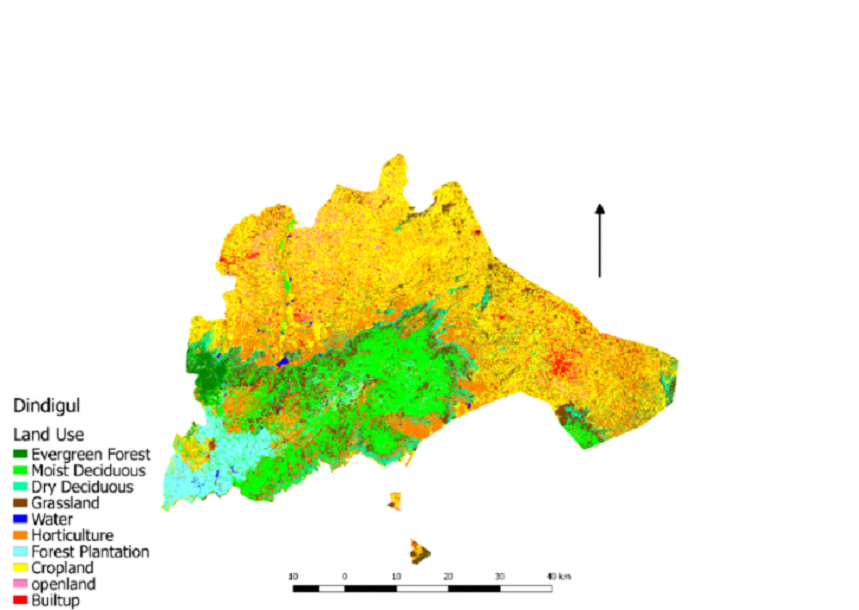
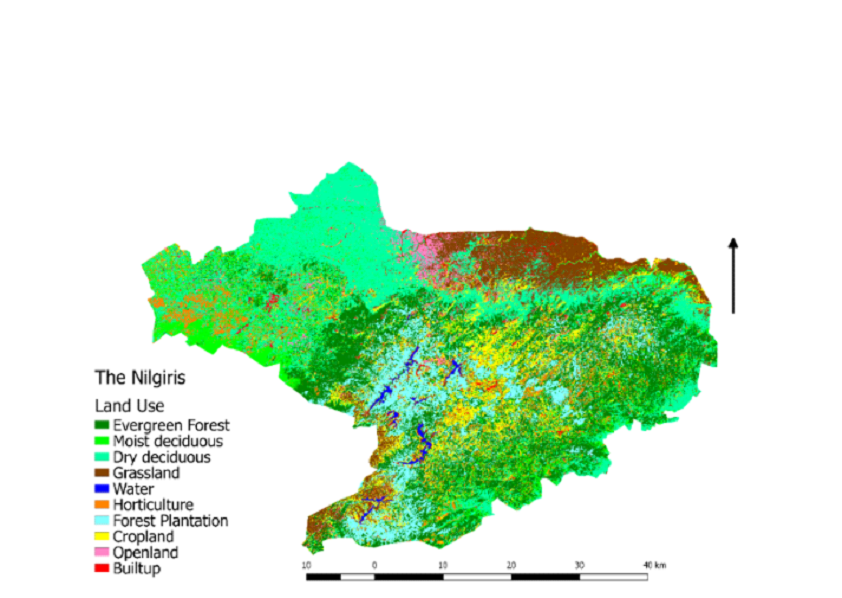
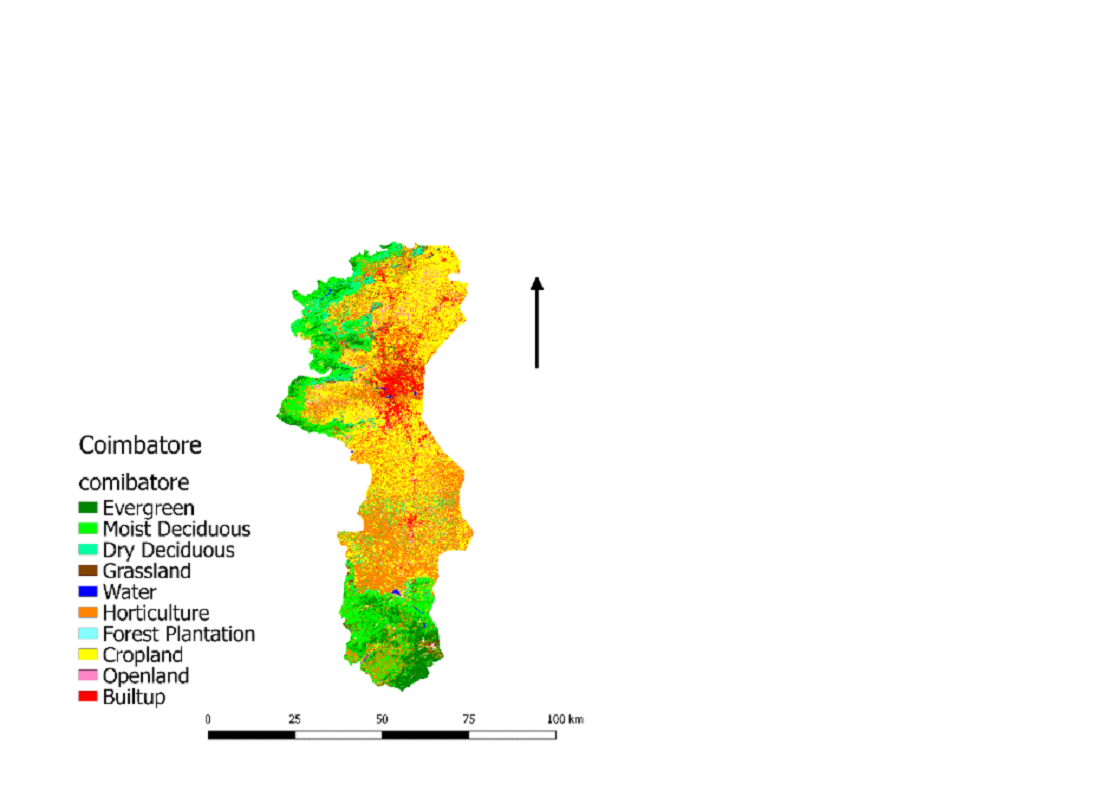
Land use of Tamil Nadu
Tamil Nadu mainly has Tropical evergreen (valleys,
hilltops),
Tropical moist deciduous, Tropical dry deciduous, Tropical
thorn,
and Montane subtropical forest as the major forest types. The
total
geographical cover of Tamil Nadu under the Western Ghats is
24534.54
sq km. The land use analysis depicts the dominating category in
the
State. The maximum area is covered by cropland with 31.20%, and
horticulture covers around 19.47% of the total area (Table 7).
Coconut and rubber plantations are dominant horticulture crops.
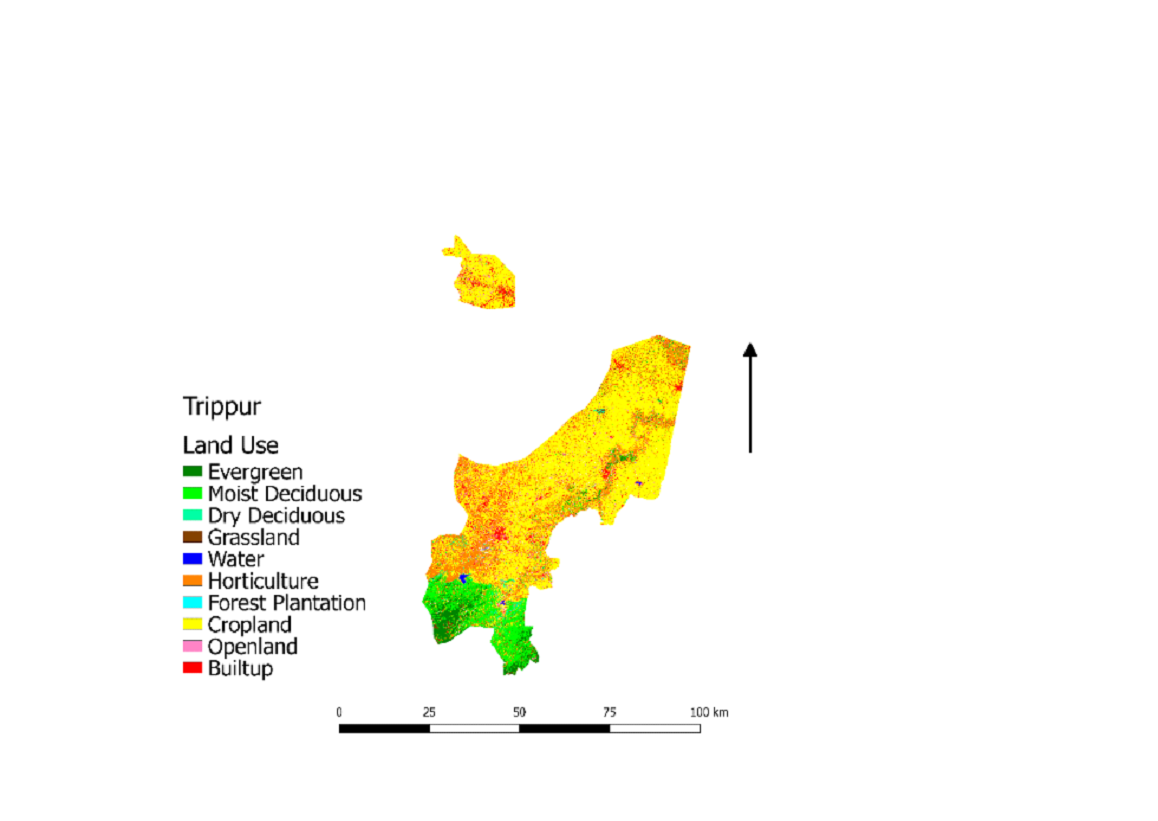
Tiruppur district has the maximum horticulture with 57.13%
of
the geographical area. The forest cover is mainly dominated by
moist
deciduous, shrubland, grassland, and scanty evergreen forests.
The
Nilgiris district in Tamil Nadu has the maximum forest cover,
with
evergreen covering 24% of the district's total area. This
district
harbors plenty of wildlife and endemic biodiversity, but the
current
increase in horticulture like coffee, tea, and rubber has
threatening the forest cover and biodiversity. As observed by
the
supervised classification, the total forest cover of Tamil Nadu
is
around 8839.66 sq km of SWG (Table 8). The rapid conversion of
forested land for agricultural activity is affecting the forest
cover in different districts of Tamil Nadu. The clearing of hill
slopes for plantation of tea and coffee has also lead to a
reduction
in forest cover of the State. The built-up was also observed to
be
more in Coimbatore than any other district of Tamil Nadu. The
accuracy assessment for the image ranges from 81 to 87% and
Kappa
value from 0.78 to 0.85.
Table 7. Land use statistics of Tamil Nadu
Table 8. Land Use Analysis of Tamil Nadu part of SWG
| Land use |
Comment |
|
The maximum area is covered by cropland with 31.20% of
the total area, whereas Horticulture covers around
19.47% of the total area. The Nilgiris district in Tamil
Nadu has the maximum forest cover, with evergreen
covering 24% of the district's total area.
|
|
Evergreen- 118.41 sq km
Moist Deciduous- 219.01 sq km
Dry Deciduous- 138.17 sq km
Grassland- 154.00 sq km
|
| District |
Statistics |
|
Evergreen- 559.06 sq km
Moist Deciduous- 395.80 sq km
Dry Deciduous- 235.88 sq km
Grassland- 238.99 sq km
|
|
Evergreen- 67.59 sq km
Moist Deciduous- 138.45 sq km
Dry Deciduous- 65.28 sq km
Grassland- 68.56 sq km
|
|
Evergreen- 231.53 sq km
Moist Deciduous- 488.34 sq km
Dry Deciduous- 43.53 sq km
Grassland- 694.54 sq km
|
|
Evergreen- 8.42 sq km
Moist Deciduous- 88.74 sq km
Dry Deciduous- 18.01 sq km
Grassland- 48.97 sq km
|
|
Evergreen- 0.50 sq km
Moist Deciduous- 2.78 sq km
Dry Deciduous- 14.28 sq km
Grassland- 26.66 sq km
|
|
Evergreen- 57.27 sq km
Moist Deciduous- 524.43 sq km
Dry Deciduous- 215.72 sq km
Grassland- 412.55 sq km
|
|
Evergreen- 618.71 sq km
Moist Deciduous- 216.30 sq km
Dry Deciduous- 695.37 sq km
Grassland- 268.85 sq km
|
|
Evergreen- 322.10 sq km
Moist Deciduous- 680.87 sq km
Dry Deciduous- 165.15 sq km
Grassland- 112.97 sq km
|
|
Evergreen- 113.30 sq km
Moist Deciduous- 286.24 sq km
Dry Deciduous- 23.13 sq km
Grassland- 61.20 sq km
|
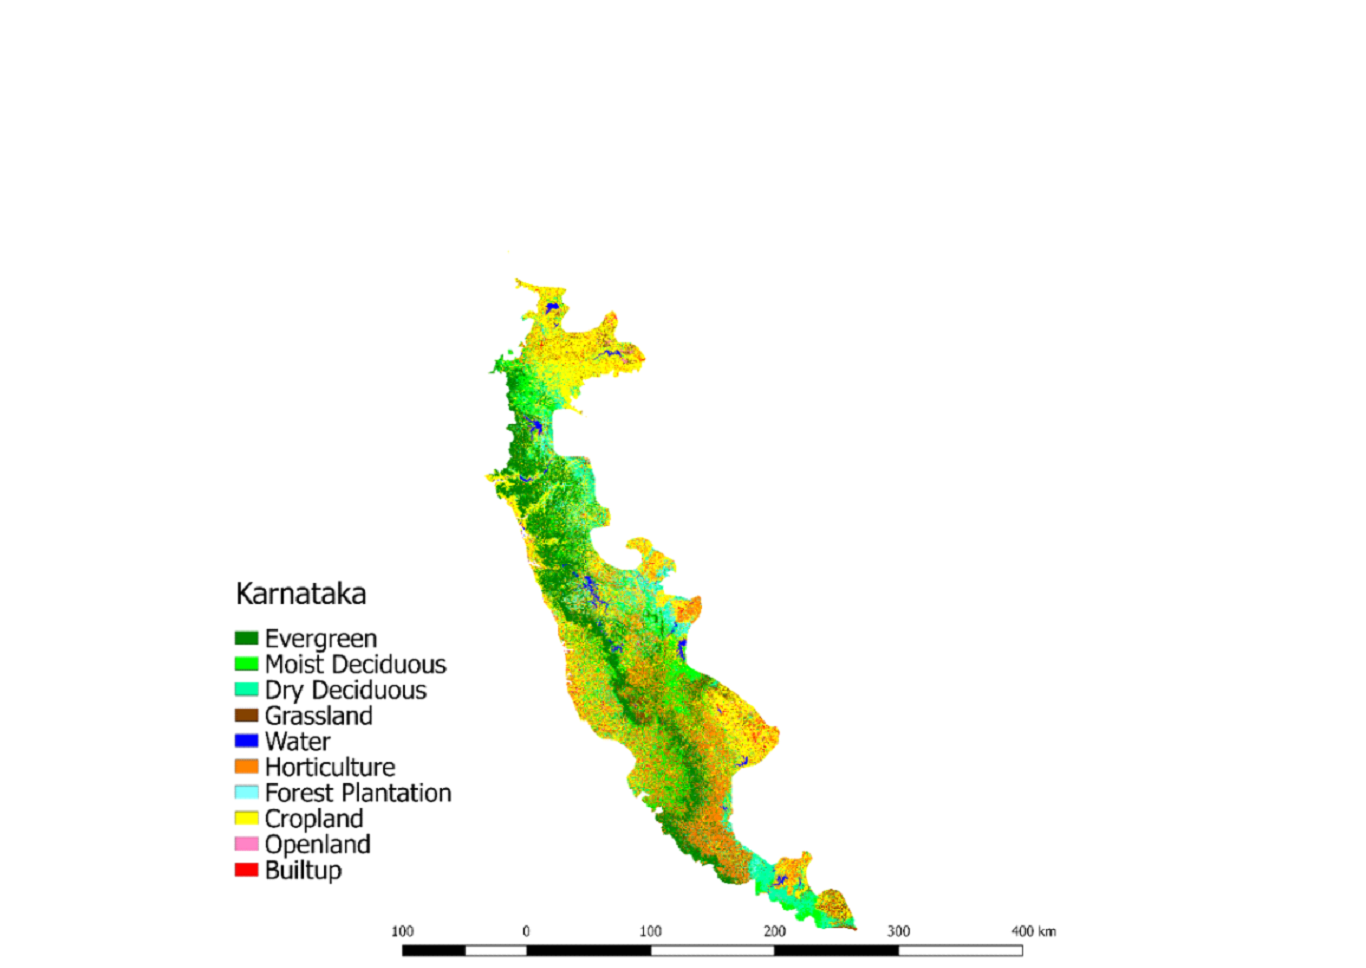
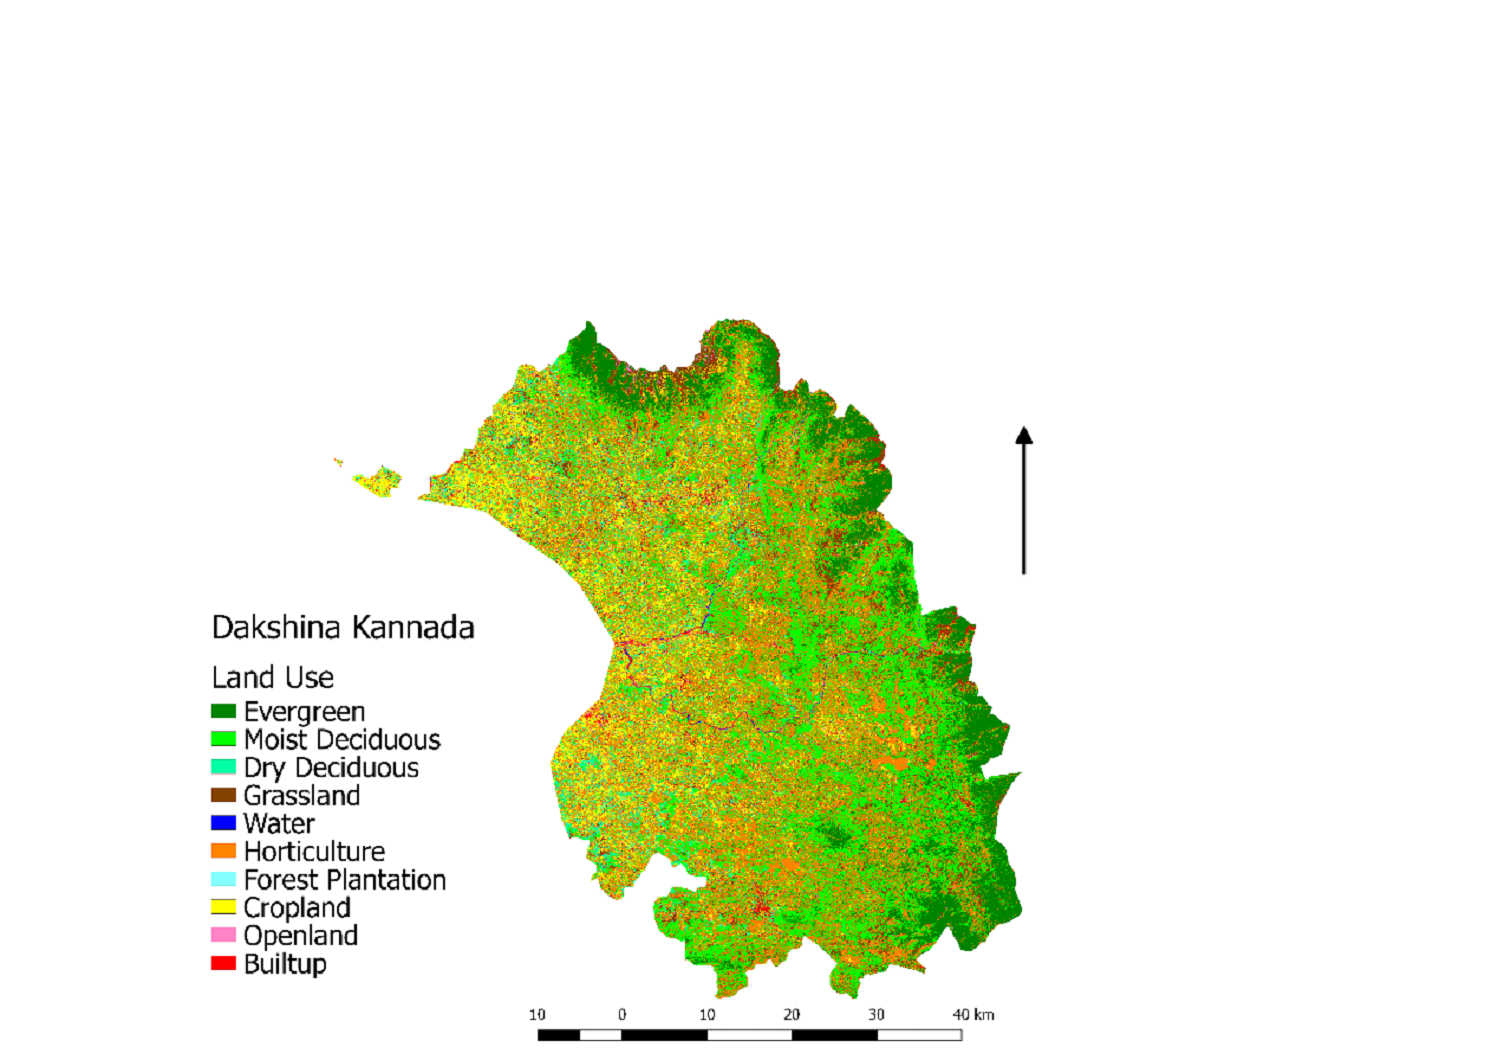
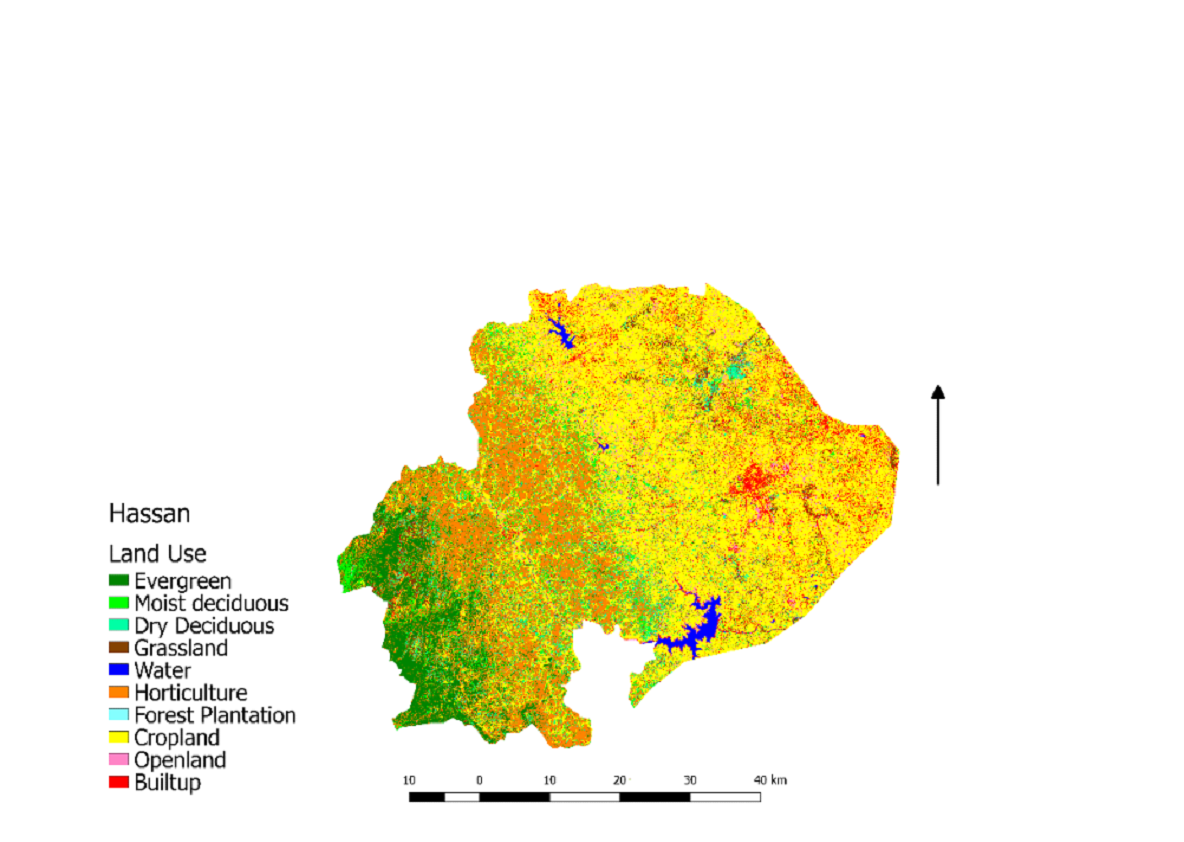
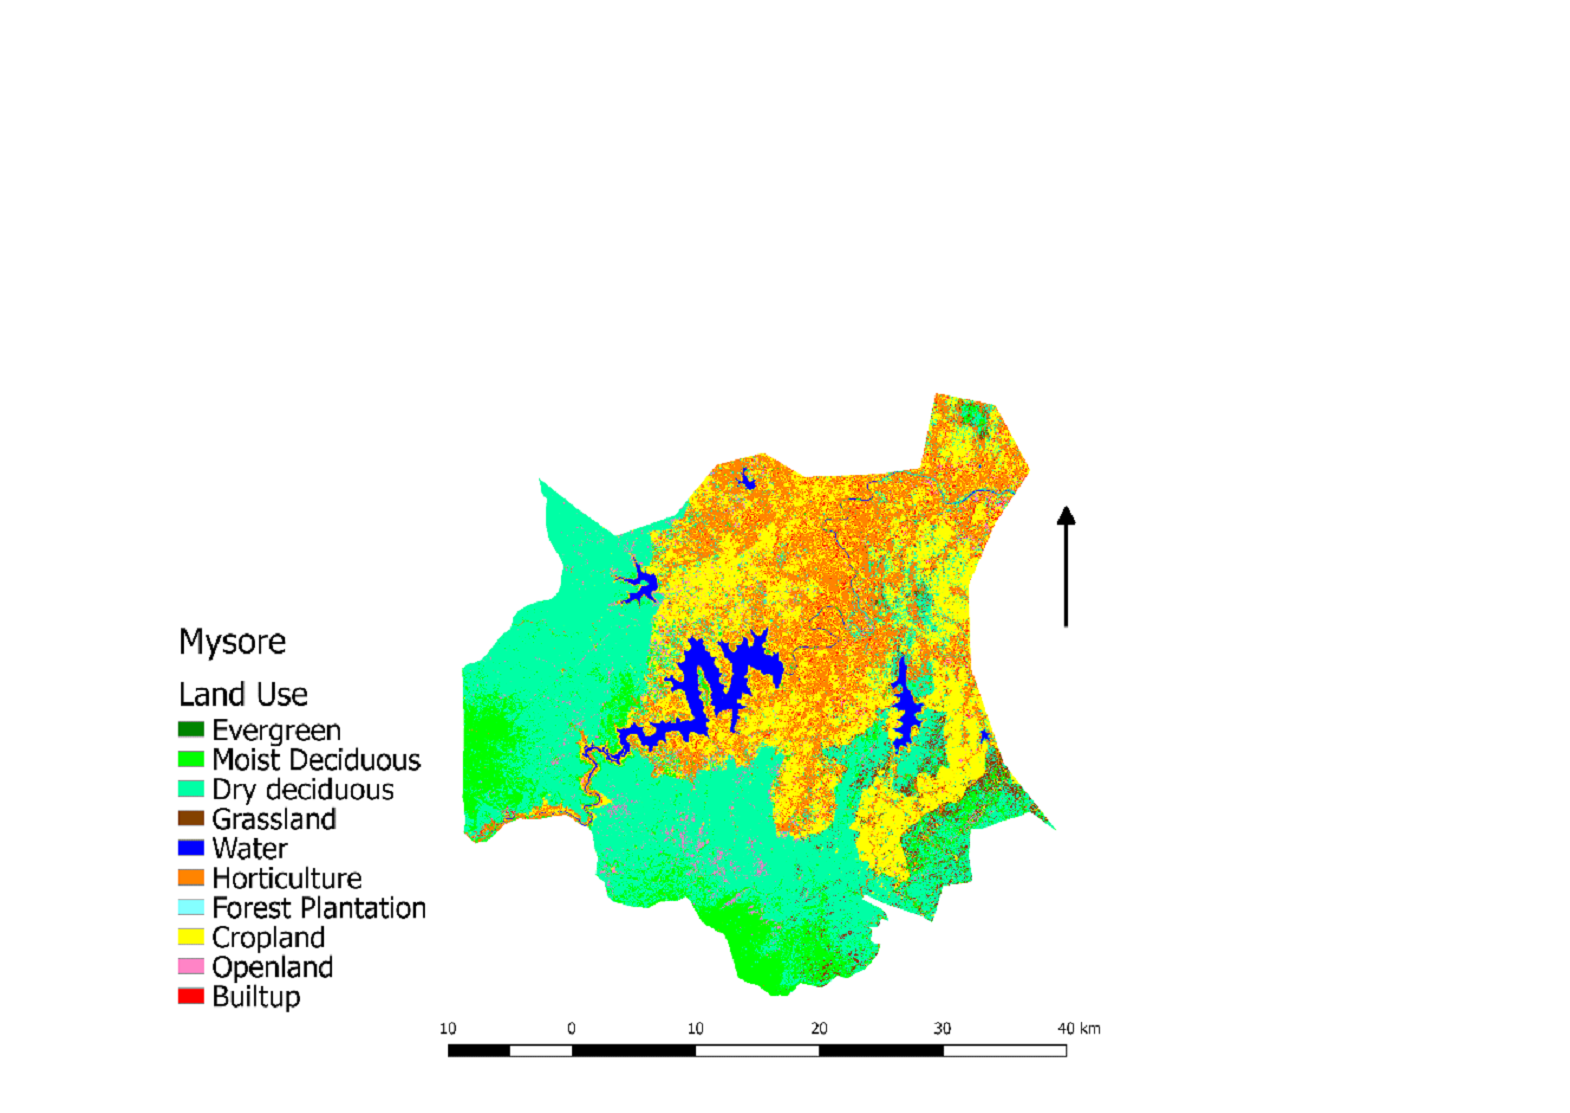
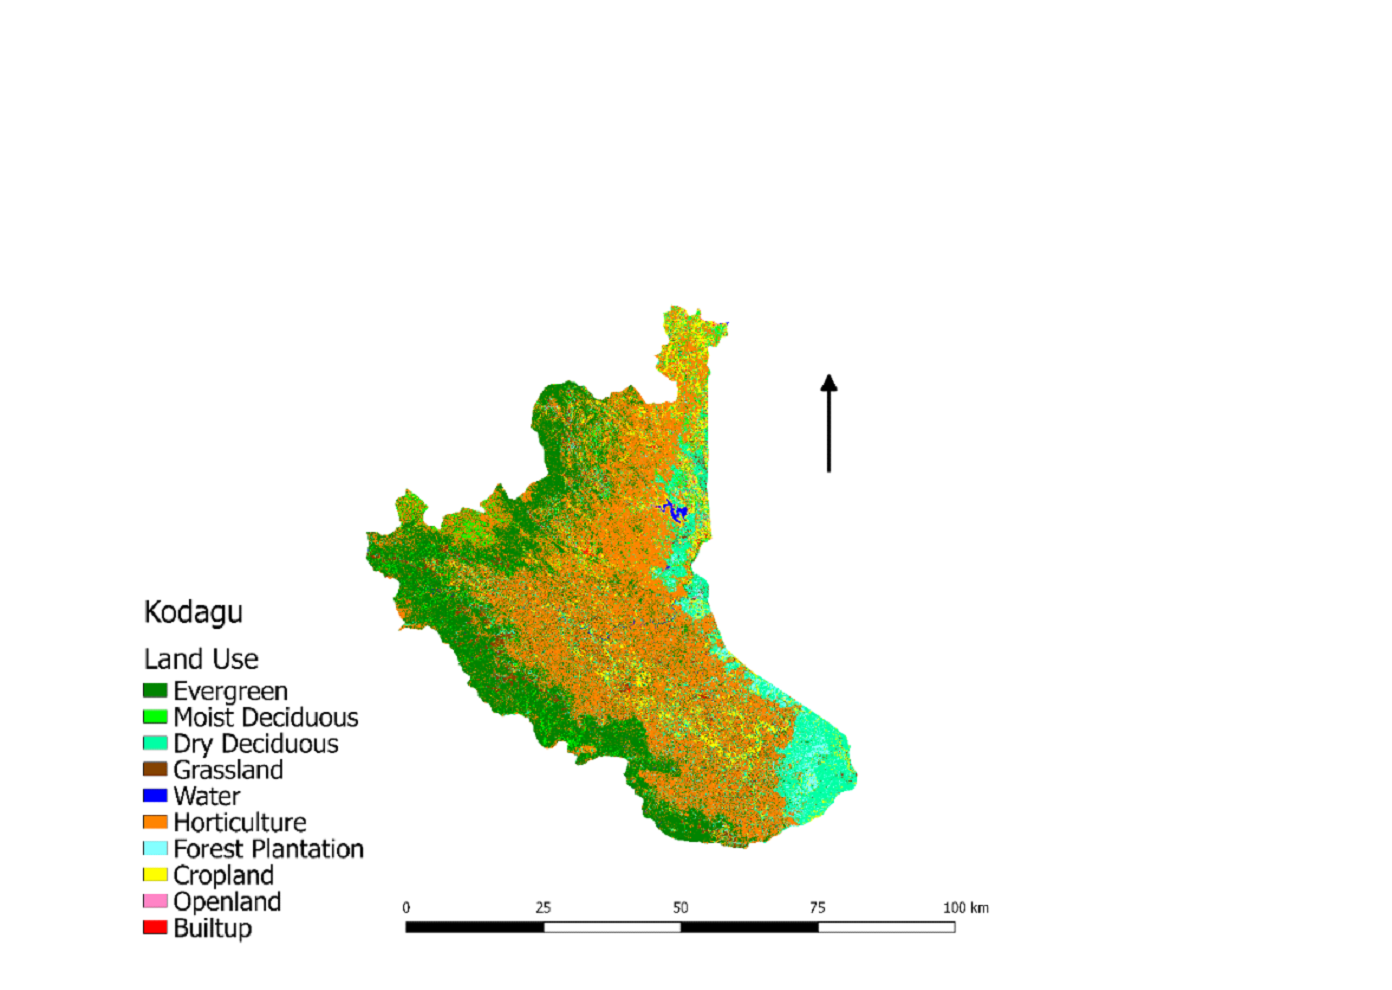
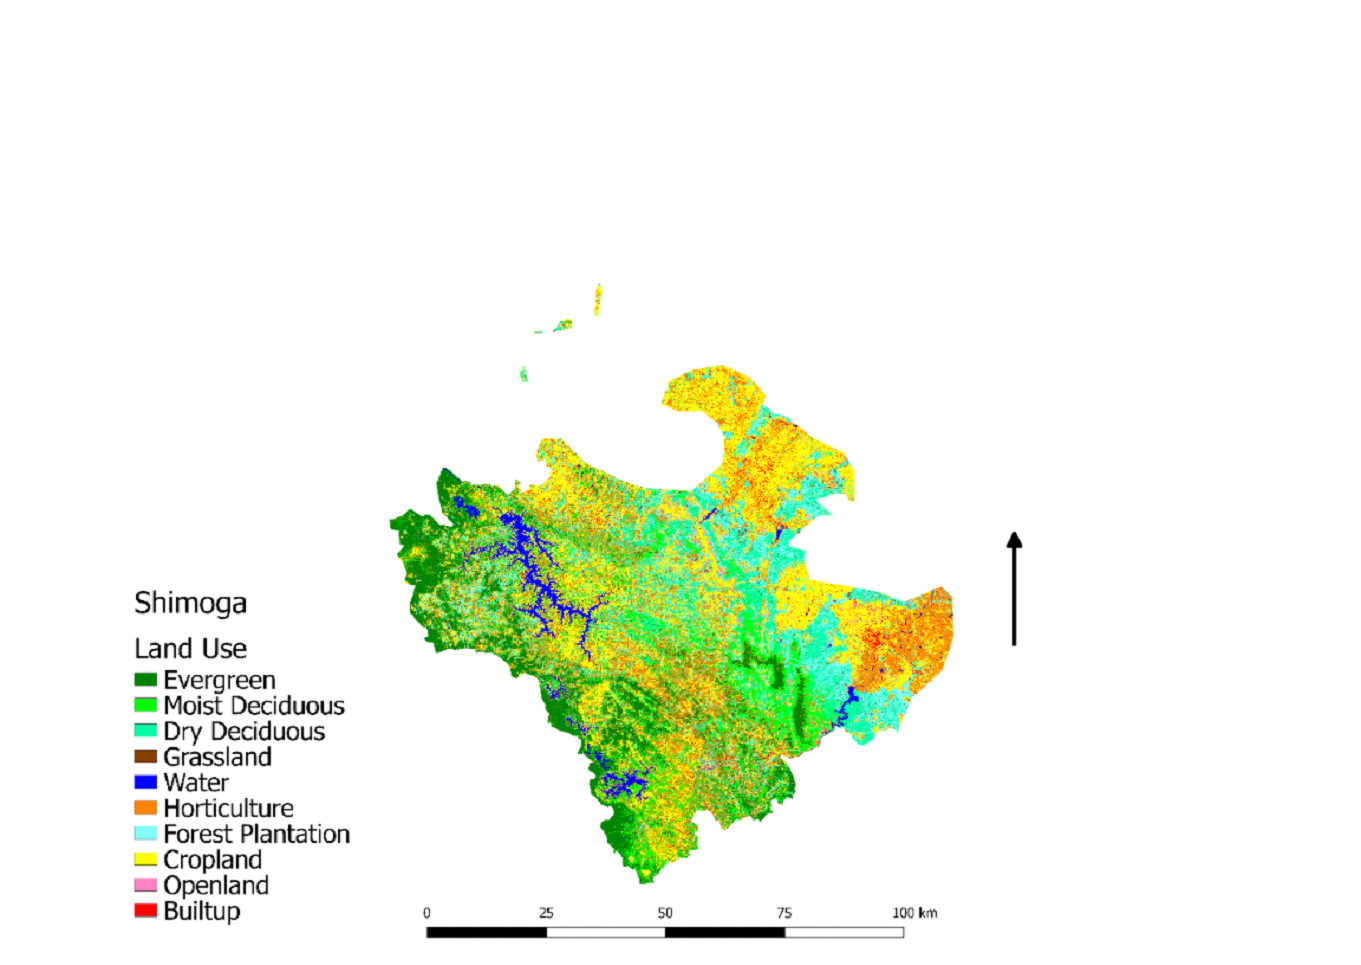
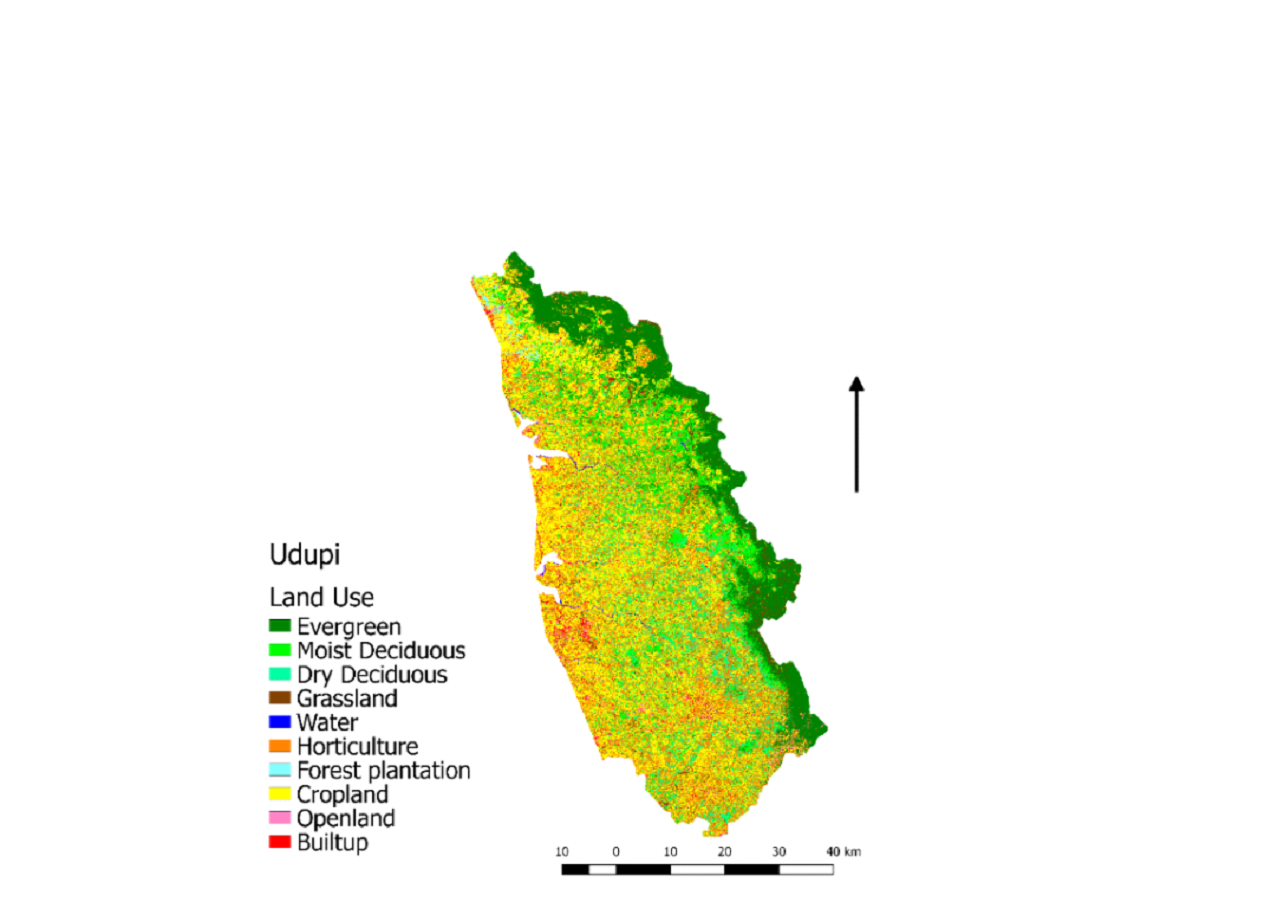
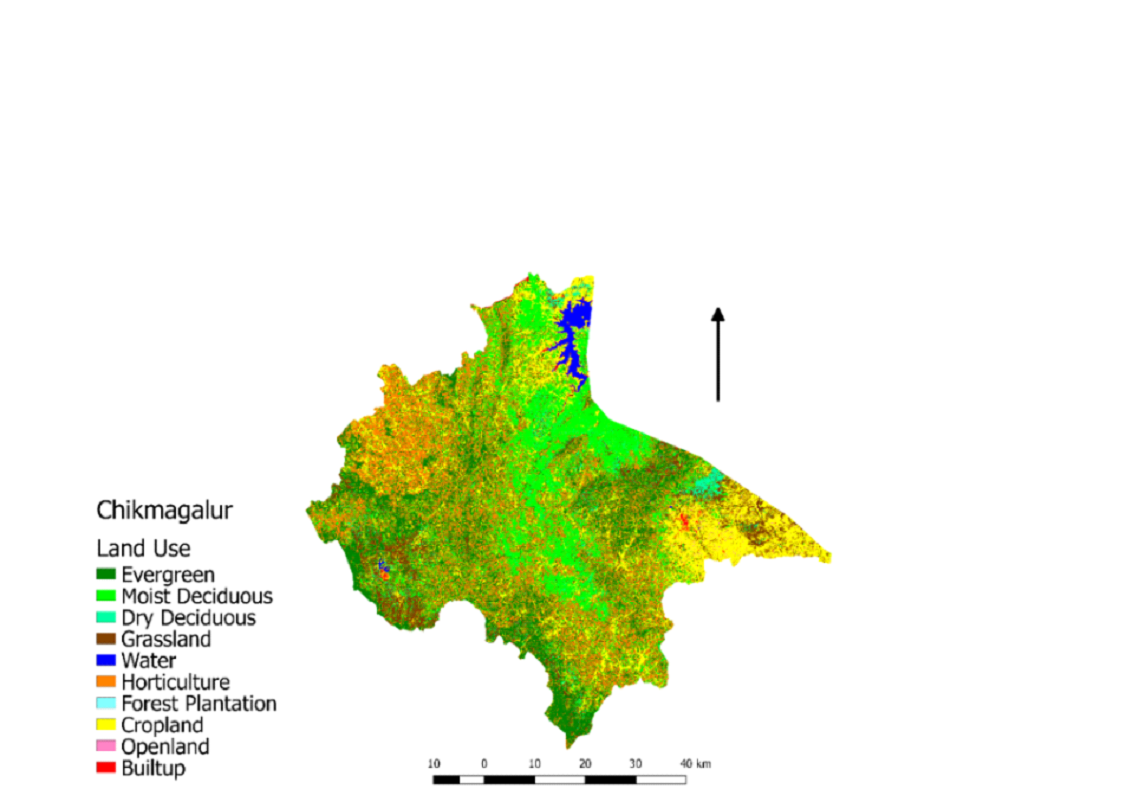
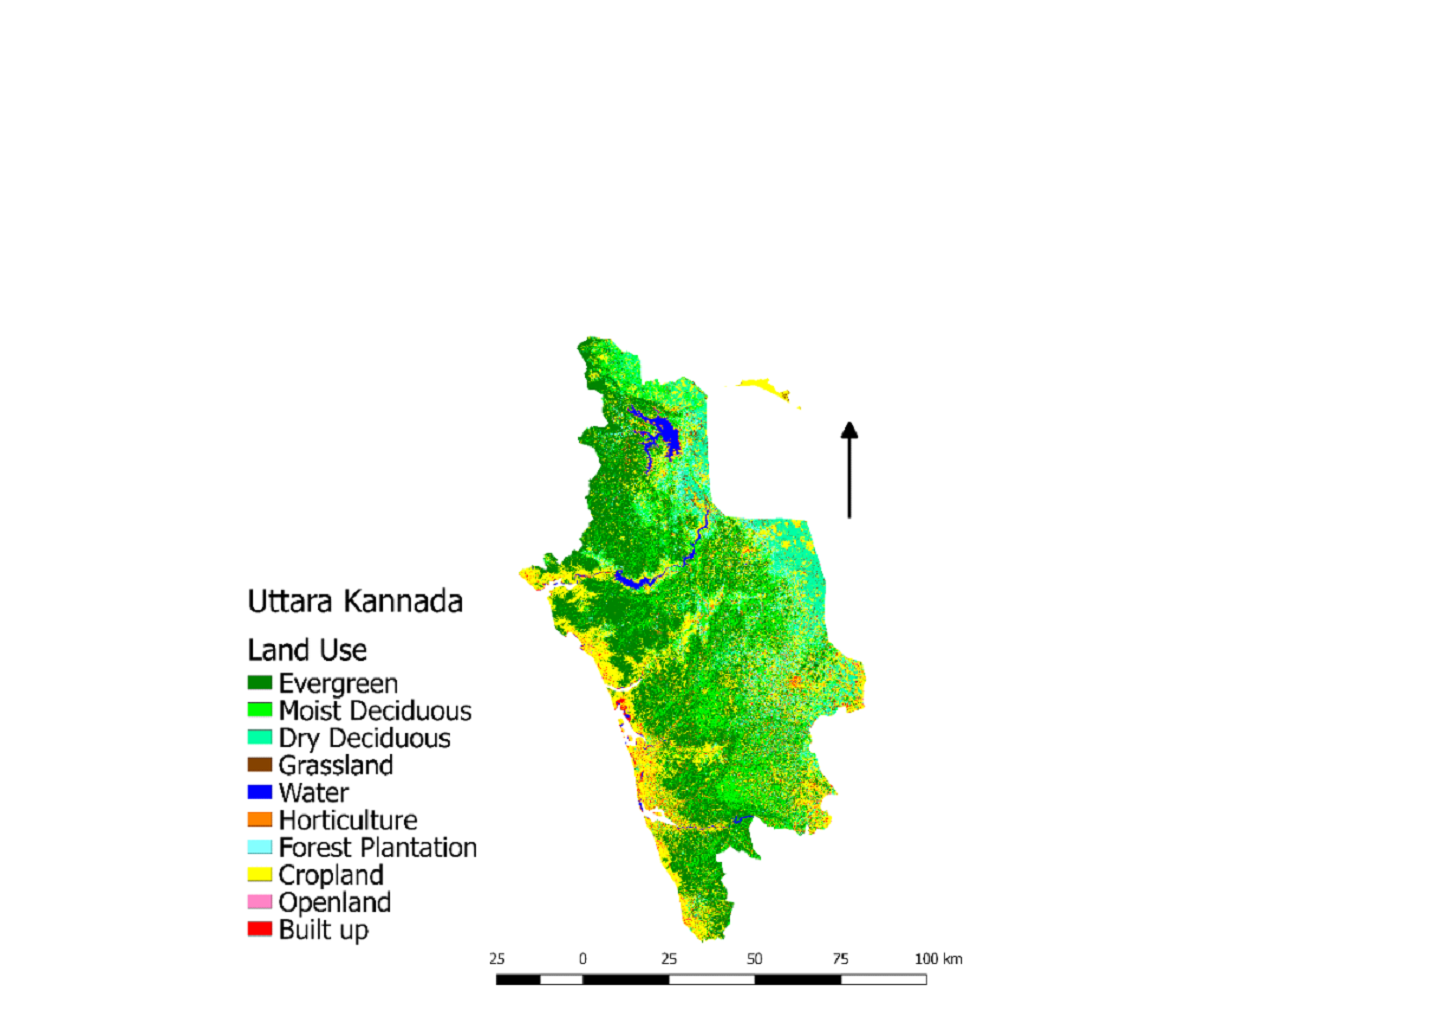
Land Use of Karnataka part of Southern Western Ghats
Karnataka's major forest types are Evergreen and
semi-evergreen,
Moist deciduous, Dry deciduous, Scrub and Thorny forest, and
Un-wooded forest. The land-use classification was carried out
using
a supervised classification protocol. The total geographical
area of
Karnataka under the Western Ghats is 41040.7 sq km covering
districts such as Uttara Kannada, Shimoga, Udupi (Table 9). The
land
use analysis shows the maximum area covered in cropland with
32.07%
of the total area of the Western Ghats region of Karnataka.
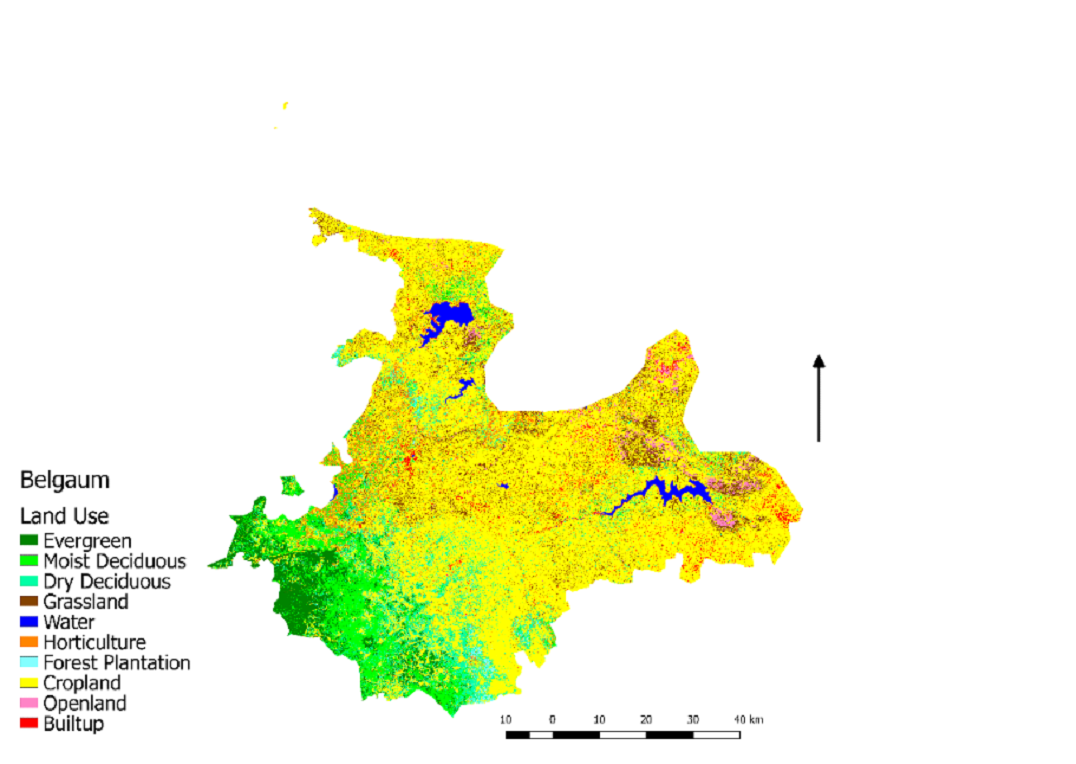
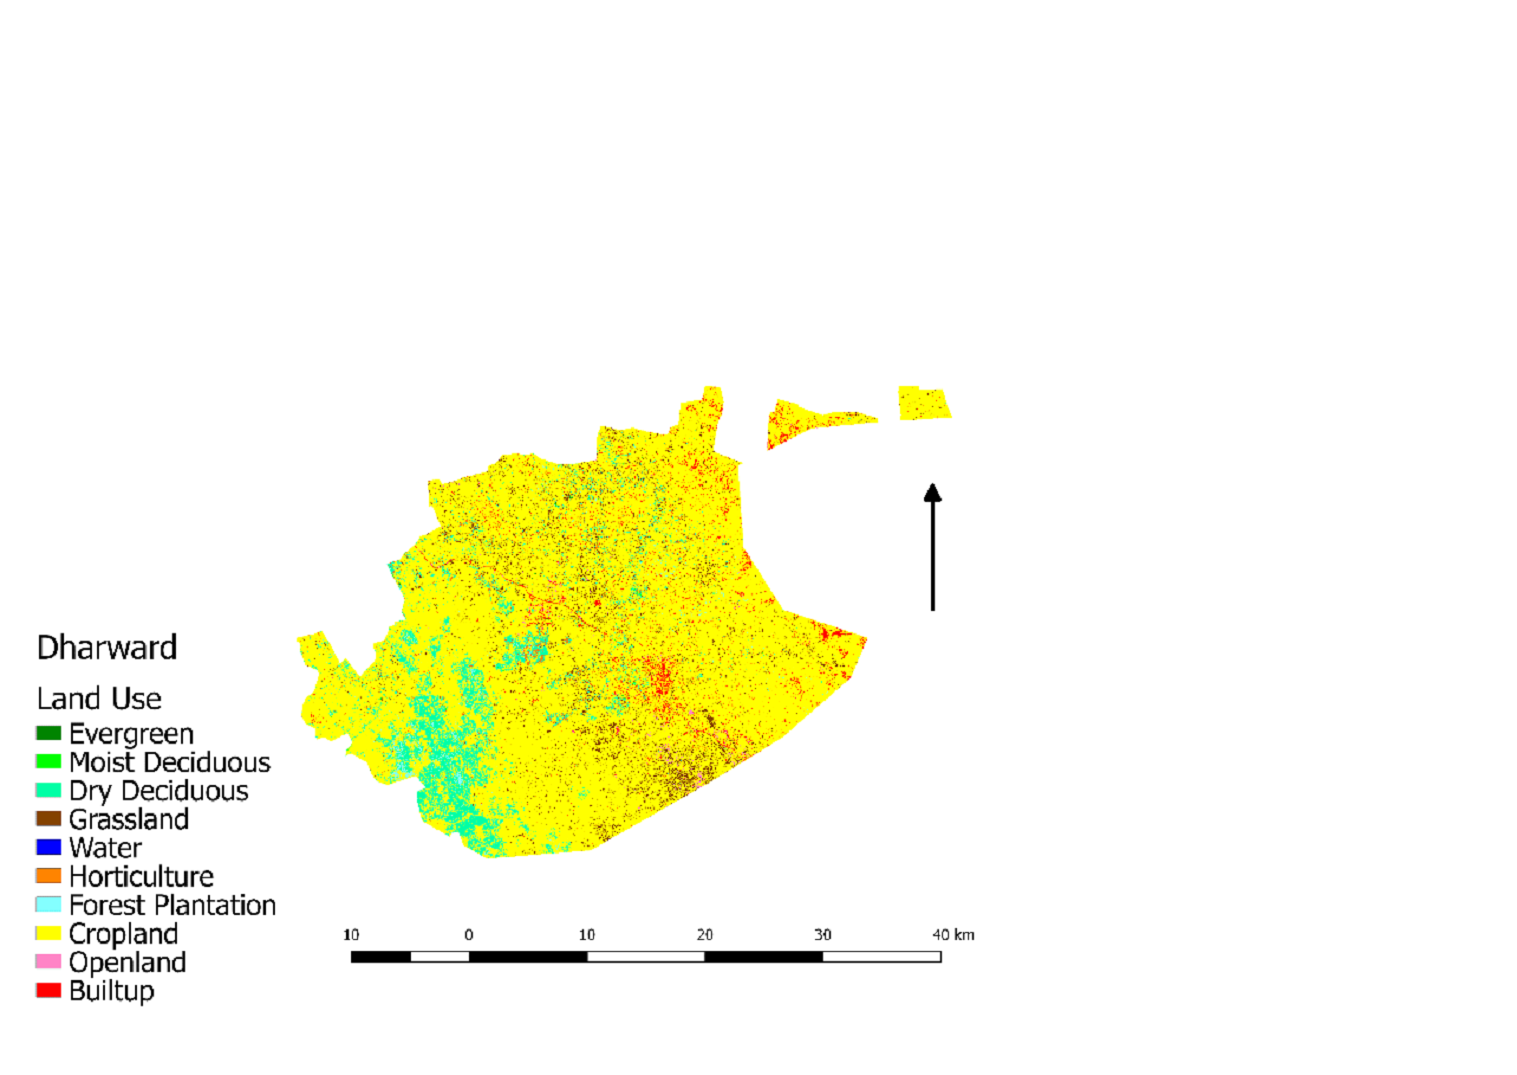
Belgaum
and Dharwad have the maximum coverage area under cropland
compared
with the rest of the district. Horticulture falls seconds after
cropland in the cover area of Karnataka. As per the present
study,
the total forest cover under the Western Ghats of Karnataka is
16,537.54 sq km, with evergreen forest dominating the districts.
Uttara Kannada has the maximum forest cover i.e., 12.5% of the
total
area of Karnataka as compared with the rest of the districts
(Table
10). The maximum disturbances to the forest cover are the
unauthorized conversion of forest land into agriculture
(encroachments), the diversion of forest lands for other
purposes,
and wood logging by forest-based industries. The accuracy
assessment
for the image ranges from 81 to 87% and Kappa value from 0.78 to
0.85.
Table 9. Land use statistics of Karnataka part of SWG
Table 10. Land Use of Karnataka part of SWG
| Land Use |
Comment |
|
The maximum area is covered by cropland, with 32.07% of
the Western Ghats region of Karnataka. The total forest
cover of Karnataka under the Western Ghats is 16,537.54
sq km, with evergreen forest dominating the districts.
Uttara Kannada has the maximum forest cover.
|
| District |
Statistics |
|
Evergreen- 337.68 sq km
Moist Deciduous- 447.26 sq km
Dry Deciduous- 454.61 sq km
Grassland- 396.66 sq km
|
|
Evergreen- 0.32 sq km
Moist Deciduous- 0.72 sq km
Dry Deciduous- 79.25 sq km
Grassland- 43.91 sq km
|
|
Evergreen- 446.74 sq km
Moist Deciduous- 149.45 sq km
Dry Deciduous- 149.45 sq km
Grassland- 246.06 sq km
|
|
Evergreen- 255.98 sq km
Moist Deciduous- 185.04 sq km
Dry Deciduous- 117.31 sq km
Grassland- 104.43 sq km
|
|
Moist Deciduous- 150.50 sq km
Dry Deciduous- 521.95 sq km
Grassland- 26.25 sq km
|
|
Evergreen- 1090.46 sq km
Moist Deciduous- 160.03 sq km
Dry Deciduous- 443.21 sq km
Grassland- 207.78 sq km
|
|
Evergreen- 853.68 sq km
Moist Deciduous- 663.20 sq km
Dry Deciduous- 881.48 sq km
Grassland- 65.62 sq km
|

|
Moist Deciduous- 221.75 sq km
Dry Deciduous- 299.88 sq km
Grassland- 199.72 sq km
|
|
Evergreen- 591.68 sq km
Moist Deciduous- 432.54 sq km
Dry Deciduous- 194.62 sq km
Grassland- 126.17 sq km
|
|
Evergreen- 841.92 sq km
Moist Deciduous- 969.13 sq km
Dry Deciduous- 76.20 sq km
Grassland- 365.33 sq km
|
|
Evergreen- 3427.75 sq km
Moist Deciduous- 855.46 sq km
Dry Deciduous- 762.24 sq km
Grassland- 114.17 sq km
|
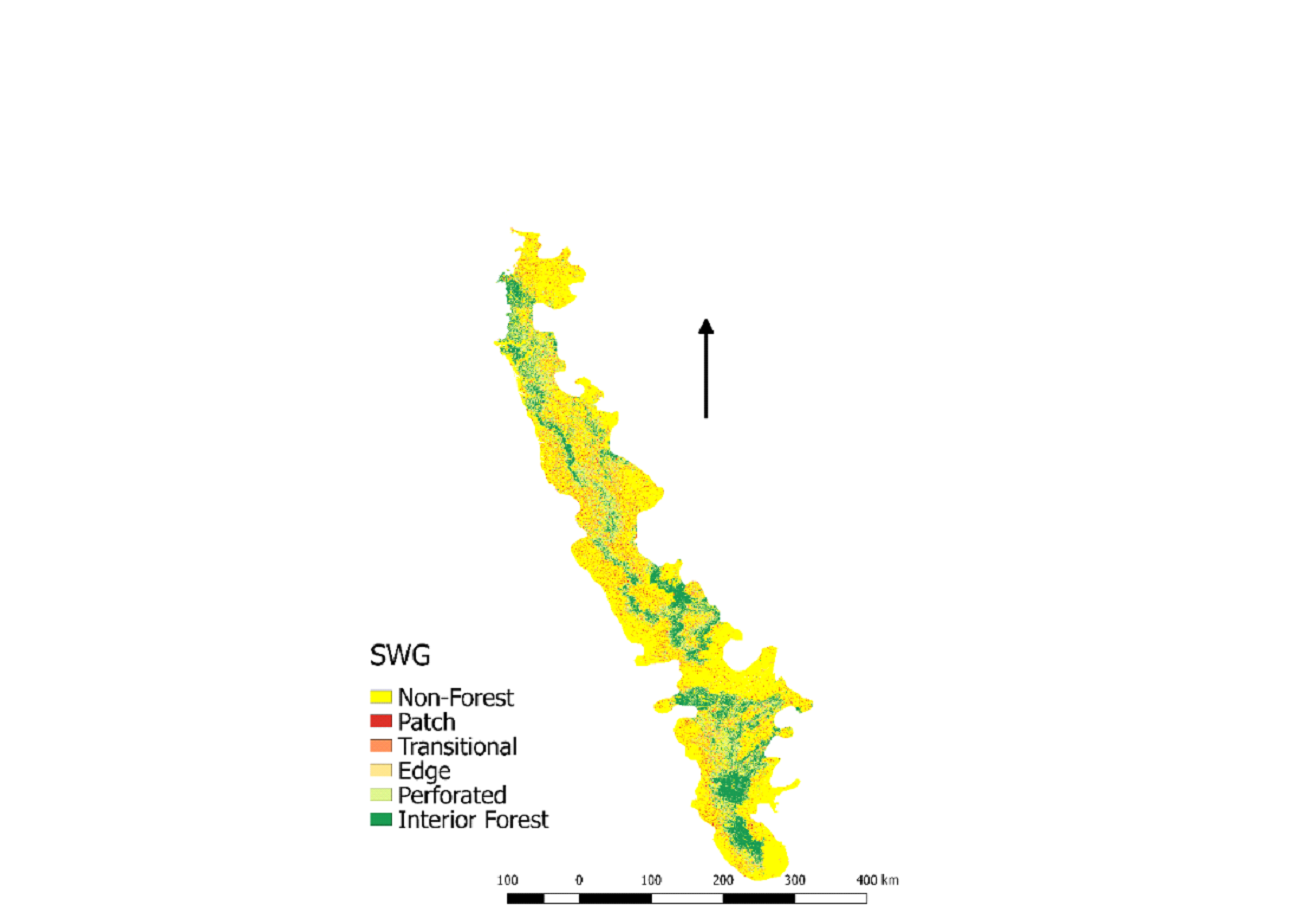
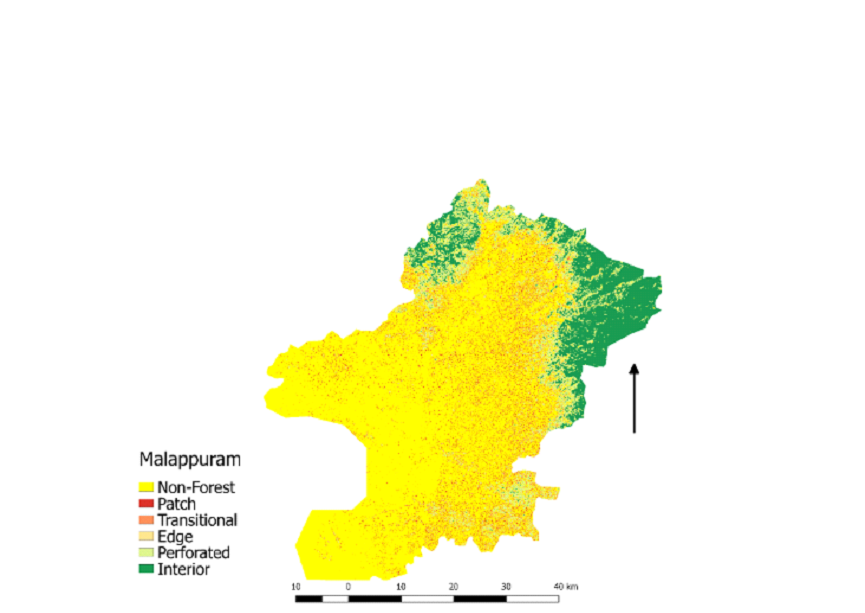
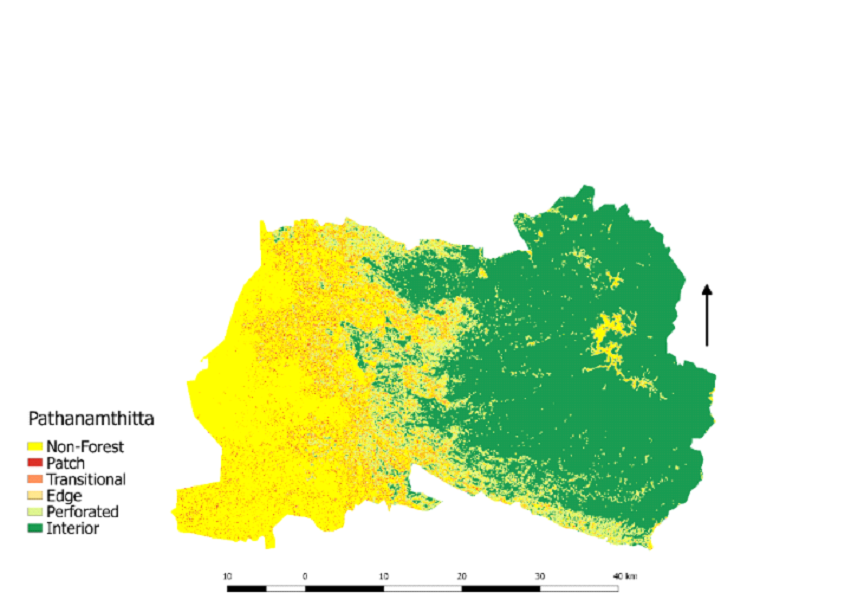
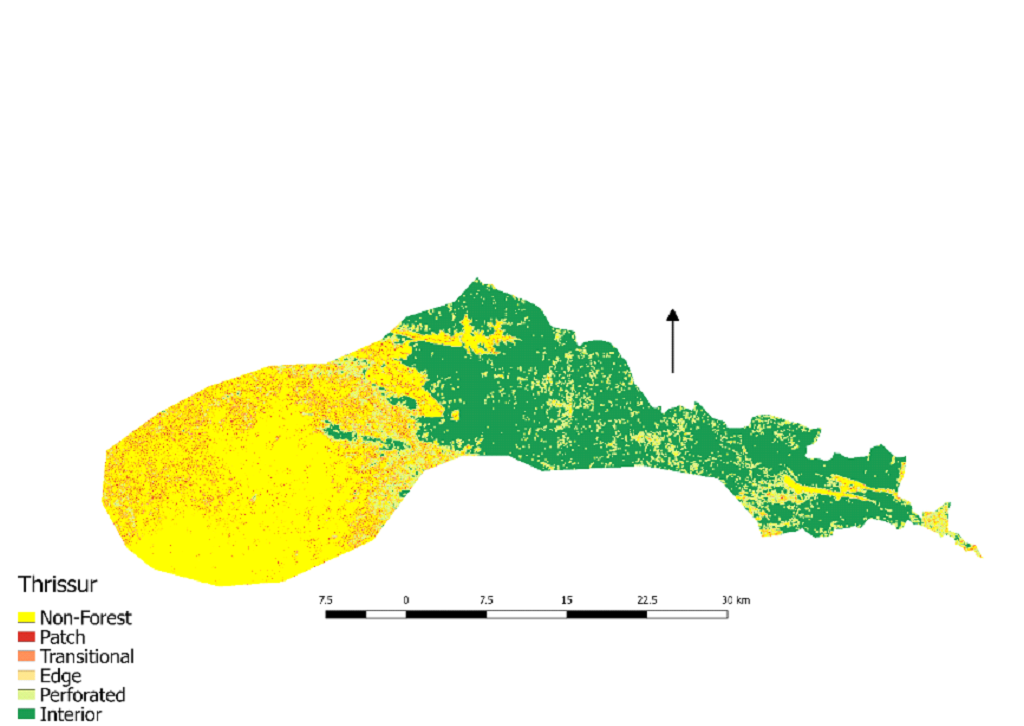
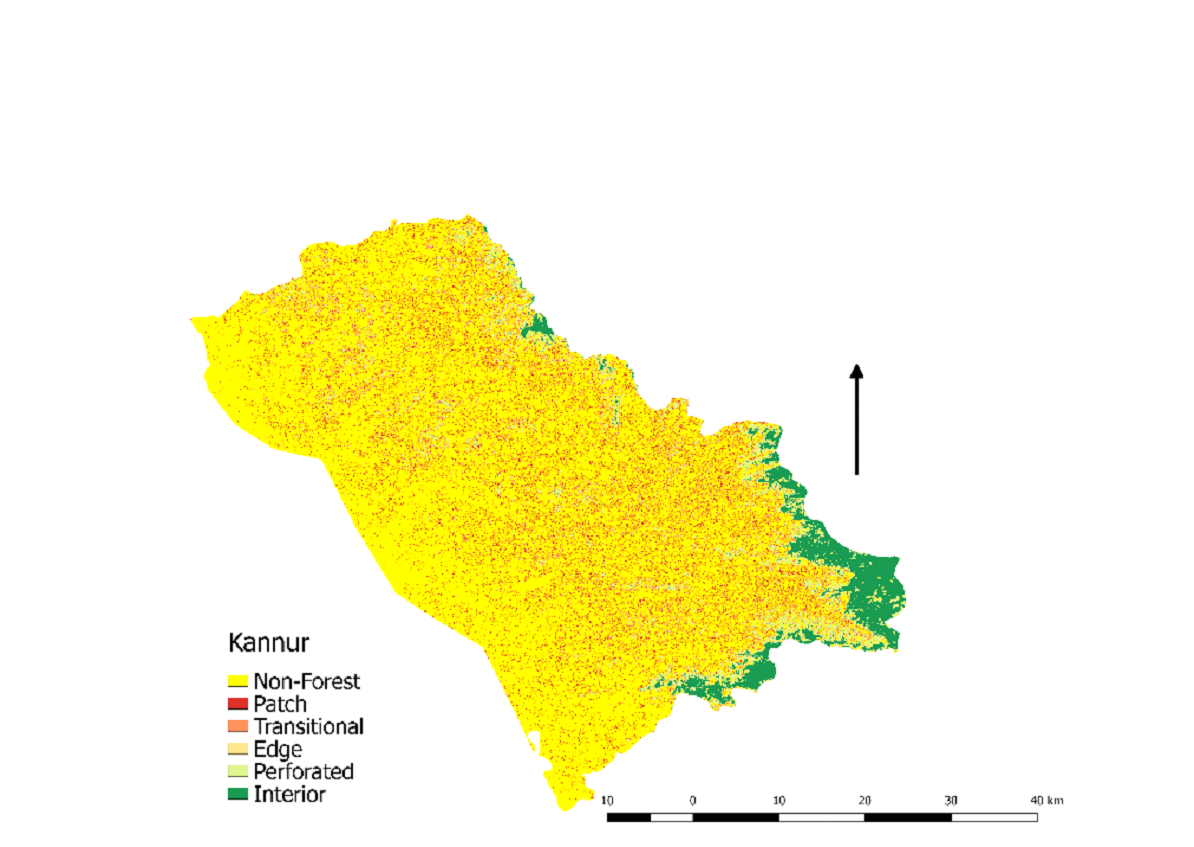
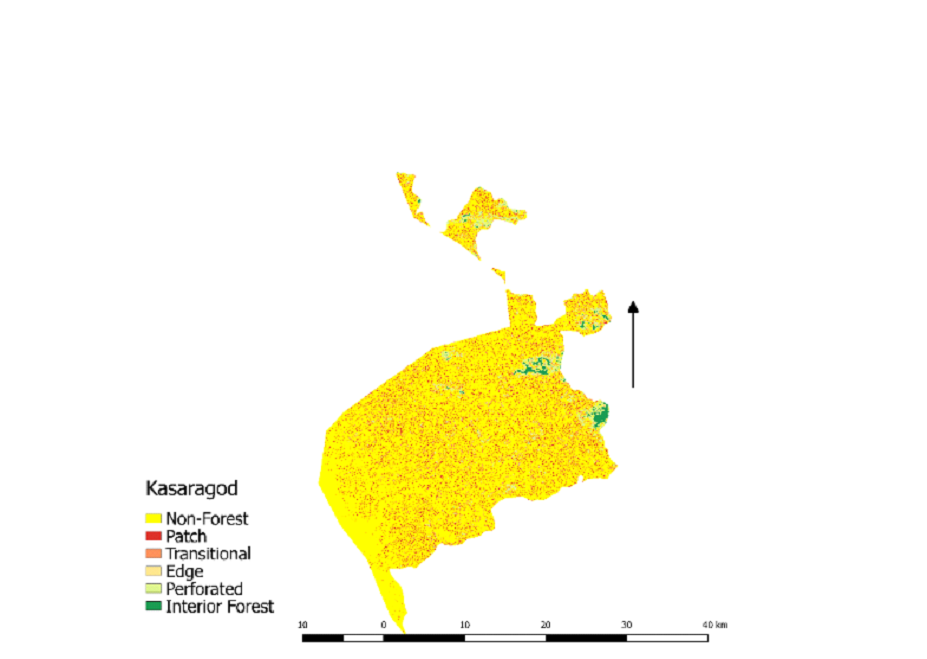
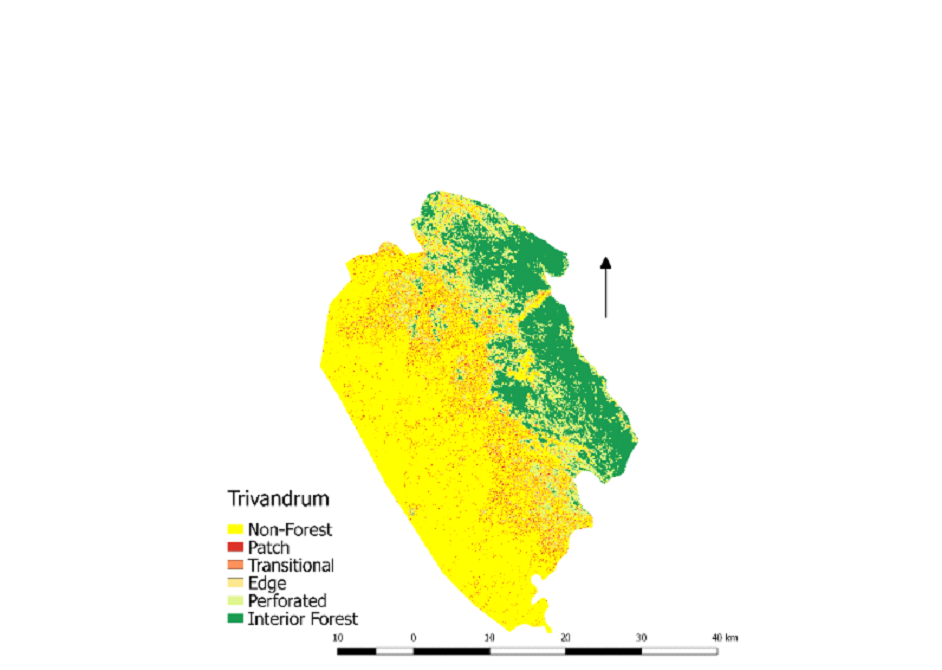
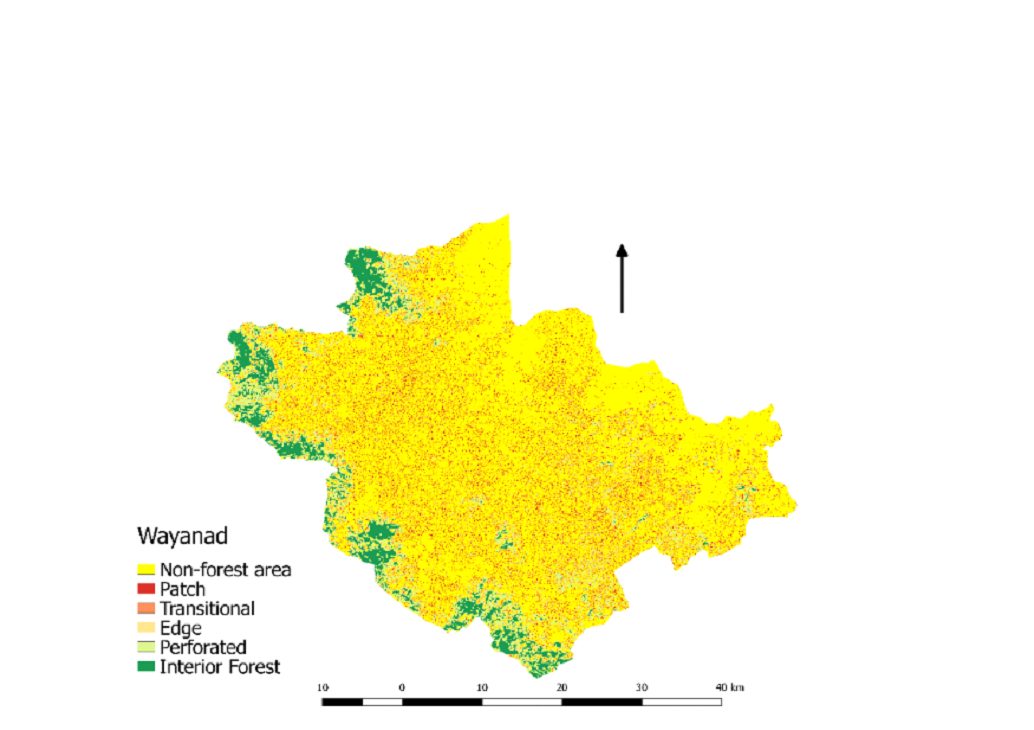
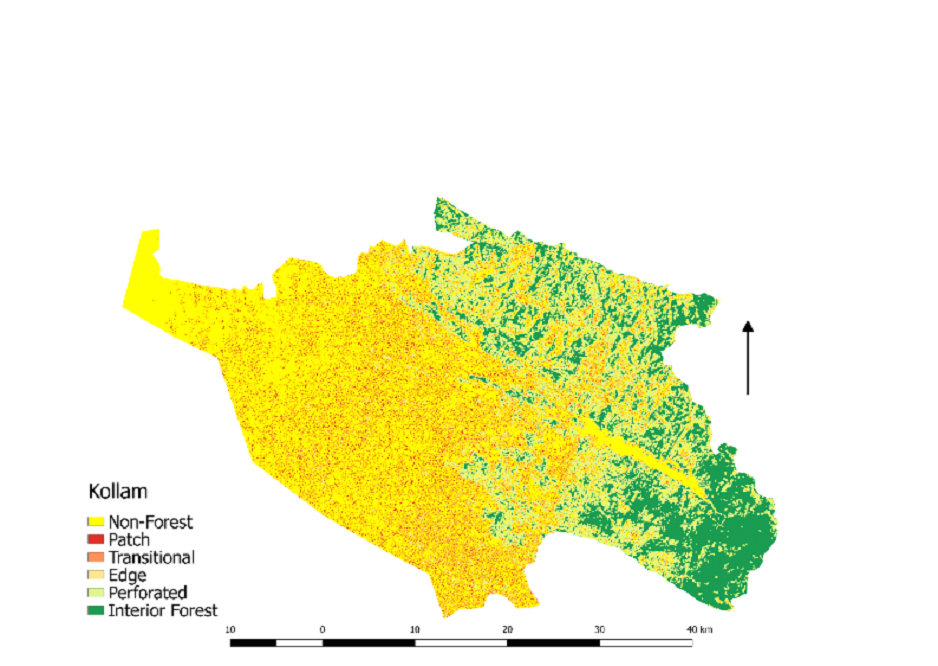
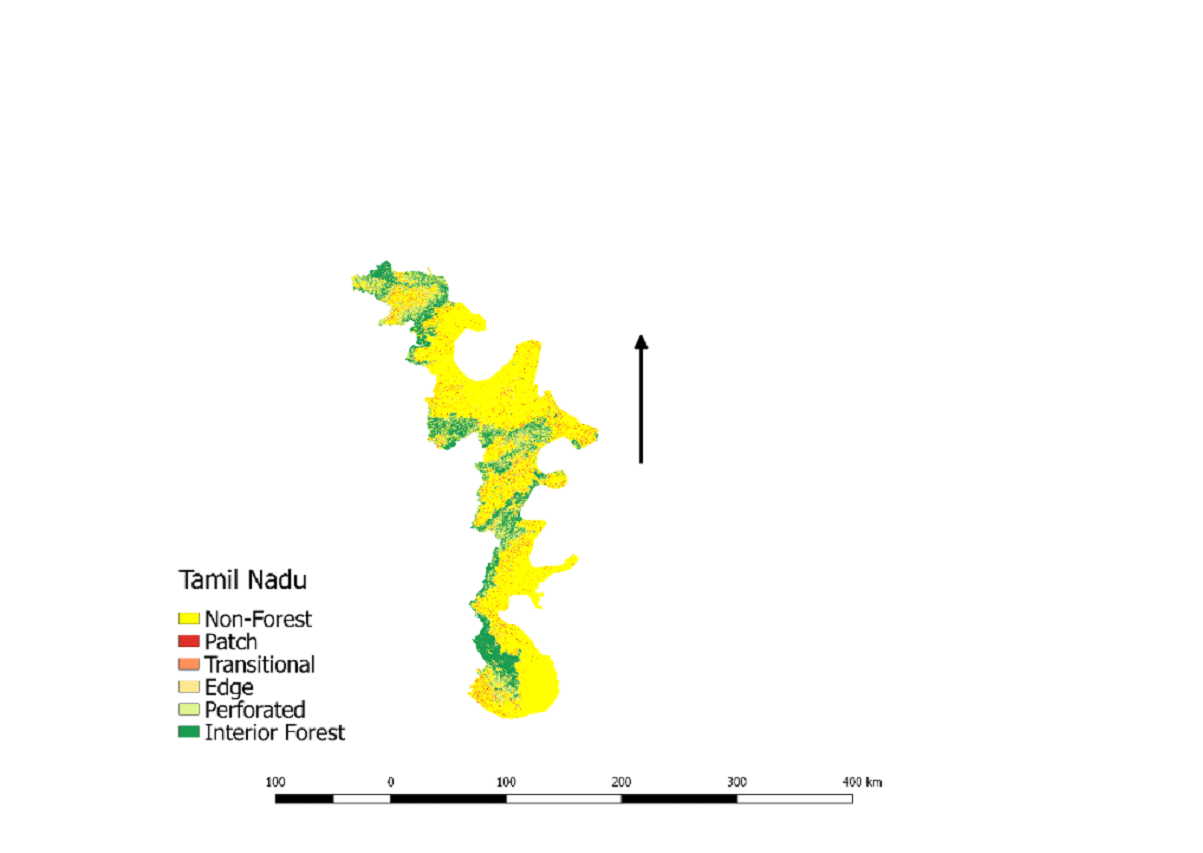
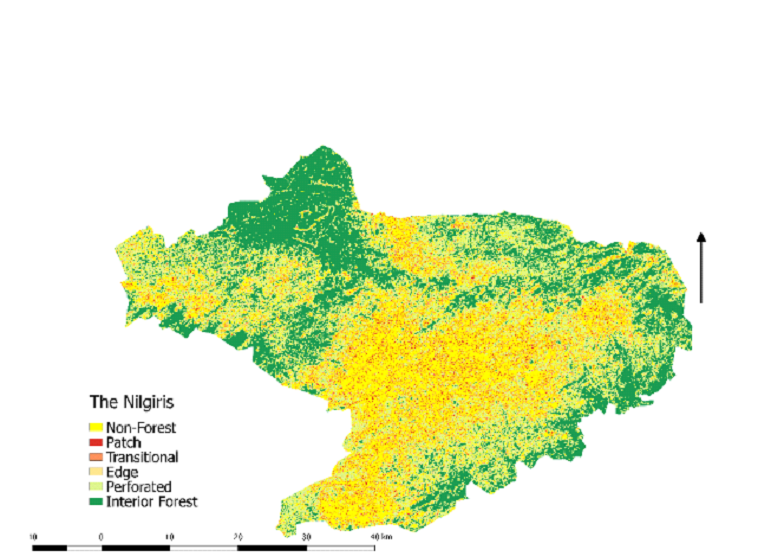
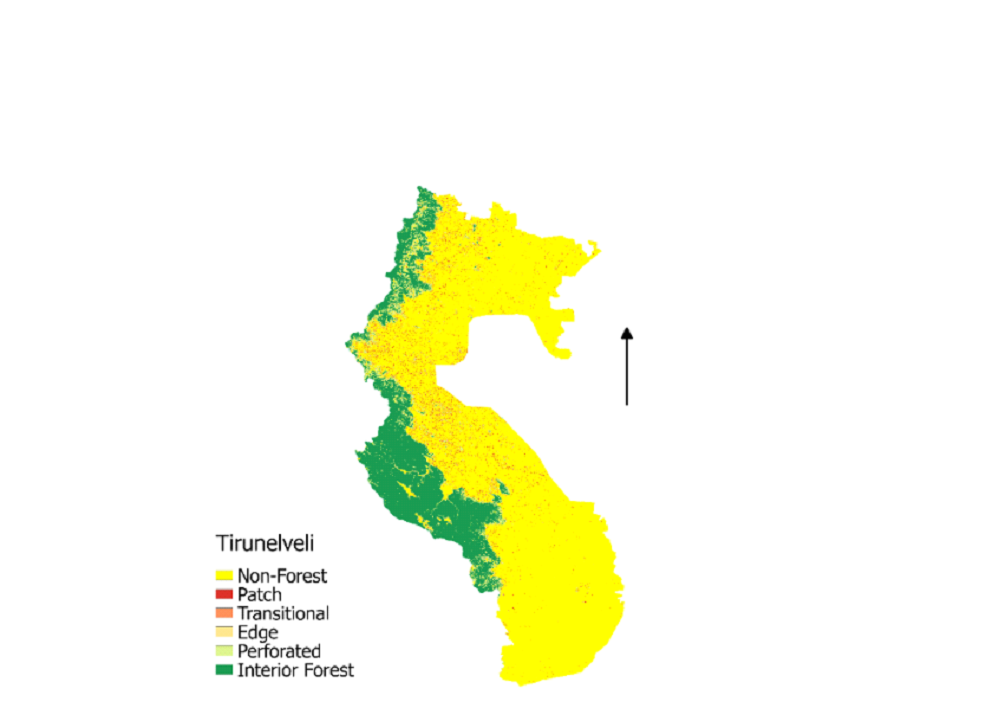
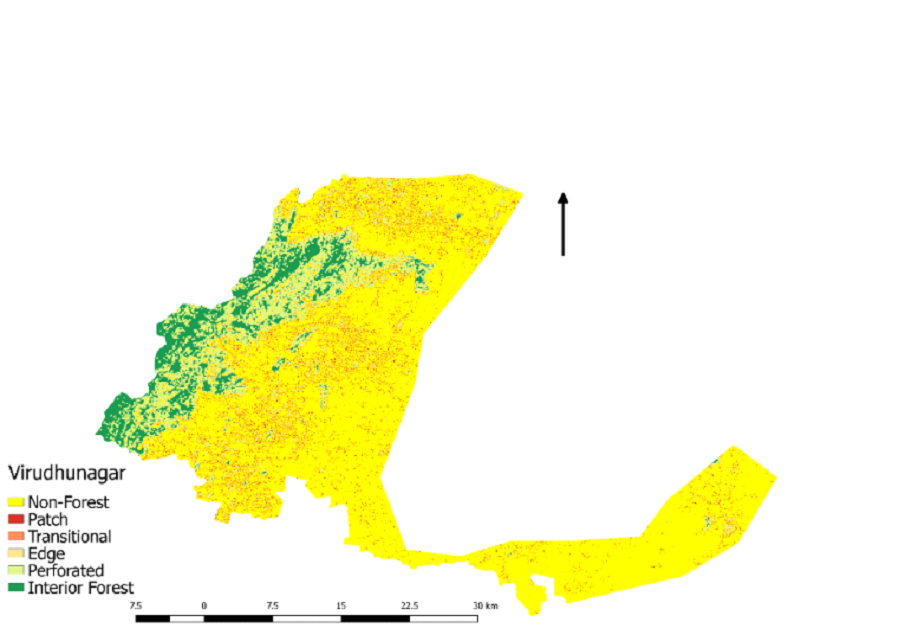
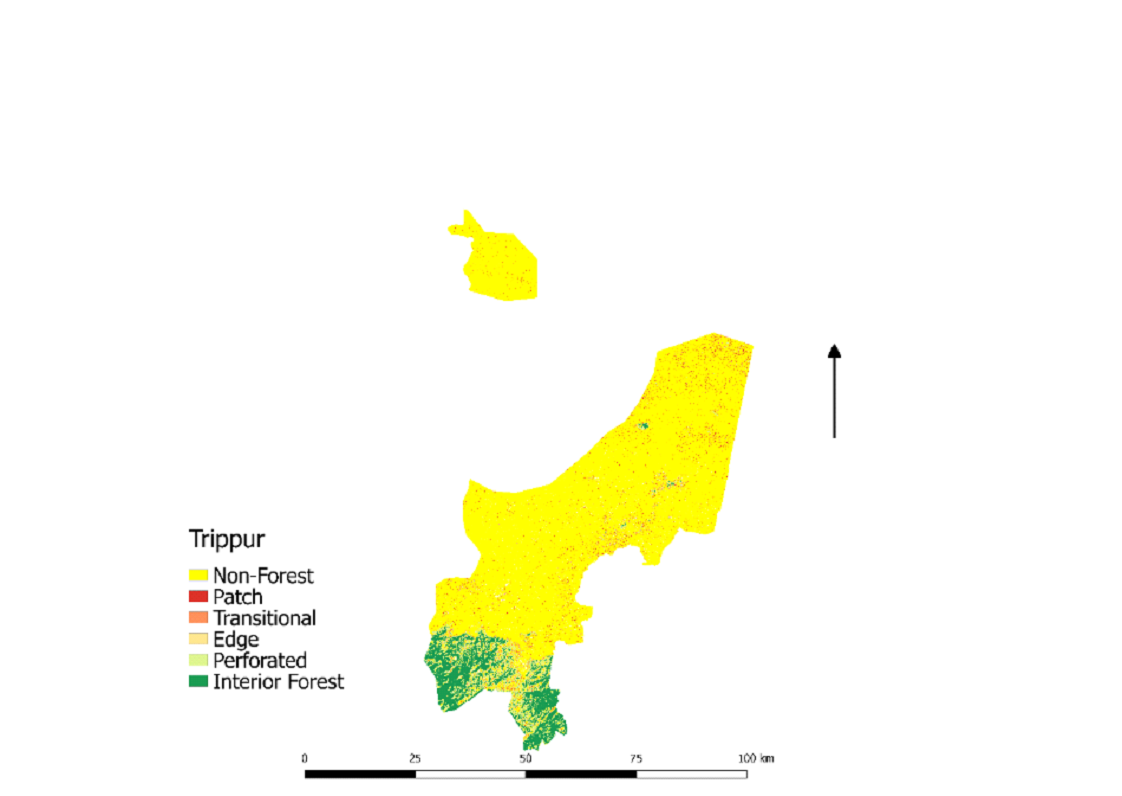
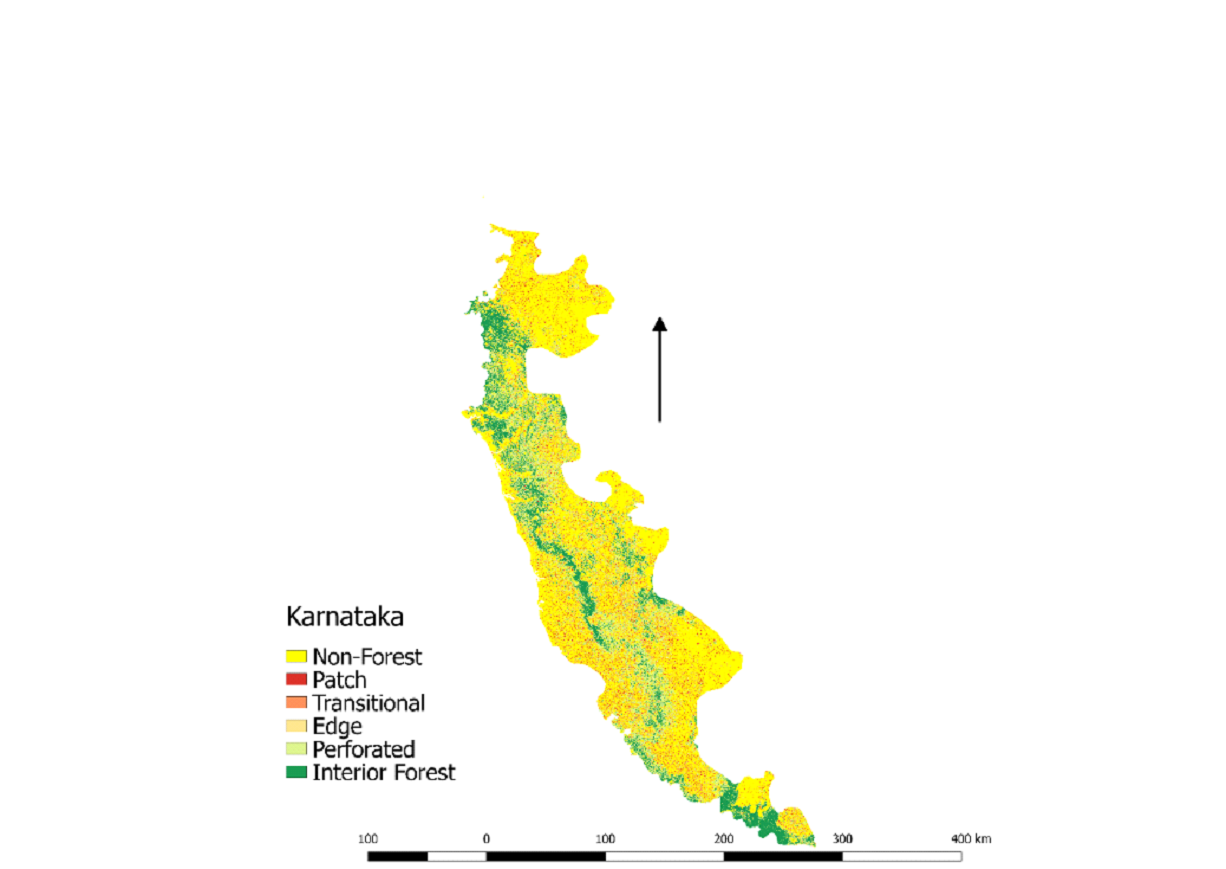
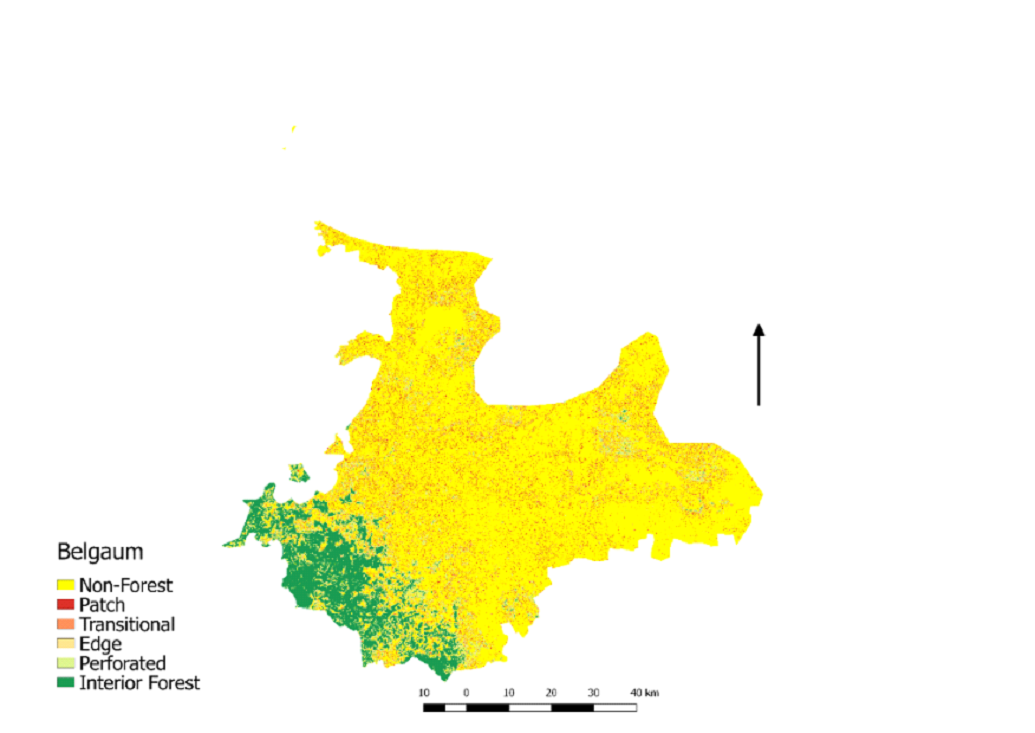
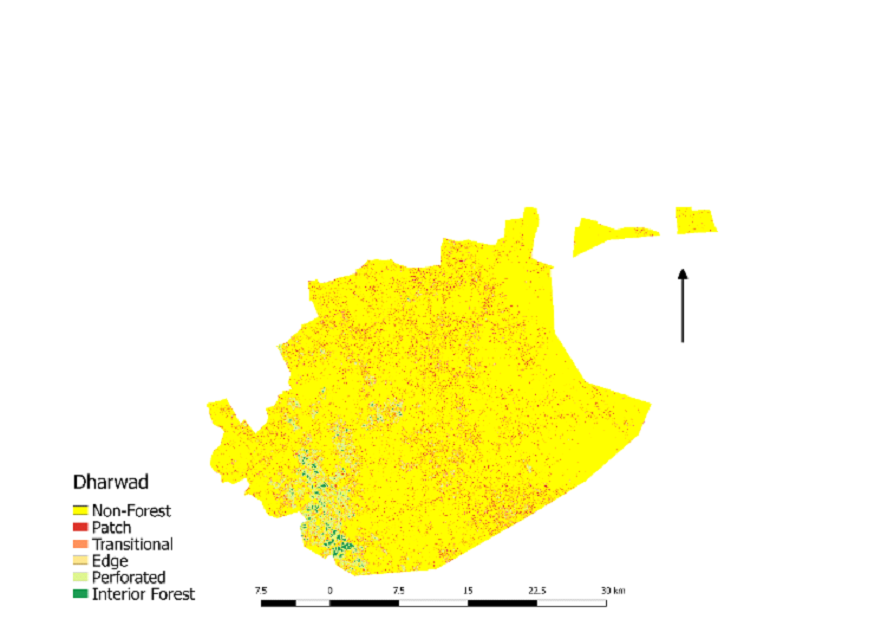
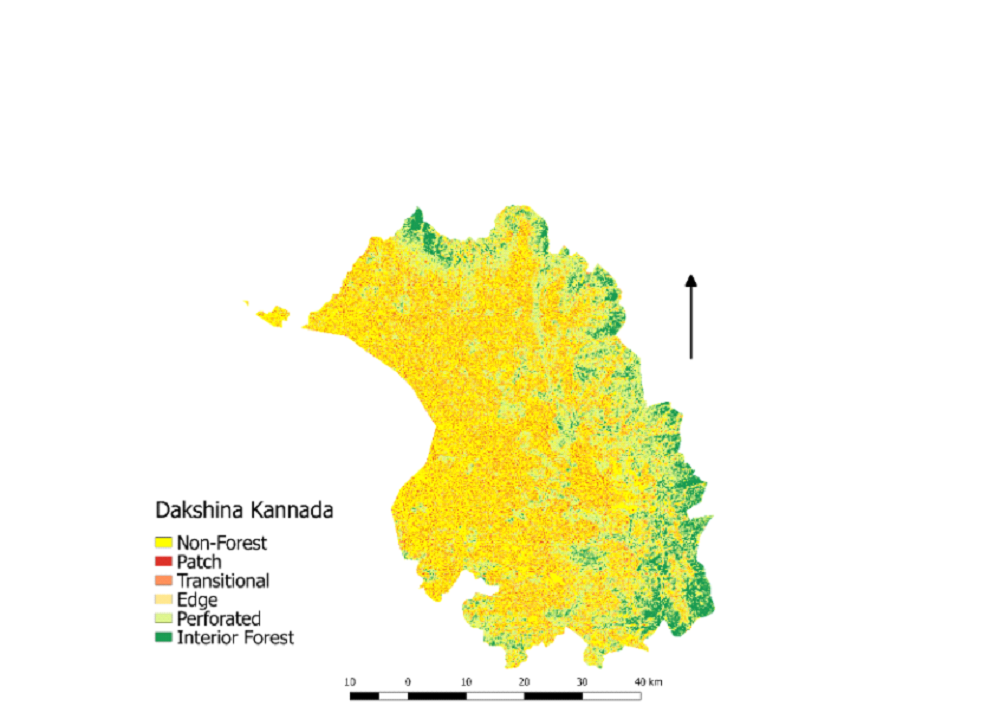
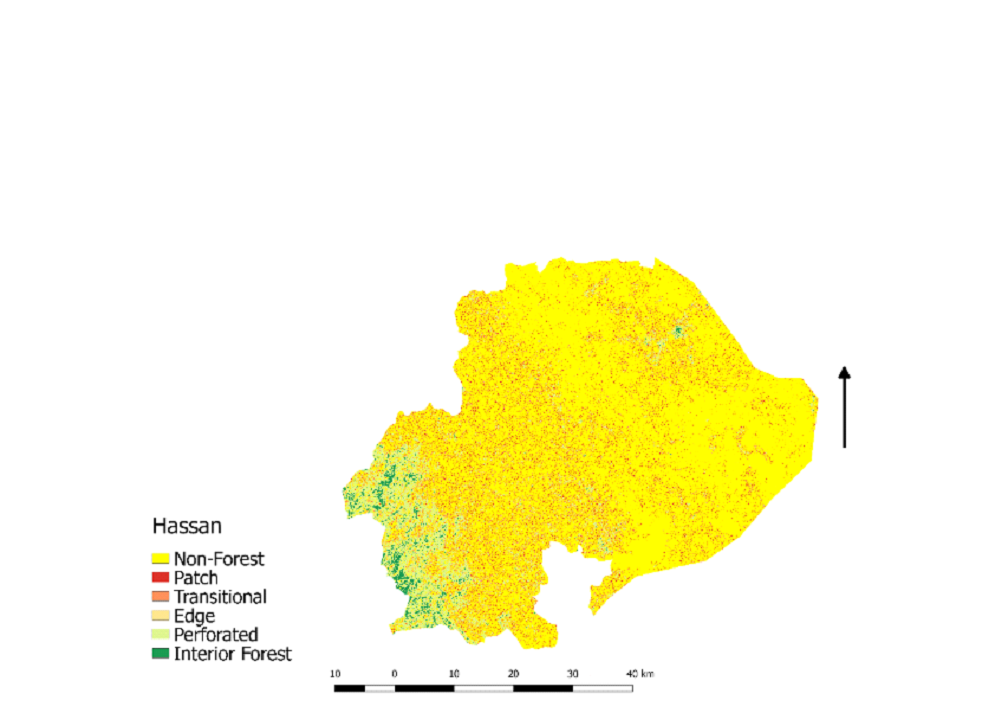
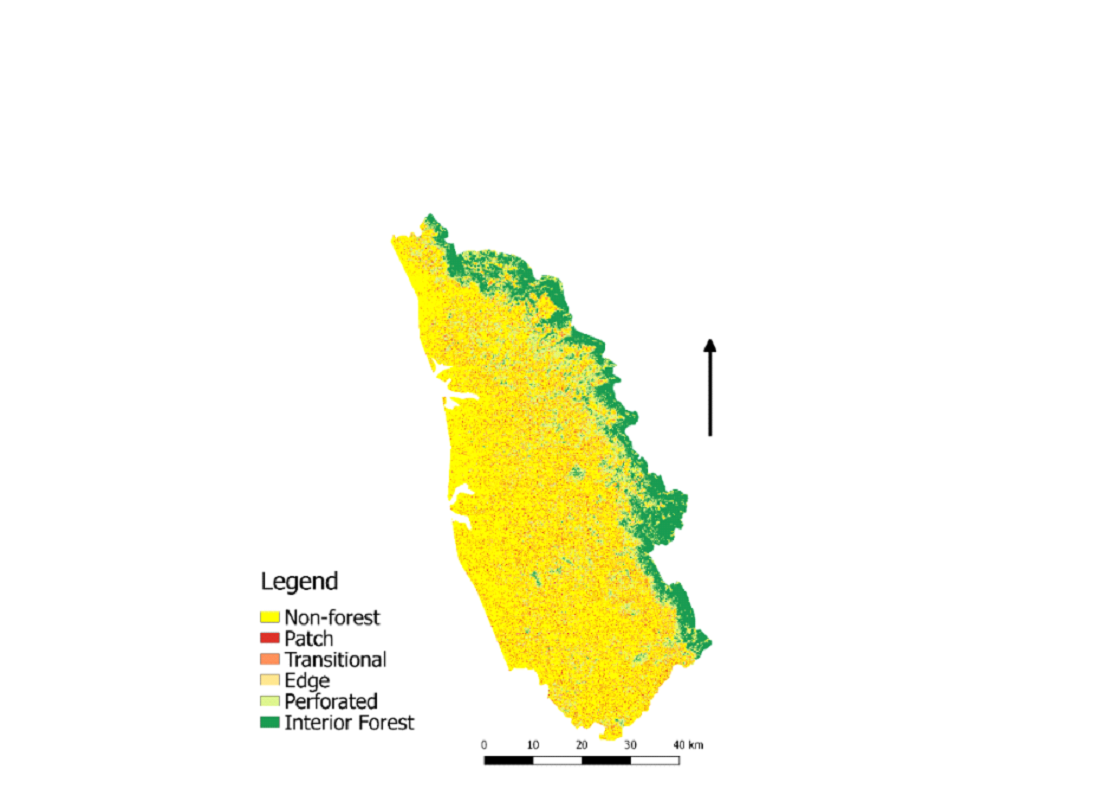
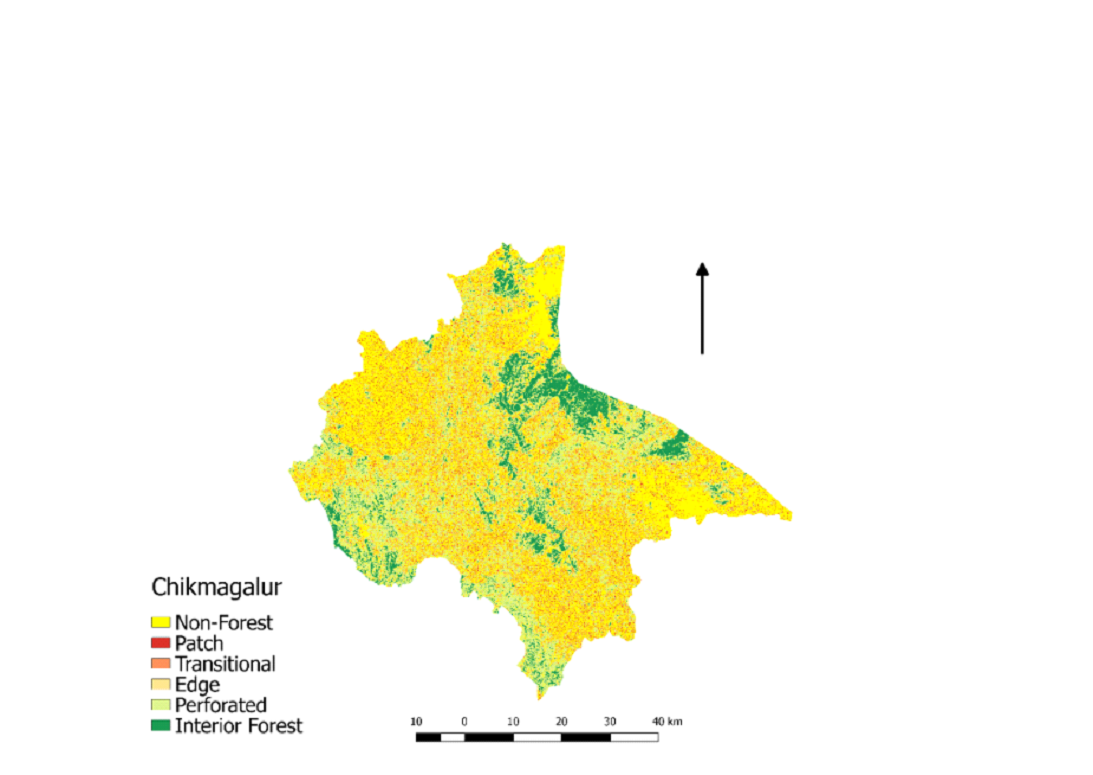
Fragmentation Analysis
Forest fragmentation is mainly a result of anthropogenic
activities like encroachment by plantations, orchards, cropland,
and
mining activities. Habitat destruction, changes in the dispersal
and
migration process, and a significant loss to endemic
biodiversity
are consequences of fragmentation of native forests
(Armenteras et
al., 2003; Etter et al., 2006; Eldegard et al., 2015) .
Tables 11-14
list the spatial extent of various types of forest fragments
(interior, perforated, edge, transitional, and patch forests
along
with non-forested areas) across states of SWG. Out of the three
states, districts of Tamil Nadu have the maximum extent of the
non-forest area, i.e., 63.2% after that are districts of Kerala
with
57% and then the districts Karnataka with 53% of non-forest in
their
respective states (Figure 5). Patches are created due to an
increase
in the fragmentation of forests. The area of patch forest in
Kerala
and Karnataka is almost similar, i.e., 4.9%, whereas Tamil Nadu
has
3.1% of patch forest. The extent of the forest fragments can be
inferred through the patch areas and the leftover interior
forests.
Increasing patch forests enhances the edge effect in any
landscape.
The edge forest was observed to be more in the districts of
Karnataka (3.35%) than in the other two states. The forests
fragmented by anthropogenic sources are at higher risk of
further
fragmentation or removal than forests fragmented by natural
causes.
This isolation of the forest patches negatively impacts the
stand
regeneration and adversely affects species' survival, which
require
contiguous forest patches for their survival and regeneration
(Laurance et al., 1998, 2002; Niemi et al, 1998).

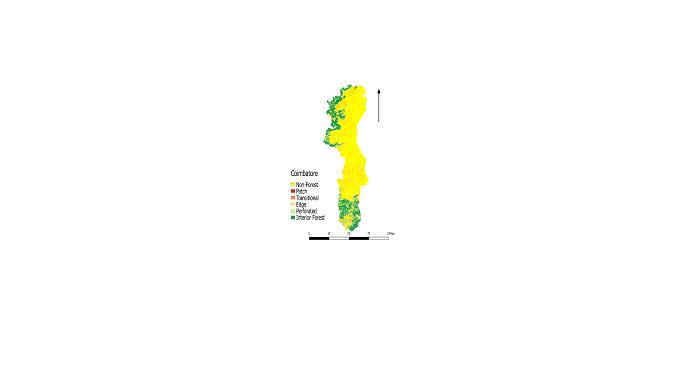
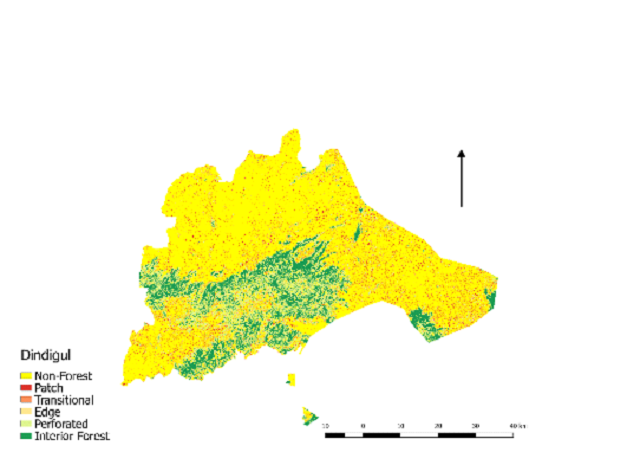
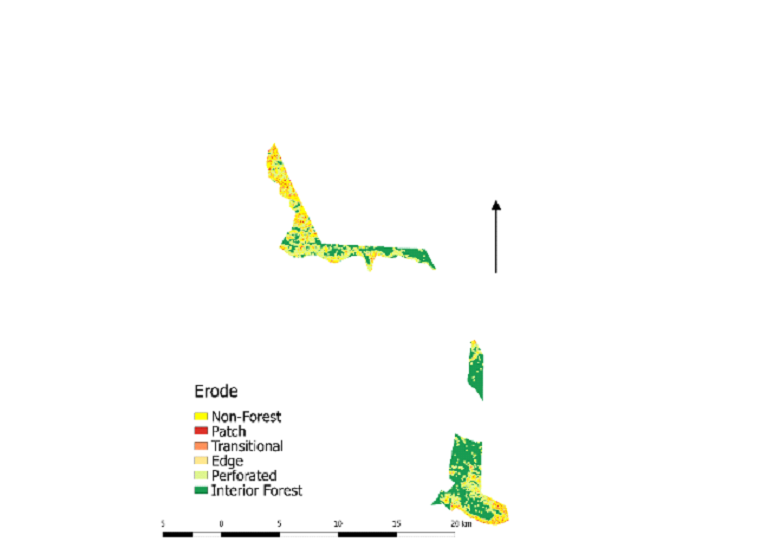
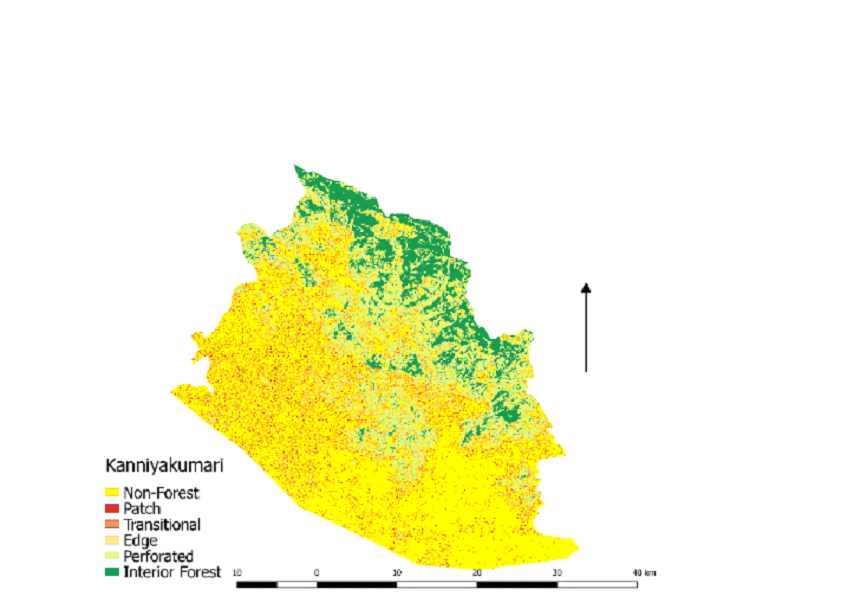
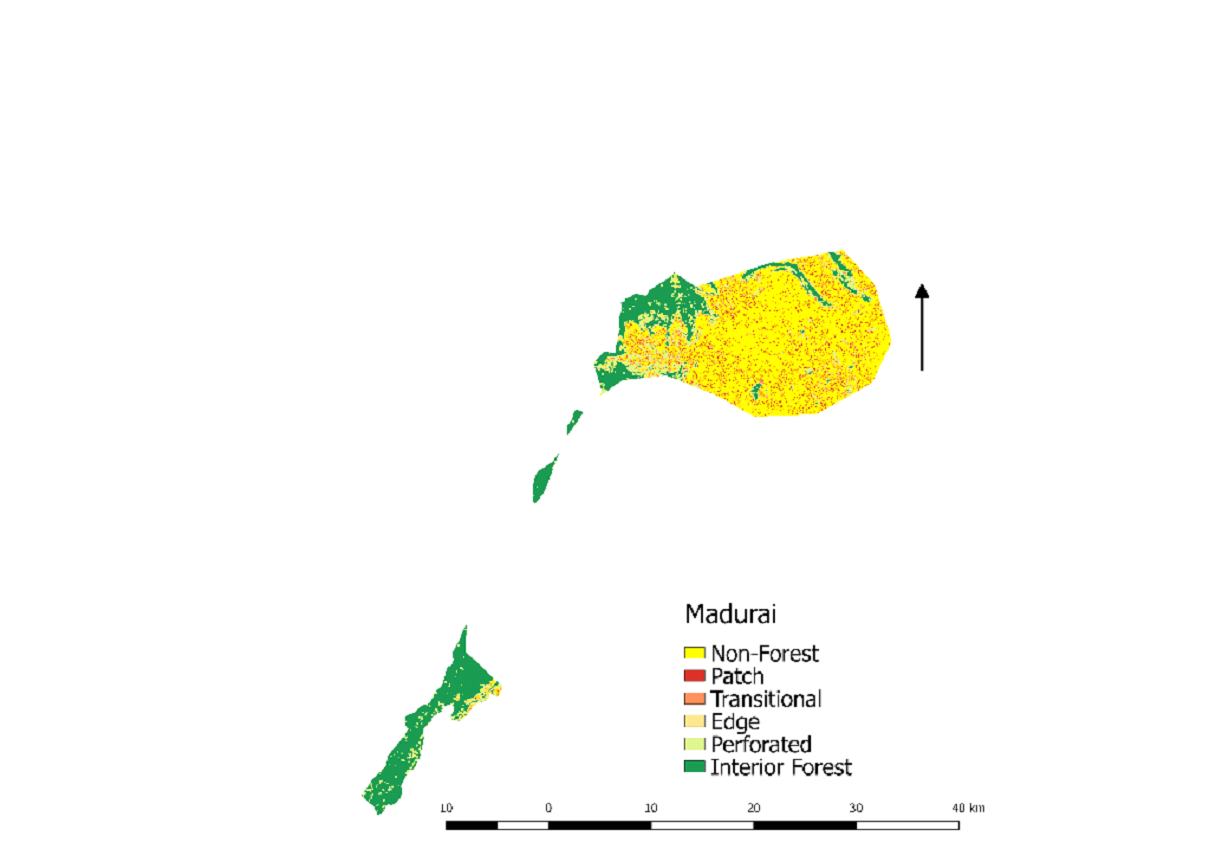
Figure 5. Forest fragmentation in Southern Western Ghats
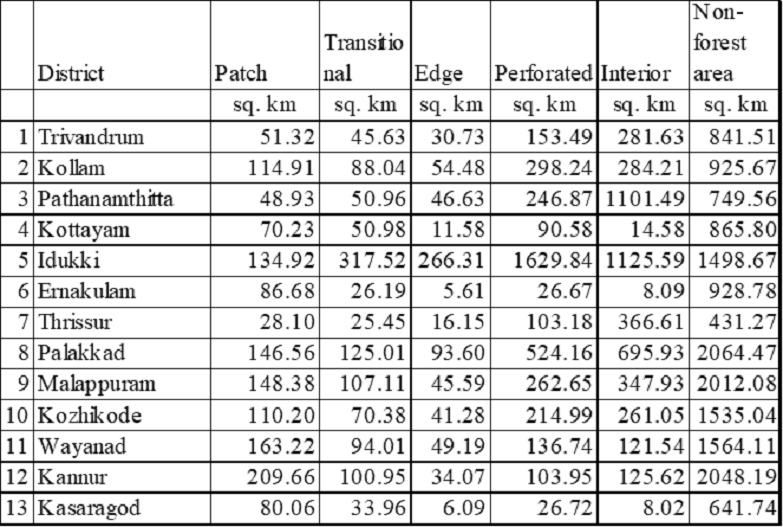
Table 11. Forest Fragmentation Statistics of Kerala
Table 12. Forest Fragmentation Statistics of Tamil Nadu
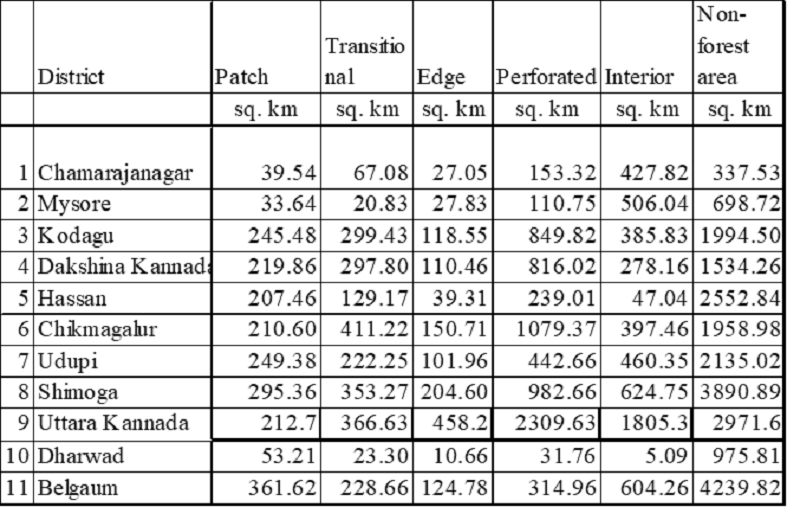
Table 13. Forest Fragmentation Statistics of Karnataka
Table 14. Forest Fragmentation of Southern Western Ghats
Forest Fragmentation Comment
| Forest Fragmentation |
Comment |
|
Interior forest is only around 15%. The area of patch
forest in Kerala and Karnataka is 4.9%, whereas Tamil
Nadu has 3.1% of patch forest. The edge forest was
observed to be more in the districts of Karnataka
(3.35%).
|

|
Kerala has a total interior forest 4742.29 sq km, patch
1393.17 sq km, and edge 701.31 sq km from the total
area.
|
| District |
Statistics |
|
Interior- 8.09 sq km
Patch- 86.68 sq km
Edge- 5.61 sq km
|
|
Interior- 1125.59 sq km
Patch- 134.92 sq km
Edge- 266.31 sq km
|
|
Interior- 14.58 sq km
Patch- 70.23 sq km
Edge- 11.58 sq km
|

|
Interior- 261.05 sq km
Patch- 110.20 sq km
Edge- 41.28 sq km
|
|
Interior- 347.93 sq km
Patch- 148.38 sq km
Edge- 45.59 sq km
|
|
Interior- 695.93 sq km
Patch- 146.56 sq km
Edge- 93.60 sq km
|
|
Interior- 1101.49 sq km
Patch- 48.93 sq km
Edge- 46.63 sq km
|
|
Interior- 366.61 sq km
Patch- 28.10 sq km
Edge- 16.15 sq km
|
|
Interior- 125.62 sq km
Patch- 209.66 sq km
Edge- 34.07 sq km
|
|
Interior- 8.02 sq km
Patch- 80.06 sq km
Edge- 6.09 sq km
|
|
Interior- 281.63 sq km
Patch- 51.32 sq km
Edge- 30.73 sq km
|
|
Interior- 121.54 sq km
Patch- 163.22 sq km
Edge- 49.19 sq km
|
|
Interior- 284.21 sq km
Patch- 114.91 sq km
Edge- 54.48 sq km
|
| Forest Fragmentation of Tamil Nadu of SWG |
Comment |
|
Tamil Nadu has total interior forest 4127.78 sq km,
patch 766.06 sq km and edge 625.62 sq km from the total
area.
|
| District |
Statistics |
|
Interior- 716.57 sq km
Patch- 118.39 sq km
Edge- 75.46 sq km
|
|
Interior- 411.81 sq km
Patch- 148.44 sq km
Edge- 121.21 sq km
|
|
Interior- 23.05 sq km
Patch- 0.81 sq km
Edge- 2.45 sq km
|
|
Interior- 167.16 sq km
Patch- 73.61 sq km
Edge- 37.76 sq km
|
|
Interior- 92.30 sq km
Patch- 19.52 sq km
Edge- 11.23 sq km
|
|
Interior- 751.08 sq km
Patch- 69.10 sq km
Edge- 140.26 sq km
|
|
Interior- 988.94 sq km
Patch- 114.60 sq km
Edge- 49.48 sq km
|
|
Interior- 105.67 sq km
Patch- 50.00 sq km
Edge- 20.72 sq km
|
|
Interior- 235.84 sq km
Patch- 60.88 sq km
Edge- 33.37 sq km
|
| Forest Fragmentation of Karnataka Part of SWG |
Comment |
|
Karnataka has a total interior forest of 5542.07 sq km,
patch 2128.85 sq km, and edge 1374.13 sq km from the
total area.
|
| District |
Statistics |
|
Interior- 604.26 sq km
Patch- 361.62 sq km
Edge- 124.78 sq km
|
|
Interior- 5.09 sq km
Patch- 53.21 sq km
Edge- 10.66 sq km
|
|
Interior- 278.16 sq km
Patch- 219.86 sq km
Edge- 110.46 sq km
|
|
Interior- 47.04 sq km
Patch- 207.46 sq km
Edge- 39.31 sq km
|
|
Interior- 506.04 sq km
Patch- 33.64 sq km
Edge- 27.83 sq km
|
|
Interior- 427.82 sq km
Patch- 39.54 sq km
Edge- 27.05 sq km
|
|
Interior- 385.83 sq km
Patch- 245.48 sq km
Edge- 118.55 sq km
|
|
Interior- 624.75 sq km
Patch- 295.36 sq km
Edge- 204.60 sq km
|
|
Interior- 460.35 sq km
Patch- 249.38 sq km
Edge- 101.96 sq km
|

|
Interior- 1805.27 sq km
Patch- 212.7 sq km
Edge- 458.22 sq km
|
|
Interior- 397.46 sq km
Patch- 210.60 sq km
Edge- 150.71 sq km
|
Human-Wildlife Conflict locations:
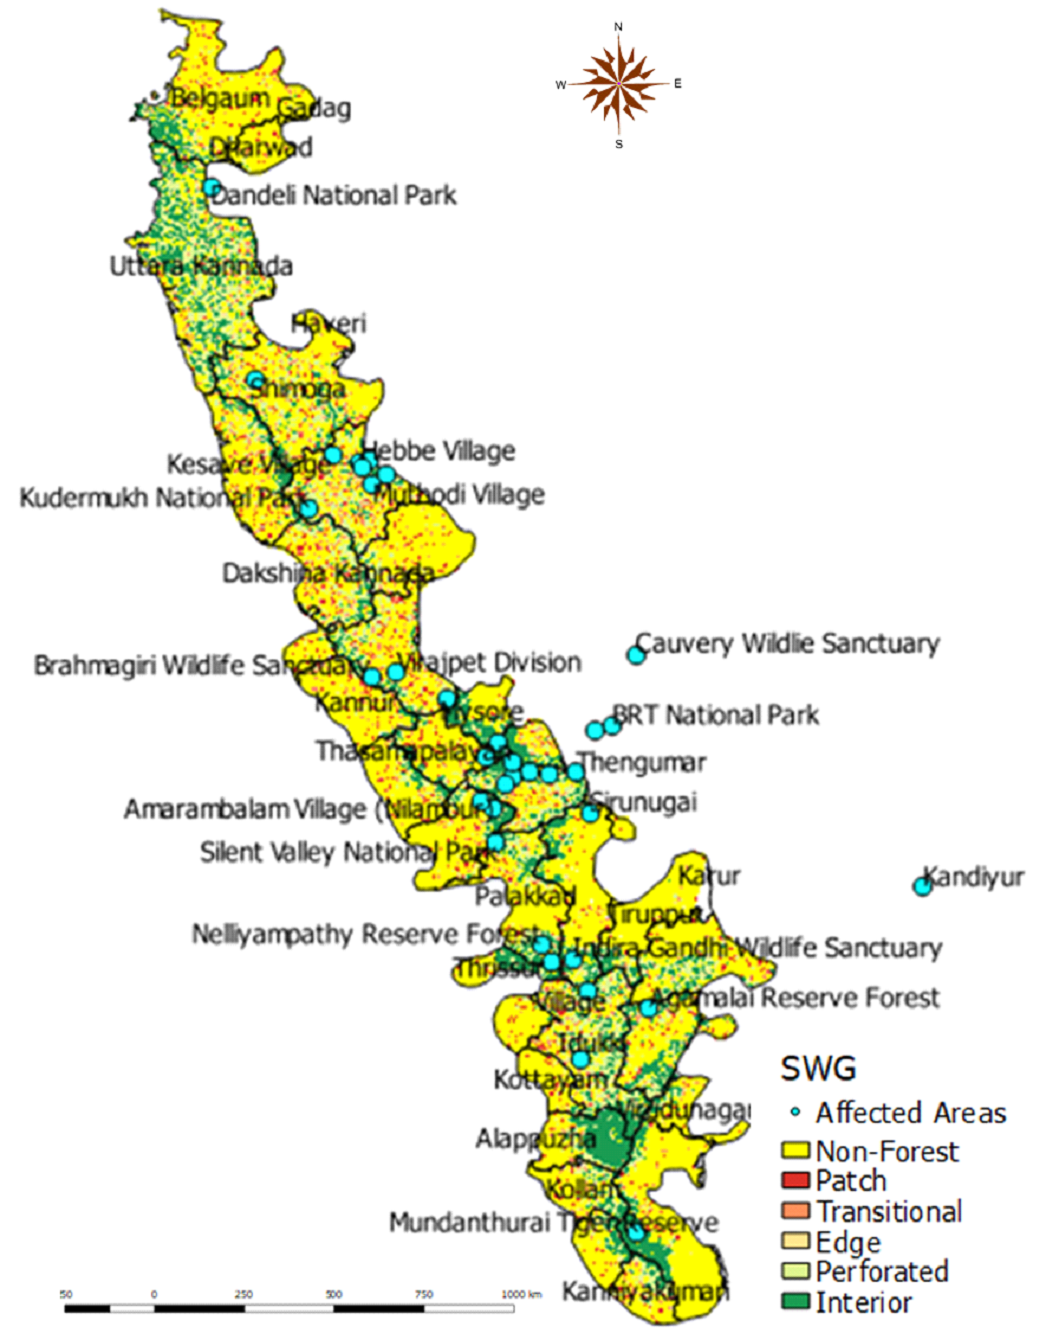
Figure 6. Affected areas due to human-wildlife conflict in
SWG
The human-animal conflict location details were compiled by
reviewing published literature such as newspaper articles,
forest
reports, and journals. The causal factor of human-animal
conflicts
are assessed with the estimation of spatial patterns of forest
fragmentation in the SWG. The results shown in Figure 6 depict
that
conflicts have been occurring in and around the edge and the
patch
forest. The top species that are involved in the conflict are
the
Asian Elephant (Elephas maximus), Tigers (Panthera tigris),
Leopards
(Panthera pardus), Wild Dog (Dholes – Cuon alpinus), Jackal
(Canis
aureus), Gaur (Bos gaurus), Sloth Bear (Ursus ursinus), Sambar
(Rusa
unicolor), Cheetal (Axis axis), Wild Boar (Sussc rofa). Most
villages around or in the protected areas are severely affected
by
the animals preying on the livestock and hampering their crops.
Some
of the villages like Shettihalli, Gudalur, Thengumar, Sirunugai,
Kandiyur, Thasamapalayan, Kesave, Muthodi, Hebbe, Hipla, Madla,
Moyar, Masinagudi, Amarambalam, Vazhikkadavu are severely
affected
due to these animals. Villages closer to the protected areas are
affected by human-animal conflicts due to rampant grazing of
livestock within reserves. Some of the villages are located
inside
the protected areas also res[ponsible for higher conflicts, for
example, Shettihalli village in the Shettihalli Wildlife
Sanctuary.
The major conflict was observed due to tigers and leopards
preying
on their livestock along with tigers affecting their crops
(Roshan
et al., 2014) . Kesave, Muthodi, Hebbe villages in the
Chikmagalur
district of Karnataka were observed to be facing the same issue.
The
elephant is one of the species that come under the radar for the
conflict in the whole of SWG due to the accute food and water
shortages within the forests. Human-elephant conflict incidents
were
reported in Virajpet division which has increased over the years
(Bal et al., 2011) .
Another major conflict area is the north and
south forest divisions of Nilambur in Mallapuram district,
Kerala.
The conflict species is elephants. It was observed that most
villagers experienced difficulties associated with elephants
(Rohini
et al., 2016) . The fear related to the presence of
elephants near
their residences and restriction of the free movement was the
most
critical problem due to elephants. Previous studies in Kerala
have
observed a higher incidence of crop-raiding by elephants in the
rainy season (Easa & Sankar 2001). But due to the increased
fragmentation of forested land for agricultural activities,
animals'
habitat and food are shrinking in size, leading to increased
hostile
actions by elephants. One of the major areas where this hostile
nature can be observed between elephants and humans is the
wildlife
sanctuary and protected areas in the Idduki district of Kerala,
Dindigul, and Theni district of Tamil Nadu like Indira Gandhi
Wildlife Sanctuary, Agamalai reserve forest. These areas are
dominated by evergreen and moist deciduous forest, but the
forest is
fragmented due to tea and coffee plantation in these areas as
more
patch forest and the perforated forest was observed through the
fragmentation map. In the process of moving from one landscape
to
another, elephants raid the crops laid by the humans, increasing
conflicts. Sugarcane, paddy, banana, coconut, and areca nut are
the
main crop targets of elephants which are available throughout
the
year. Roads like national highways laid inside the dense forest
areas are also responsible for high mortality rates. Other
conflict
zones are observed in parts of Hassan and Tumkur districts of
Karnataka, where relatively small numbers of elephants are using
areas that are almost entirely homesteads and privately-owned
agriculture that causes disproportionately large losses to human
property and life while suffering intense retaliation and heavy
mortality themselves
(Madhusudan
et al., 2015) .
Other central conflict districts are Chamarajanagar in
Karnataka
and The Nilgiris district in Tamil Nadu. They both have
protected
areas (Mudumalai Wildlife Sanctuary, Nilgiri North Forest
division)
and Tiger reserves (Bandipur Tiger Reserve) which are
fragmented, as
seen in Table 15. They both constitute high biodiversity due to
the
high forested area of moist and dry deciduous in these regions.
The
clearing of forest areas for monoculture and tea plantation,
especially in the Nilgiris region, has increased human-animal
conflicts in some villages like Moyar, Masinagudi, and
Chemmanatham.
Recent incidences in Bandipur tiger reserve and Nagarahole tiger
reserve about increased Human-Tiger / Leopard Conflict have
thrown
up alarming situations in these areas. During 2015-16, there
were
two incidents of human death caused by tigers, in which one
tiger
was shot down (as it had turned into a man-eater) while the
other
was captured and kept in Mysuru Zoo.
Under instances when the cattle are being preyed upon by
wild
animals. Also, delay in the payment of compensation to affected
families has increased the instances of retaliatory wildlife
killings by poisoning, gunning down, and electrocuting in and
around
protected areas.
Table 15. Wildlife corridors with Human-wildlife conflict
affected areas
| District |
Wildlife Corridors (Pink color depicts wildlife
corridor)
|
Conflict areas and causes |
|
The Nilgiris
|
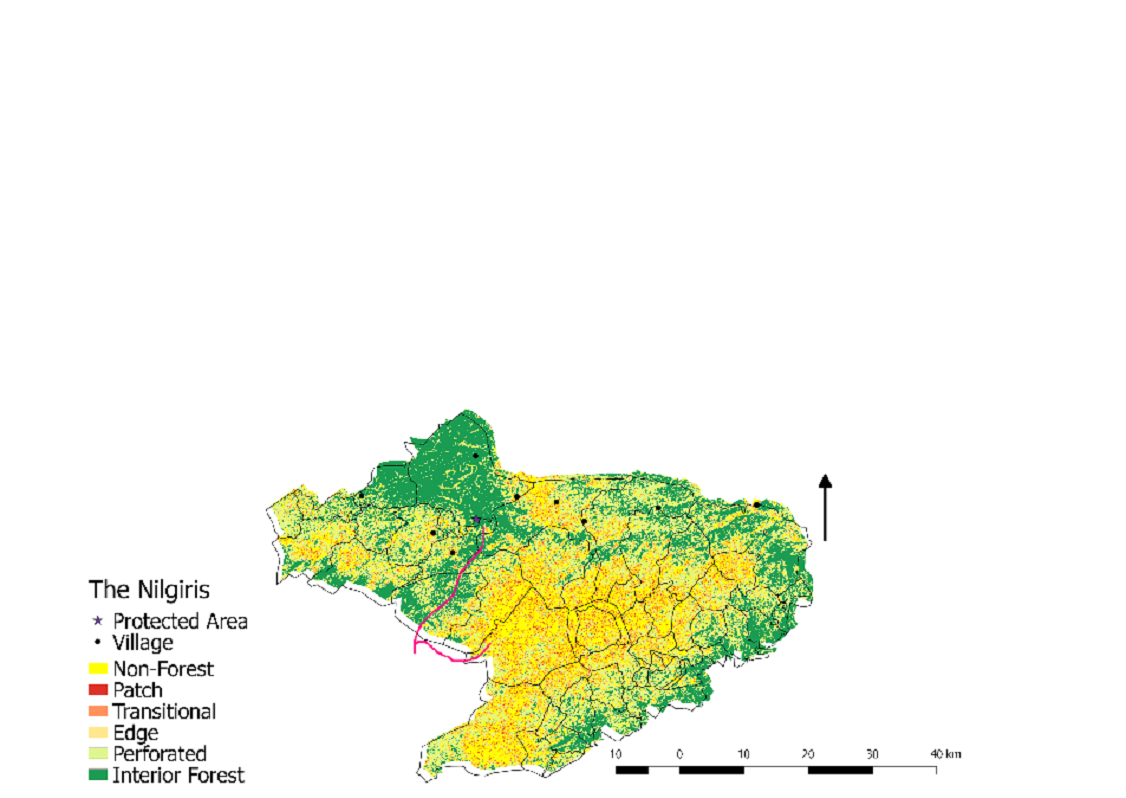
|
Gudalur is the most affected village. It is mainly
affected by elephants and Tigers. Villages like
Pattavayal, Padanthorai, Theppakadu, Mavanalla,
Masinagudi, Moyar are present around the edge forest and
in the perforated areas of the district.
|
|
Theni
|
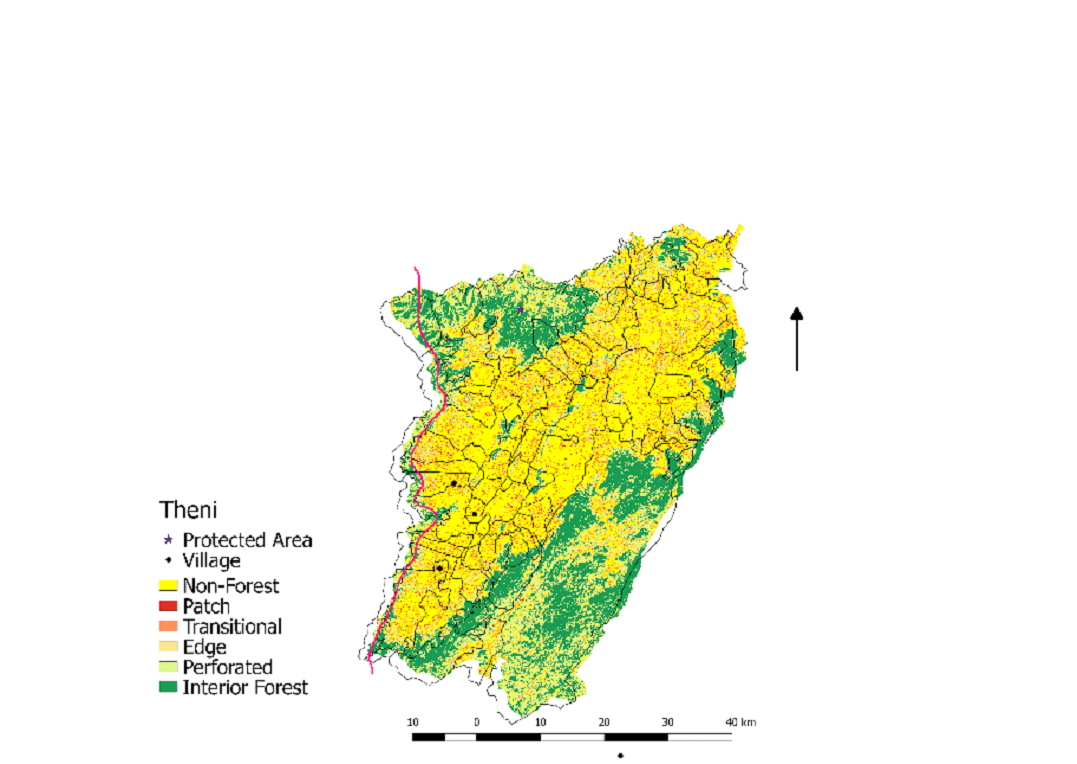
|
Fragmentation is the main reason behind human-animal
conflicts. Both Tiger and Elephant corridors are present
in the district, affecting the villages near the patch
and perforated forest. Kombai, Uttamapalayam, Cumbum are
some of the villages affected.
|
|
Coimbatore
|

|
Croplands in patch forests (fragmented forest) along the
path of elephant movement are prime reasons for
conflict. Sirumugai, Karamadai, Periyanaickenpalayam are
some of the villages affected.
|
|
Kodagu
|
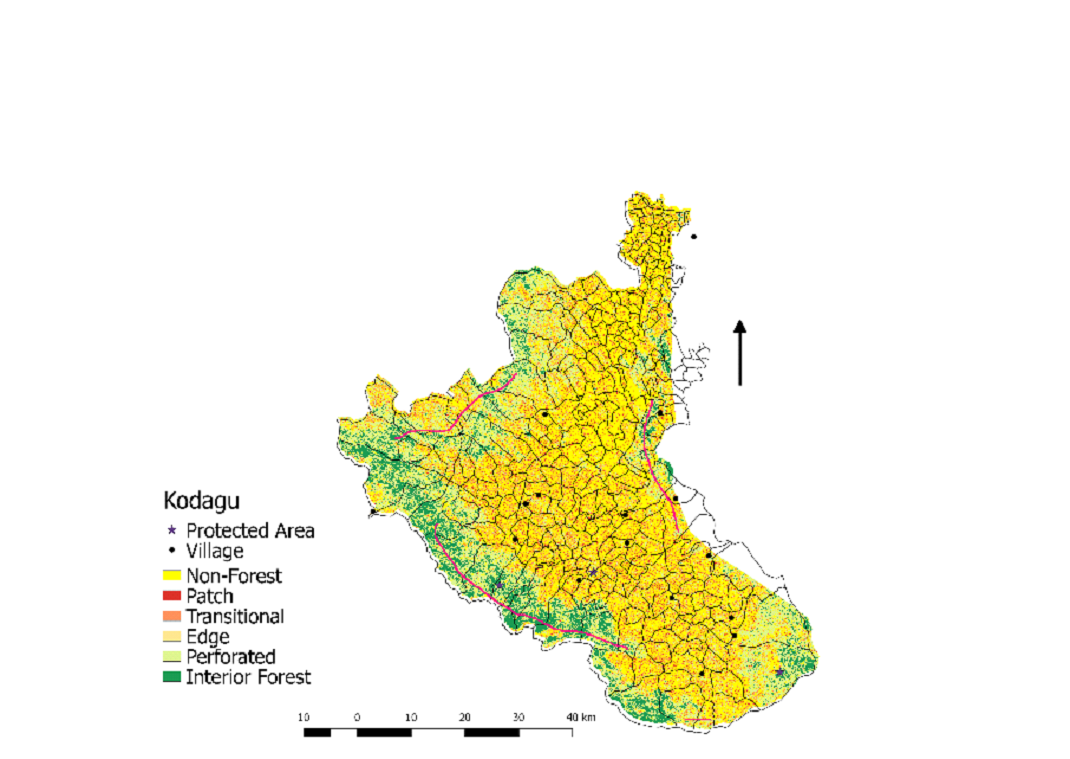
|
Kodagu has the maximum number of villages. Most of the
native forests in Kodagu district are fragmented due to
mushrooming of buildings, etc., which has increased
animal conflicts with the prevalence of patch and
perforated forest areas in the district. Napoklu,
Kokeri, Chowrira, Virajpet, Guyya are some of the
affected villages. It is mainly affected by Elephants.
|
|
Shimoga
|
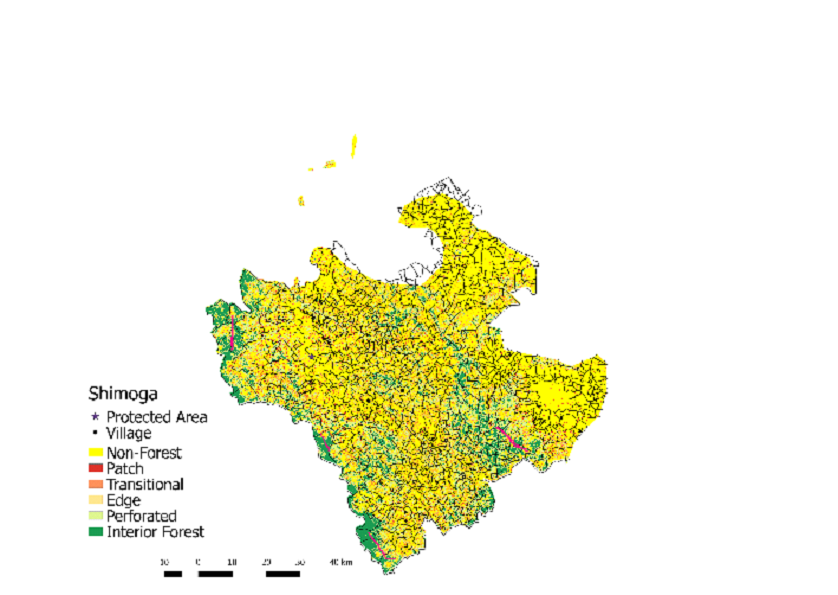
|
Tiger and elephant corridors are present in the
district, which are mostly fragmented, consisting of
patch and perforated forests. Affected villages are
Kusgundi, Hosanagar as they are present close to the
corridors.
|
|
Chamarajanagar
|
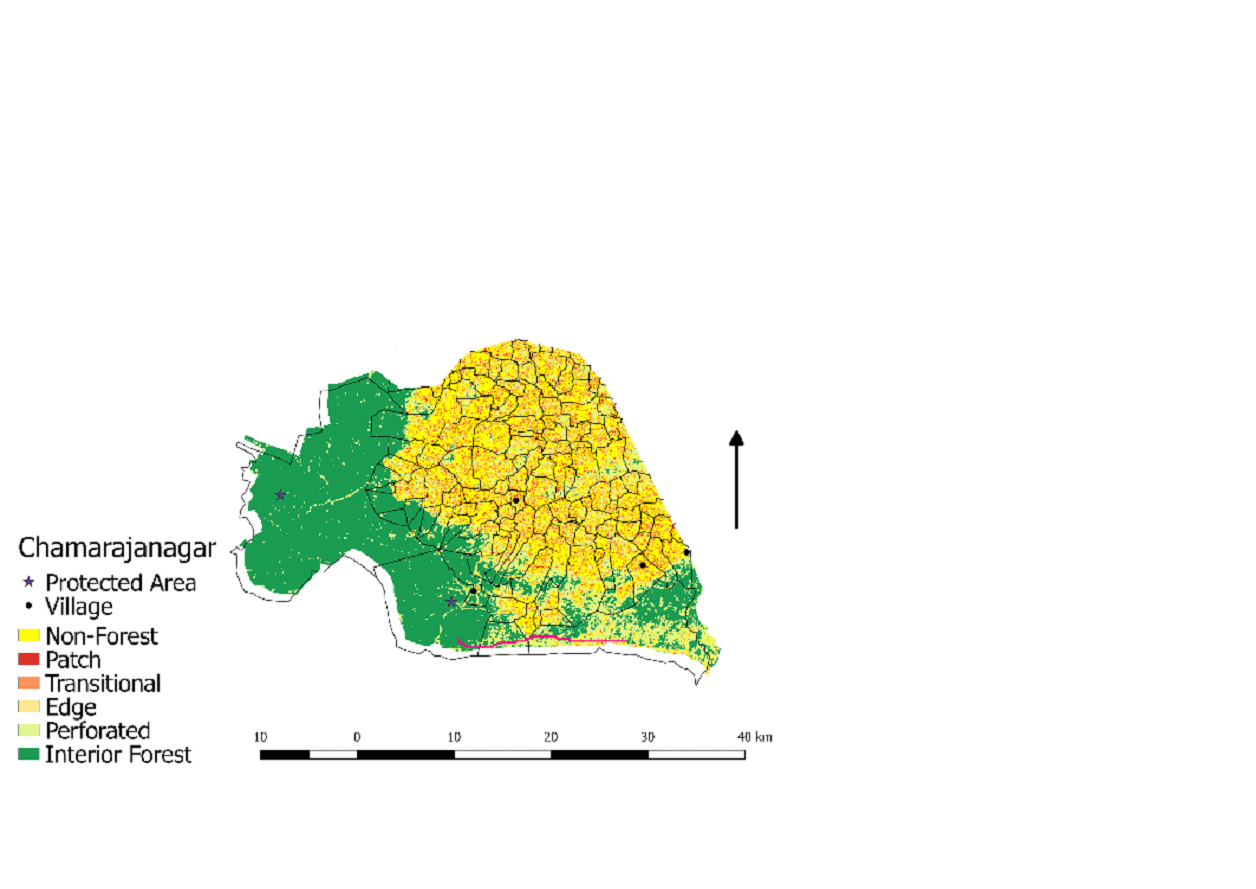
|
Elephants are the main reason for the conflict. The
elephant corridor, Bandipur to Mudumalai, is perforated
and consists of edge forest due to the presence of
cropland nearby. Villages like Kadabur, Kundakere, and
Hangalapura are affected villages.
|
|
Malappuram
|
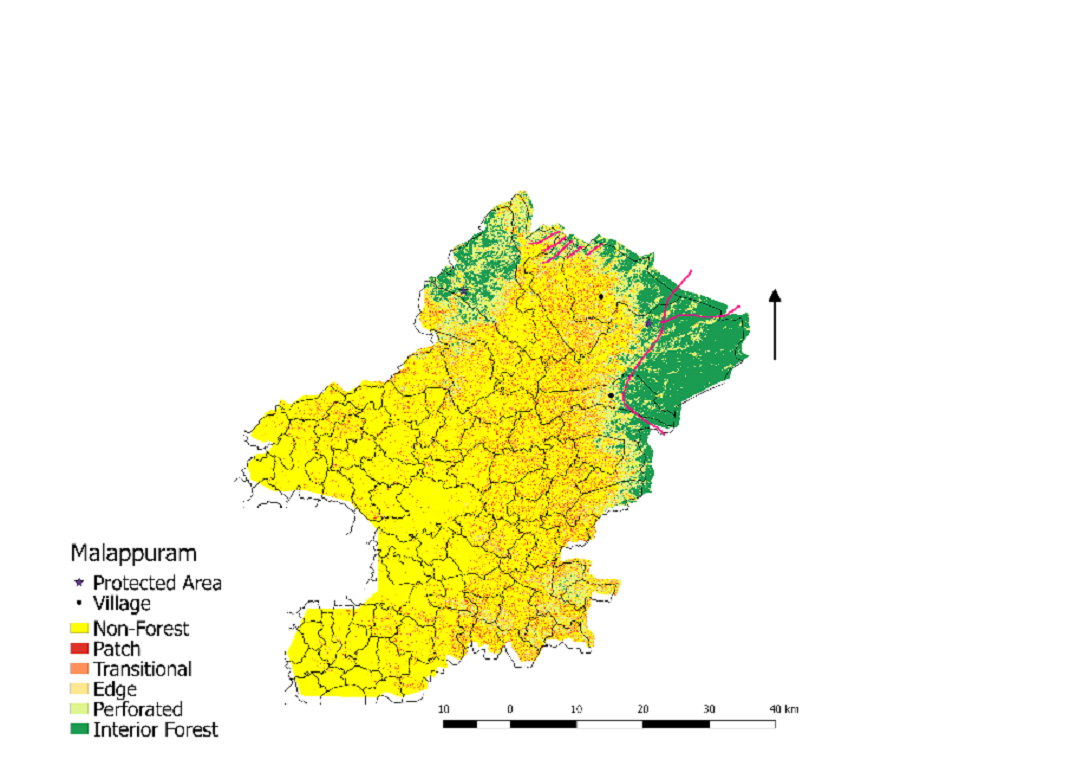
|
Both the elephant and the tiger corridors are present.
Mainly the conflict is associated with Elephants in the
district. The villages are present near the fragmented
forest and along the corridors as per the map.
Vizhikkadavu and Amarambalam are the main villages
affected.
|
|
Idukki
|
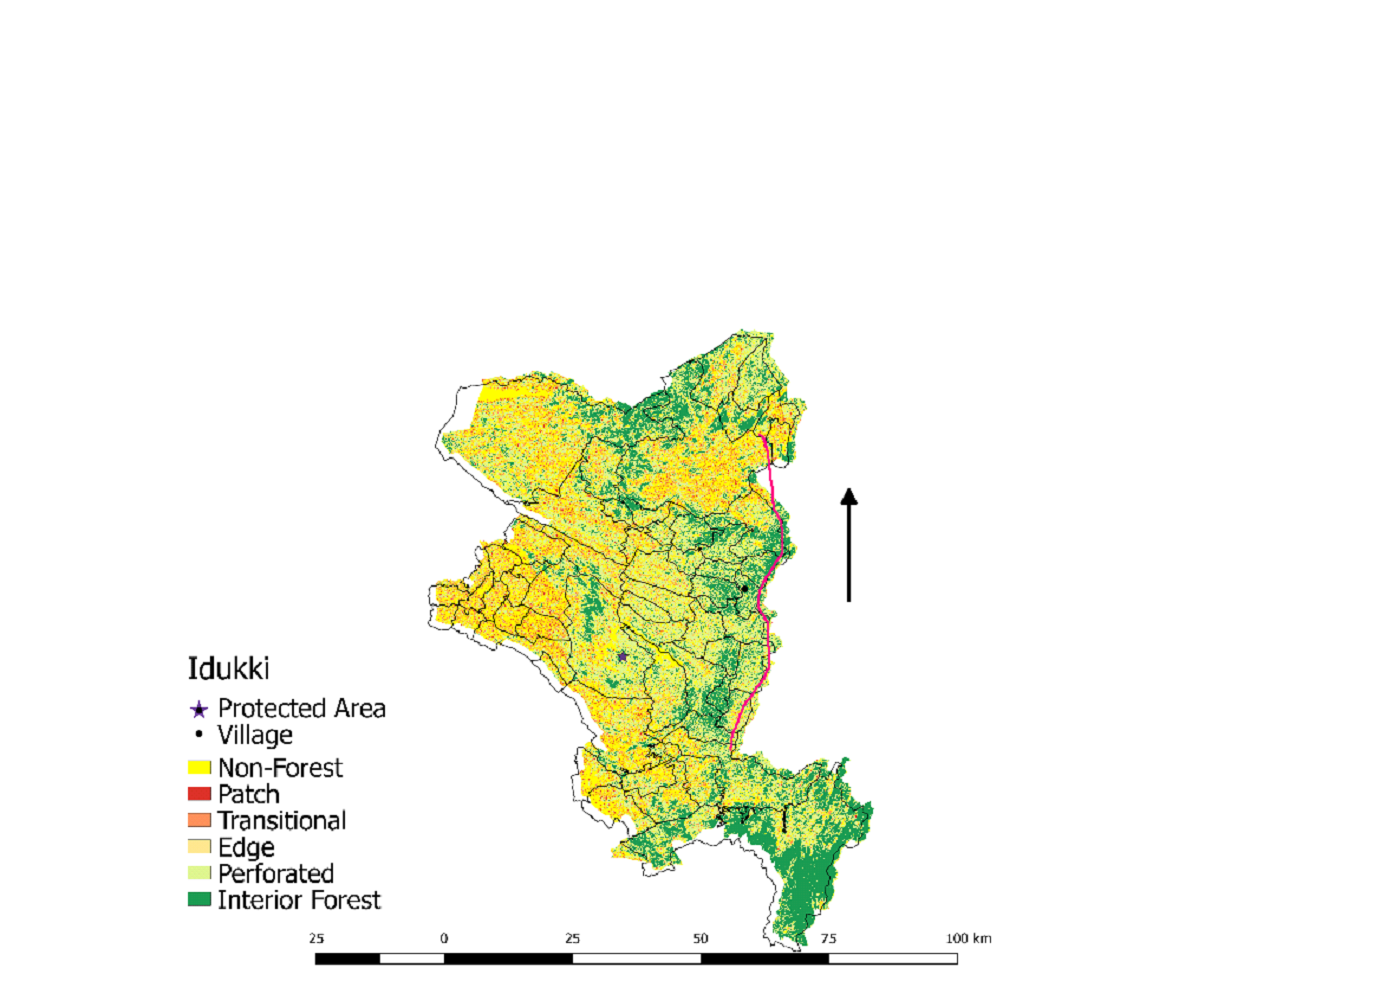
|
The corridor is present along the boundary of the Idukki
district of Kerala and the Theni district of Tamil Nadu.
The main cause of conflict is fragmentation as seen in
the map along the corridors. Sinkukandam is one of the
villages that is affected mainly by elephants movement.
|