|
CARRYING CAPACITY BASED CONSERVATION AND SUSTAINABLE MANAGEMENT OF RIVERINE ECOSYSTEMS
(PDF)
T V Ramachandra
Energy and Wetlands Research Group,
Centre for Ecological Sciences,
Indian Institute of Science - 560012
3. Materials & Method
3.1. Study Area
The river Netravathi originates in Bangrabalige valley, Yelaneeru Ghat of Kudremukh in Chikkamagaluru district of Karnataka, Western Ghats, India [4]. The river has a catchment area of 4409 km2 and covers Chikmagaluru, Hassan, Kodagu, Dakshina Kannada and Udupui districts (Figure 1) in 11 taluks. Rainfall varies between 2600 mm (Plains of Mudigere and Sakleshpura taluk) to over 5500 mm (Ghats). Elevation of the basin ranges from < 0 to 1872 m It is the lifeline of Dakshina Kannada region supporting the enormous population with rich resource base and diverse cultures. This sacred river runs through numerous popular pilgrim places such as Dharmasthala, Kukke Subramanya etc.. Netravathi main course merges with the river Kumaradhara at Uppinangadi before merging into the Arabian Sea with Gurupura river [4]. The river forms major water source to the Mangalore city, Bantwal and many towns. Many valleys served by watercourses and riparian plains are the seats of the famed spice gardens growing crops like, coconut, arecanut, banana, cardamom, turmeric, black pepper, cocoa, ginger and vanilla. Netravathi river basin is part of the ecologically fragile Western Ghats, one among 35 global hotspots of biodiversity supporting diverse flora and faunal species. Netravathi River systems has numerous perennial streams with typical tropical climax evergreen forested catchment areas of high conservation value. The forest types in the basin vary from tropical wet evergreen to semi-evergreen rain forests, tropical moist deciduous forests, scrub jungles, grasslands and savannas, scattered trees along plantations and abandoned fields [4].
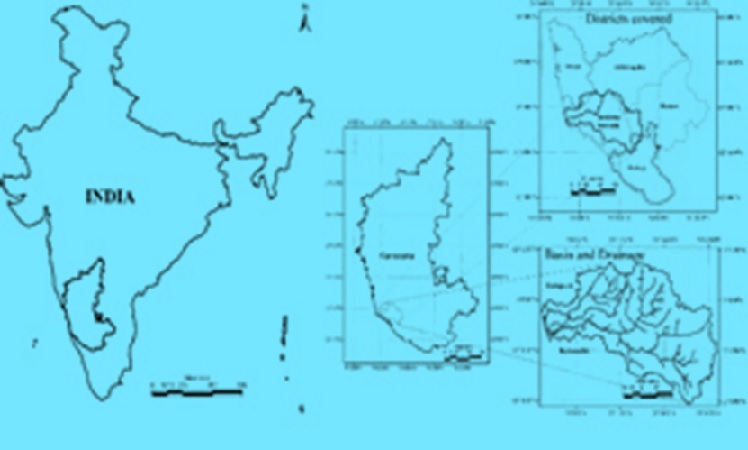 Figure 1: Netravathi River basin, Central Western Ghats, Karnataka State, India
3.2. Method
The research involved
(i) spatial data analysis – land use analyses to understand the landscape dynamics,
(ii) field investigations to map flora, fauna, social aspects, etc.,
(iii) ESR delineations.
The study region was divided [4] into 5’x5’ grids (9 x 9km) for priortiosing regions with the exceptional biodiversity and ecologically fragile. Grids were assigned the weightages based on the variables listed in Table 1 and equation1 [3,4]. A weightage metric score based on multiple data sets (figure 2 and table 1) were considered to priritise the regions at panchayath levels for conservation and management planning. The weightage [3,4] is defined by:
 Where n is the number of data sets, Vi is the value associated with criterion i, and Wi is the weight associated to that criterion. Each criterion is described by an indicator mapped to a value normalized between 10 to 1. The value 10 corresponds to very higher priority for conservation whereas 1 is converse to above. The value 7, 5 and 3 corresponds to high, moderate, low levels of conservation.
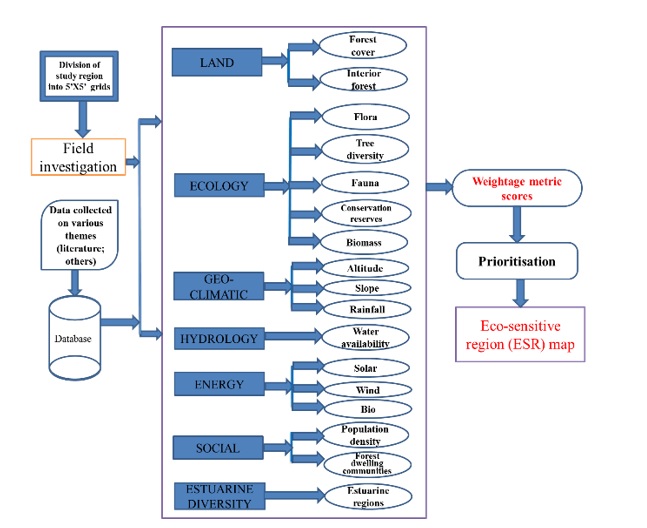 Figure 2: Method adopted for the ESR analysis
| Themes |
Weightages |
| 1 |
3 |
5 |
7 |
10 |
| LAND |
| Land use |
FC<20% |
20<FC<40% |
40<FC<60% |
60<FC <80% |
FC >80% |
| Interior forest |
IF<20% |
20<IF<40% |
40<IF<60% |
60<IF<80% |
IF> 80% |
| ECOLOGY |
| Flora |
NEND |
END<30% |
30<END<50% |
50<END<70% |
END>70% |
| Tree diversity |
SHD<2 |
2<SHD<2.5 |
2.5 <SHD<2.7 |
2.7<SHD<3 |
SHD>3 |
| Fauna |
- |
NEND |
- |
- |
END |
| Conservation reserves (CR) |
- |
- |
- |
- |
National parks, Wild life reserves, Myristica swamps, Sanctuaries |
| Biomass (Gg) |
BM<250 |
250<BM<500 |
500<BM<750 |
750<BM<1000 |
BM>1000 |
| ENERGY |
| Solar |
- |
- |
<5 KWh/m2/day |
5-6 KWh/m2/day |
6-6.5 KWh/m2/day |
| Wind |
- |
- |
2.4 to 2.55 m/s |
2.5 to 2.6 m/s |
2.6 to 2.7 m/s |
| Bio |
- |
- |
SD<1 |
1<SD<2 |
SD>2 |
| GEO-CLIMATIC |
| Altitude |
|
|
|
|
|
| Slope |
- |
- |
- |
Slope >20% |
Slope > 30% |
| Precipitation |
|
|
|
|
|
| HYDROLOGY |
| Stream flow |
WA<4 |
4<WA<6 |
6<WA<9 |
9<WA<12 |
WA=12 |
| SOCIAL |
| Population density (PD) |
PD>200 |
100<PD<200 |
100<PD<150 |
50<PD<100 |
PD<50 |
| Forest dwelling communities (Tribes) |
- |
Tribes are present then assigned 10; if no tribal population exists, then assigned as 0 |
| SOCIAL |
| Population density (PD) |
PD>200 |
100<PD<200 |
100<PD<150 |
50<PD<100 |
PD<50 |
| ESTUARINE DIVERSITY |
| Estuarine regions |
- |
low |
moderate |
high |
very high |
FC-forest cover; IF-interior forest cover; END-endemic; NEND-non-endemic; BM-biomass; SD-supply to demand ratio; WA-Water availability
Table 1: Various attributes considered and their weightages
NEXT
|