
5.1 Mysore: Vegetation cover of the study area assessed through NDVI (Figure 2a), shows that area under vegetation has declined to 9.24% (2009) from 51.09% (1973). Temporal NDVI values are listed in Table 1.
Land use analysis: Land use assessed for the period 1973 to 2009 using Gaussian maximum likelihood classifier is listed Table 2a and the same is depicted in figure 2b. The overall accuracy of the classification ranges from 75% (1973), 79% (1989), 83% (1999) to 88% (2009) respectively. Kappa statistics and overall accuracy was calculated and is as listed in Table 2b. There has been a significant increase in built-up area during the last decade evident from 514% increase in urban area. Other category also had an enormous increase and covers 166 % of the land use. Consequent to these, vegetation cover has declined drastically during the past four decades. The water spread area has increased due to the commissioning of waste water treatment plants (ex. Vidyaranyapura, Rayankere, Kesare) during late 90’s and early 2000.
Table 1: Temporal Land cover details.
| Year | Vegetation | Non vegetation | ||
| % | Ha | % | Ha | |
| 1973 | 51.09 | 10255.554 | 48.81 | 9583.83 |
| 1989 | 57.58 | 34921.69 | 42.42 | 8529.8 |
| 1999 | 44.65 | 8978.2 | 55.35 | 11129.77 |
| 2009 | 09.24 | 1857.92 | 90.76 | 19625.41 |

Figure 2a: Temporal Land cover changes during 1973 – 2009
Table 2a: Temporal land use details for Mysore
| Land use | Urban | Vegetation | Water | Others |
| Year | ||||
| 1973 | 222.93 | 10705.68 | 124.47 | 9054.99 |
| 1989 | 229.41 | 13242.51 | 78.75 | 6557.4 |
| 1999 | 730.8 | 8360.1 | 117.9 | 10899.2 |
| 2009 | 3757.489 | 1159.336 | 142.58 | 15050.5 |
| Total (Land in ha) 20108.91 | ||||
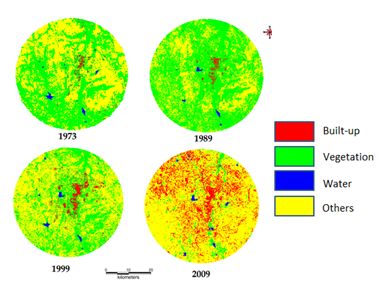
Figure 2b: Classification output of Mysore
Table 2b: Kappa statistics and overall accuracy
| Year | Kappa coefficient | Overall accuracy (%) |
| 1973 | 0.76 | 75.04 |
| 1989 | 0.72 | 79.52 |
| 1999 | 0.82 | 78.46 |
| 2009 | 0.86 | 84.58 |
5.2 Shimoga: NDVI was calculated using r.mapcalc in GRASS, open source GIS and results are depicted in figure 3a and Table 3a. The analysis reveals that there was reduction in the vegetation cover from 89% to 66% during the past two decades in the study region.
Table 3a: Results of land cover analysis
| Class | Vegetation in % | Non-Vegetation in % |
| Years | ||
| 1992 | 89.35 | 10.65 |
| 1999 | 78.92 | 21.08 |
| 2005 | 74.83 | 25.16 |
| 2010 | 66.72 | 33.28 |
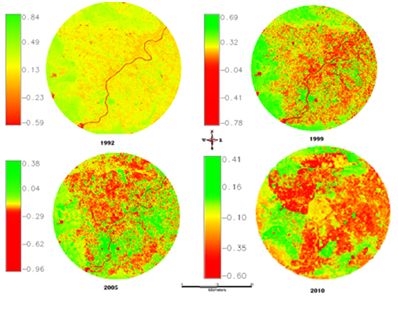
Figure 3a: Results of Land cover analysis
Land use analysis:Temporal land use is given in figure 3b and the statistics of category-wise land uses are for 5 time period is given in table 3b. Urban category has increased from 13% (1992) to 33% (2010), which is about 253 times during the last two decades. Notable factor is that the Cultivation which is the major land use in the study region has increased to a small extent. Vegetation had decreased drastically over last two decades from 30% (1992) to about 6% (2010). The results of the overall accuracy for each classification map were 90% (1992), 90.33% (1999), 92.45% (2005) and 94.12% (2010). Kappa values were 0.84 (1992), 0.85 (1999), 0.9 (2005) and 0.91 (for 2010).
Table 3b: Results of Land use analysis
| Class | Urban % | Vegetation % | Water % | Cultivation % |
| Years | ||||
| 1992 | 13.58 | 30.94 | 1.52 | 53.95 |
| 1999 | 25.32 | 24.82 | 1.51 | 48.35 |
| 2005 | 28.16 | 10.09 | 1.12 | 60.62 |
| 2010 | 33.56 | 5.52 | 1.2 | 59.72 |
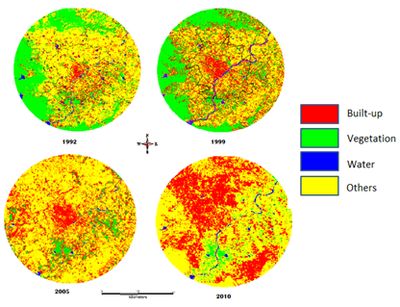
Figure 3b: Results of Land use analysis
5.3 Hubli –Dharwad: Both Hubli and Dharwad dominated by cultivable land area has a huge green area which includes both Green cover and cultivation. Vegetation cover of the study area assessed through NDVI (Figure 4a), shows that area under vegetation has declined from 97% (1989) to 78% (2010) in Hubli and from 98% (1989) to 86% (2010) in Dharwad. Temporal NDVI values are listed in Table 4a.
Land use analysis: Land use assessed for the period 1973 to 2009 using Gaussian maximum likelihood classifier is listed Table 4b and the same is depicted in figure 4b. The overall accuracy of the classification ranges from 76% (1989), 83% (2000), 81% (2005) to 94% (2010) respectively. Kappa statistics and overall accuracy was calculated and is as listed in Table 4c. There has been a significant increase in built-up area during the last decade evident from table 4c. Other category covers major portion of the land use. Consequent to these, there has been a slight decrease of vegetation cover especially in the Dharwad region during the past three decades.
Table 4a: Temporal Land cover details (%).
| Year | Hubli - Vegetation |
Hubli - Non-Vegetation |
Dharwad - vegetation |
Dharwad - Non-vegetation |
| 1989 | 97.0 | 3.0 | 98.12 | 1.88 |
| 2000 | 94.35 | 5.65 | 96.48 | 3.52 |
| 2005 | 89.73 | 10.27 | 92.21 | 7.79 |
| 2010 | 78.31 | 21.69 | 86.43 | 13.57 |
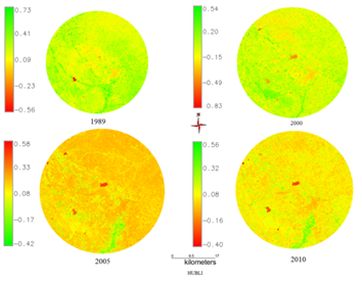
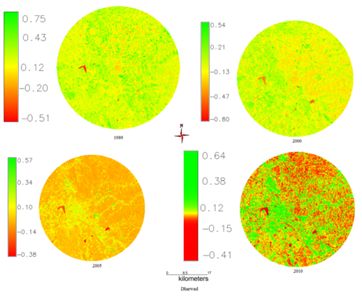
Figure 4a: Temporal Land cover changes during Past three Decades Hubli and Dharwad
Table 4b: Temporal land use details for Hubli
| Land use -Hubli | Urban | Vegetation | Water | Others |
| Year | ||||
| 1989 | 1.08 | 0.22 | 0.64 | 98.06 |
| 2000 | 2.25 | 0.45 | 0.98 | 96.31 |
| 2005 | 9.85 | 0.71 | 0.74 | 88.70 |
| 2010 | 14.62 | 0.42 | 0.65 | 84.30 |
Table 4b: Temporal land use details for Dharwad
| Land use -Dharwad | Urban | Vegetation | Water | Others |
| Year | ||||
| 1989 | 0.62 | 1.43 | 0.51 | 97.45 |
| 2000 | 1.93 | 1.41 | 1.13 | 95.52 |
| 2005 | 3.75 | 1.29 | 0.25 | 94.71 |
| 2010 | 6.47 | 0.69 | 0.47 | 92.36 |
Table 4c: Kappa statistics and overall accuracy
| Year | Kappa coefficient | Overall accuracy (%) |
| 1989 | 0.82 | 76.34 |
| 2000 | 0.89 | 83.54 |
| 2005 | 0.83 | 81.62 |
| 2010 | 0.91 | 94.86 |
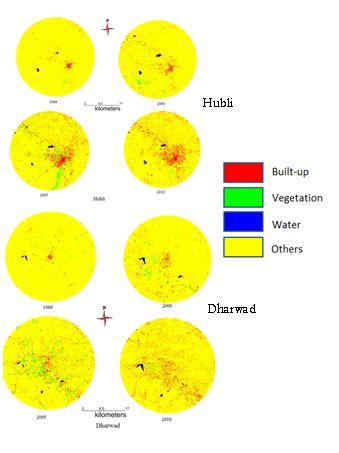
Figure 4b:Classification output of Hubli & Dharwad
5.4 Gulbarga:Land use Land Cover analysis - Vegetation cover analysis: Vegetation cover of the study area assessed through NDVI (Figure 5a) shows that area under vegetation has declined by about 19%. Temporal NDVI values are listed in Table 5a, which shows that there has been a substantial increase in the area other than the vegetation.

Figure 5a: Temporal Land cover changes during 1973 – 2009
| Table 5a: Temporal Land cover details | ||
| Year | Vegetation | Non vegetation |
| % | % | |
| 1973 | 98.01 | 1.99 |
| 1992 | 94.72 | 5.28 |
| 2002 | 91.33 | 8.67 |
| 2010 | 79.41 | 20.57 |
Land use analysis: Land use assessed for the period 1973 to 2010 using Gaussian maximum likelihood classifier is listed Table 5b and the same is depicted in figure 5b. The overall accuracy of the classification Ranges from 73.23% (1973) to 94.32% (2010). Kappa statistics and overall accuracy was calculated and is as listed in Table 5c. There has been a significant increase in built-up area during the last decade evident from 21% increase in urban area. Other category also had an enormous decrease in the land use. Consequent to these, vegetation cover has declined during the past four decades.
Table 5b: Temporal land use details for Gulbarga
| Land use | Urban | Vegetation | Water | Cultivation and others |
| Year | ||||
| 1973 | 1.08 | 1.01 | 0.34 | 97.17 |
| 1992 | 2.62 | 1.54 | 0.40 | 95.44 |
| 2002 | 7.22 | 0.55 | 0.23 | 92.01 |
| 2010 | 22.52 | 0.49 | 0.39 | 76.60 |
Table 5c: Kappa statistics and overall accuracy
| Year | Kappa coefficient | Overall accuracy (%) |
| 1973 | 0.72 | 73.23 |
| 1989 | 0.86 | 89.69 |
| 1999 | 0.82 | 81.47 |
| 2009 | 0.93 | 94.32 |
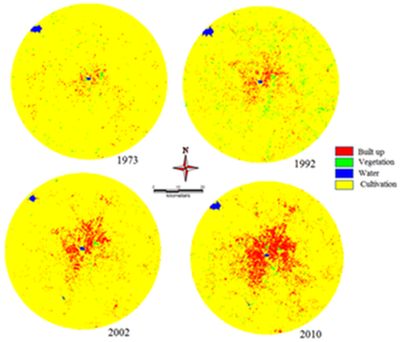
Figure 5b: Classification output of Gulbarga
5.5 Raichur: Vegetation cover analysis - Vegetation cover of the study area assessed through NDVI (Figure 6a), shows that area under vegetation has declined by about 19%. Temporal NDVI values are listed in Table 6a. Which shows that there has been a substantial increase in the Non Vegetative area. There has been an increase from 3 % to 17 percent this tells us that there has been staggering growth of impervious cover in the region, which is also indicated by decrease in vegetative cover.
Land use analysis: Land use assessed for the period 1973 to 2010 using Gaussian maximum likelihood classifier is listed Table 6b and the same is depicted in figure 6b. The overall accuracy of the classification Ranges from 69.28 % (1973) to 88.12 % (2010). Kappa statistics and overall accuracy was calculated and is as listed in Table 6c. There has been a significant increase in built-up area during the last decade evident from 590% increase in urban area which was 1.44% in 1975 has grown to 8.51% considering buffer area. Other category also had an enormous decrease in the land use. Consequent to these, cultivable area has come down drastically.
Table 6a: Temporal Land cover details
| Year | Vegetation | Non vegetation |
| % | % | |
| 1975 | 96.32 | 3.68 |
| 1989 | 92.18 | 7.82 |
| 2001 | 89.36 | 10.64 |
| 2010 | 82.48 | 17.52 |
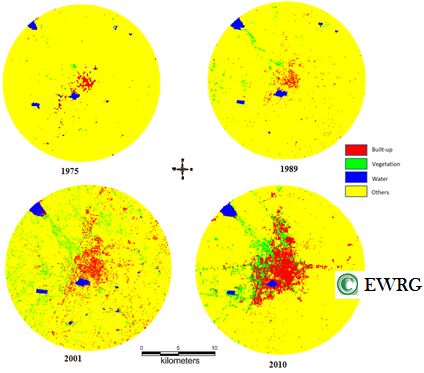
Figure 6b: Classification output of Raichur
Table 6b: Temporal land use details for Raichur
| Land use | Urban | Vegetation | Water | Cultivation and others |
| Year | ||||
| 2010 | 8.51 | 4.81 | 0.97 | 85.71 |
| 2002 | 5.21 | 3.58 | 1.36 | 89.85 |
| 1992 | 2.48 | 0.91 | 1.04 | 95.57 |
| 1973 | 1.44 | 1.62 | 0.88 | 96.16 |
Table 6c: Kappa statistics and overall accuracy
5.6 Bellary: Land use Land Cover analysis- Land cover analysis: Vegetation cover of the study area assessed through the computation of NDVI (Figure 7a). Since as discussed earlier the NDVI values indicate the status of vegetation versus Non vegetation, here vegetation indication all the reflectance’s which have higher values in Near IR region (Cultivation, vegetation etc.). The area under vegetation in 1973 is 57.53% which indicates that total of cultivable and vegetative area, since the open soil was higher in the region. During 1973-2001 there was an increase in cultivable area in these region which showed that vegetation increase in 2001, 2005 and 2010. To understand the vegetation status and cultivation status further and to assess the urban growth land use investigation was carried out. Temporal NDVI values are listed in Table 7a.
Table 7a: Temporal Land cover details.
| Year | Vegetation % |
Non-Vegetation % |
| 1973 | 57.51 | 42.47 |
| 2001 | 94.87 | 5.13 |
| 2005 | 94.8 | 5.2 |
| 2010 | 93.7 | 6.27 |
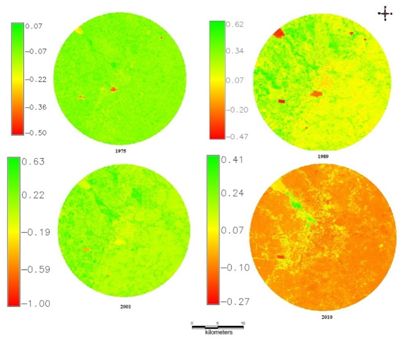
Figure 7a: Temporal Land cover changes during Past three Decades
Land use analysis: Land use assessed for the period 1973 to 2010 using Gaussian maximum likelihood classifier is listed Table 7b and the results is as depicted in figure 7b. The overall accuracy of the classification ranges from 78% (1973), 86% (2001), 84% (2005) to 89% (2010) respectively. Kappa statistics and overall accuracy was calculated and is as listed in Table 7c. There has been a significant increase in built-up area during the last decade evident from table V. There has been a decrease of vegetation cover in the region during the past four decades. Significant increase in other class and the urban class was observed.
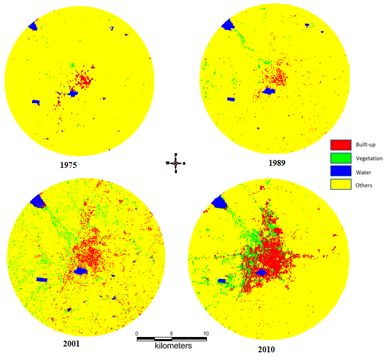
Figure 7b:Classification output of Bellary
Table 7b: Temporal land use details for Bellary
| Land use | Urban | Vegetation | Water | Cultivation and others |
| Year | ||||
| 2010 | 7.42 | 0.48 | 2.04 | 90.07 |
| 2005 | 4.23 | 0.92 | 4.73 | 90.12 |
| 2001 | 2.64 | 0.41 | 2.01 | 94.94 |
| 1973 | 2.12 | 4.61 | 2.35 | 90.92 |
Table 7c: Kappa statistics and overall accuracy
| Year | Kappa coefficient | Overall accuracy (%) |
| 1973 | 0.69 | 78.32 |
| 2001 | 0.84 | 86.94 |
| 2005 | 0.82 | 84.53 |
| 2010 | 0.86 | 89.69 |
5.7 Belgaum: Land Cover Analysis - To understand the ration of vegetation and non-vegetation as primary analysis various land cover indices were analysed. NDVI index proved to provide insights to understand the vegetation cover. NDVI was calculated for all the years for which data is considered, the results of the analysis are shown in Figure 8a and are as tabulated in Table 8a. The results indicate that the vegetation in the study region decreased for 98.8% in 1989 to 91.74% in 2012. Further this necessitated understanding the land use temporally in order to understand the status of various land use.
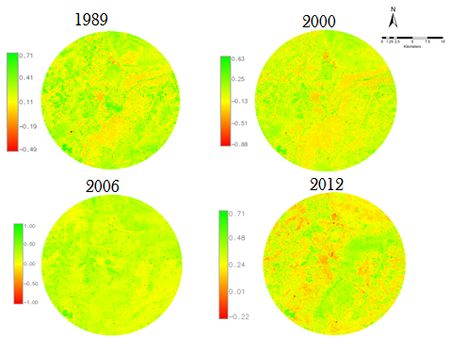
Figure 8a: Land Cover Classification
Table 8a. Land cover analysis
| Year | Vegetation | Non Vegetation |
| 1989 | 98.8% | 1.2% |
| 2000 | 98.41% | 1.59% |
| 2006 | 96.35% | 3.65% |
| 2012 | 91.74 % | 8.26 % |
Land Use Analysis: The spatio temporal land use changes between years 1989 to 2006 were analysed using maximum likelihood Classifier, the results of the analysis are as shown in figure 8b and the temporal land use is as tabulated in listed in Table 8b. The results of the analysis indicate that the urban impervious land use has increased from 0.31 % in 1989 to 6.74% in 2012; vegetation decreased from 4.62% in 1989 to 2.44% in 2012, Water category remained fairly constant.
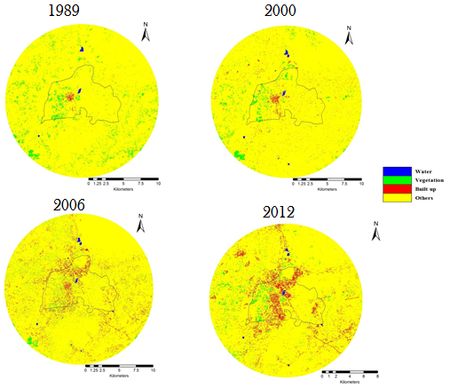
Figure 8b. Land Use Classification
Table 8b. Land Use analysis
| Year | 1989 | 2000 | 2006 | 2012 | ||||
| Land use | % | Area(Ha) | % | Area(Ha) | % | Area(Ha) | % | Area(Ha) |
| Water | 0.14 | 53.24 | 0.33 | 125.49 | 0.23 | 87.47 | 0.24 | 92.03 |
| Vegetation | 4.62 | 1756.92 | 2.58 | 981.14 | 2.33 | 886.07 | 2.44 | 928.73 |
| Built up | 0.31 | 117.89 | 1.17 | 444.93 | 4.81 | 1829.17 | 6.74 | 2190.15 |
| Others | 94.9 | 36089.11 | 95.92 | 36477.00 | 92.93 | 35339.95 | 91.58 | 34904.41 |
| Total Area in Hectares : 38028.57 | ||||||||
Table 8c: Kappa Statistics and Accuracy Assessment
| Year | Overall Accuracy | Kappa Value |
| 1989 | 94.85 | 0.87 |
| 2000 | 92.73 | 0.83 |
| 2006 | 93.64 | 0.92 |
| 2012 | 93.12 | 0.93 |