|
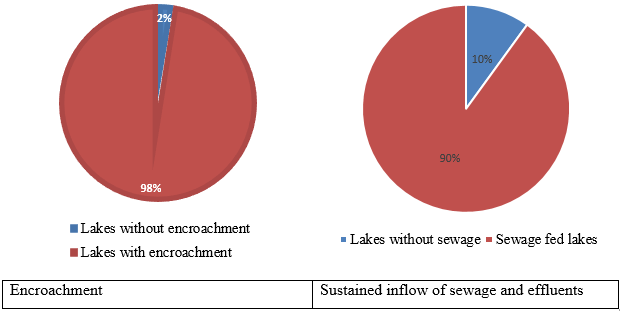
The current investigation focused on 105 lakes (water bodies) in Bangalore. Among these one season monitoring was done in 25 lakes as these lakes were covered with macrophytes – water hyacinth throughout the year. The study reveals that about 98% lakes have been encroached and about 90% lakes are affected due to the sustained inflow of untreated sewage and industrial effluents.
Physico-chemical characteristics of Bangalore lakes: The physical and chemical integrity of an ecosystem decides its biological integrity and ecosystem services. Physico-chemical characteristics of 80 lakes belonging to the 3 different valleys namely, Koramangala-Challaghatta Valley (KC), Vrishabavathi Valley (V) and Hebbal Valley (H) were monitored to understand the prevailing physic-chemical condition of lakes in Bangalore (figure 6.1). The physico-chemical parameters analysed were water temperature; pH; total dissolved solids; electrical conductivity; turbidity; dissolved oxygen; chemical oxygen demand; biochemical oxygen demand; total alkalinity; chloride; total hardness; calcium hardness; magnesium hardness; nitrate; orthophosphate; sodium and potassium.
The water quality analysis was carried out of the monthly water samples collected from lakes in Bangalore and the results are presented in figure 6.1, which revealed that lakes in Koramangala-Challaghatta Valley (KC) are the most polluted than the lakes in Vrishabavathi Valley (V) and Hebbal Valley (H). The result shows that KC valley receives lot of wastewater than the other two valleys. At inlets of KC Valley lakes, higher ionic and organic contents except phosphate were noticed. The physico-chemical parameters in inlets of different Valleys are in the order KC > V > H.
At middle part, KC valley has higher TDS, EC, pH, COD, chloride, hardness, nitrate, sodium and potassium. Alkalinity and DO are higher in Vrishabavathi Valley and support more phytoplankton growth. The physico-chemical parameters in middle part of different Valleys are in the order KC > H > V.
At outlets, KC valley has higher TDS, EC, COD, BOD, chloride, hardness and sodium. Alkalinity and DO are higher in Vrishabavathi Valley as the lakes support more algae growth. Hebbal Valley has higher pH, turbidity, orthophosphate, sodium and potassium. The physico-chemical parameters in outlet of different Valleys are in the order KC > H > V. Lakes in Hebbal valley have high phosphate content at the inlet, middle and outlet.
The inlet part of lakes has higher physico-chemical parameters than the middle and outlet part of lakes because of the sustained inflow of untreated sewage (Sincy et al., 2014). The continuous entry of sewage water and rainwater runoff to lakes also reduces the depth of the lake and ground water recharge capacity apart from contaminating ground water sources (Ramachandra et al., 2015b).
All parameters showed seasonal variations and the variations in water temperature are influenced by factors like air temperature, humidity, wind and solar energy (Sincy et al., 2012). The variation in TDS and EC is related to the concentration of calcium, magnesium, sodium, and potassium cations and carbonate, bicarbonate, chloride, sulfate, and nitrate anions in lake water (Ramachandra et al., 2015a, 2003). The increase in conductivity is due to the sustained inflow of untreated effluents (through both domestic and industrial sources) into lakes/wetlands (Alakananda et al., 2013). Higher pH values are attributed to higher photosynthetic rates of algae, using more dissolved CO2 from the waters and thereby, causing high bicarbonate and carbonate concentrations (alkalinity). High carbonates cause calcium and magnesium ions to form insoluble minerals leaving sodium as the dominant ion in solution (Mahapatra et al., 2013). Higher turbidity values in lakes are mainly due to silt, organic matter, sewage (domestic) and other effluents (Kiran and Ramachandra, 1999).
Hypoxic and even anoxic condition due to low dissolved oxygen content can be attributed to the sustained inflow of organic load, water hyacinth cover and decomposition of organic matter (Ramachandra et al., 2013). The roots of the floating macrophytes provide a good substratum for the attachment of bacteria, which drastically reduces the DO levels, resulting in hypoxia and anoxia (Mahapatra et al., 2011a). Fish death in lakes due to asphyxiation occurs due to the sudden fall in DO levels with sewage influx into lakes (Benjamin et al., 1996). Higher levels of BOD in the urban lakes can be attributed to sewage inflow through storm water drains and reduced circulation in water bodies. These also indicate higher levels of biodegradable organic matter, higher rate of oxygen consumption by heterotrophic organisms and a high rate of organic matter mineralization (Mahapatra et al., 2010). Higher values of COD indicate pollution due to oxidisable organic matter (Sincy et al., 2014). Lakes having continuous sewage inflow, low water levels and highly stressed by anthropogenic activities have high levels of COD.
Lakes with continuous inflow of sewage have high concentrations of total hardness, alkalinity and chlorides (Ramachandra et al., 2013). Elevated chloride values could be due to many factors, including sewage, industrial effluents, and agricultural runoff. Potassium is also an essential element for plant growth. Its elevated levels indicate potential contamination from industrial effluents or fertilizer (Ramachandra, 2008). The main cause of hardness in natural water is due to calcium and magnesium salts combined with carbonates and bicarbonates. The main source of hardness is domestic and industrial washing flowing into the lake (Ramachandra et al., 2001)
Phosphate occurs in water in various forms like orthophosphates, condensed phosphates and naturally found phosphate. The increased phosphate in lake water is due to detergents, fertilizers and due to biological processes. Inorganic phosphorus is a limiting nutrient and plays an important role in aquatic ecosystems. Inorganic phosphorus in excess amounts along with nitrates and potassium causes algal bloom (Balachandran et al., 2012). When lakes receive nutrients, a substantial part is taken up by biota, leading to algal and macrophytes bloom. Macrophytes ultimately die, decompose and settles as sludge sediment in the lake bottom and with high turbulence and overflow of water during monsoon they are likely to be transported to downstream. Thus, sludge/sediments act as a major sink for C, N and P (Mahapatra et al., 2011c). Nutrients trapped in sediments gets released during monsoon with high intensity of rainfall with upwelling of sediments and churning of lake water. Phosphates leads to frothing, which are observed at the outlets of large water bodies. Nitrate at higher concentrations primarily contribute to the eutrophication of water bodies. Anoxic conditions do not favour ammonia (NH4) to be nitrified to a large extent. Low DO (0 mg/l) favours denitrification process (Mahapatra et al., 2011b).
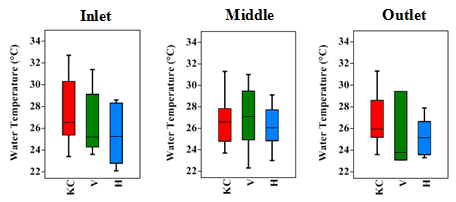
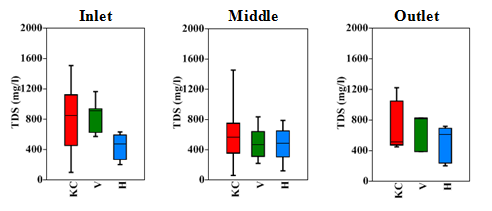
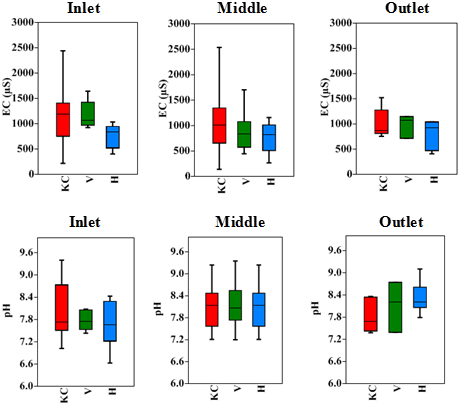
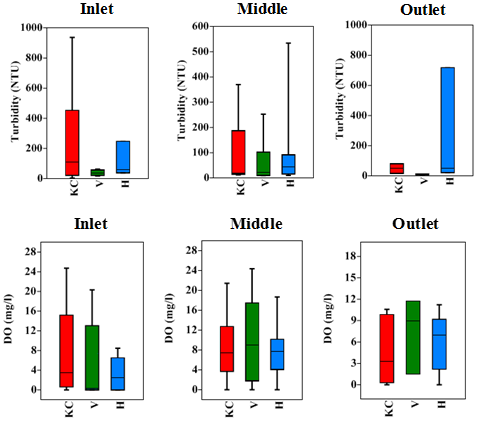

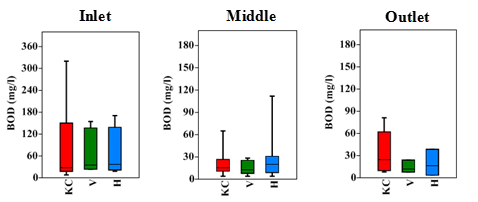
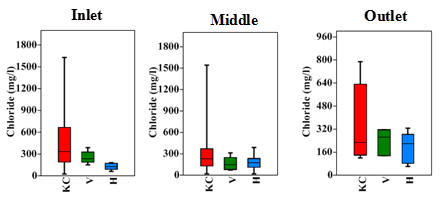
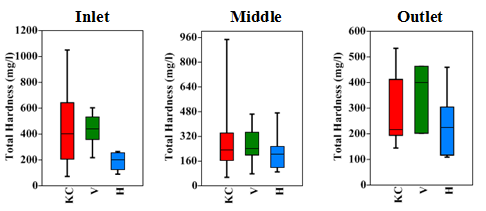
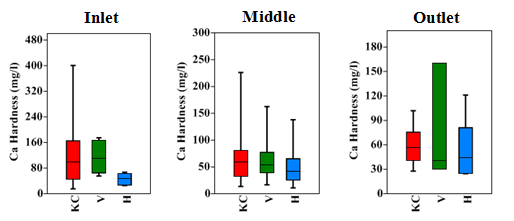
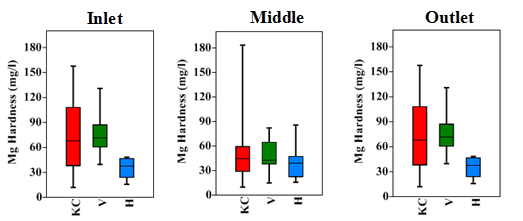
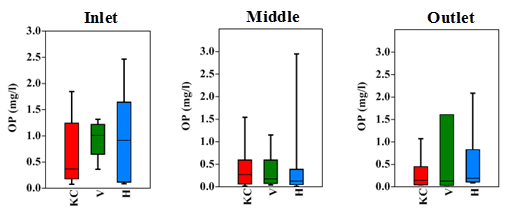
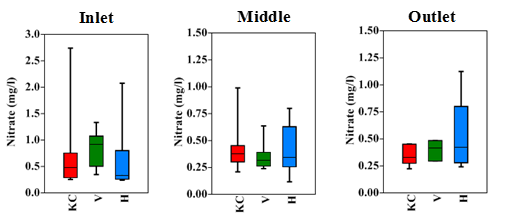
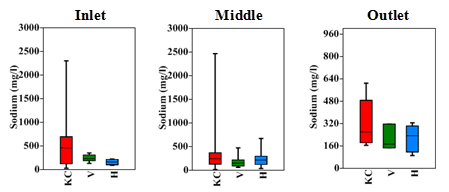
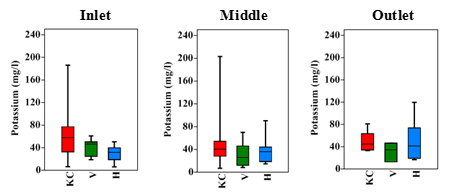
Figure 6.1: Variation of physico-chemical parameters in lakes belonging to Koramangala-Challaghatta Valley (KC), Vrishabavathi Valley (V) and Hebbal Valley (H) in Bangalore
Cluster Analysis: The Cluster Analysis of physical and chemical variables in the water of 80 lakes in Bangalore revealed the existence of three groups (figure 6.2 and 6.3).
- Group-a, 24 lakes, which are less polluted lakes that have low ionic as well as nutrient contents: Sompura, Bellahalli, Doraikere, Mylasandra 1, Hesaraghatta, Vittasandra, Mylasandra 2, Munnekolala, Palanahalli, Narsipura 1, Ulsoor, Uttarahalli, Rachenahalli, Agara, Rayasandra, Narasipura 2, Yelahanka, Deepanjali Nagara kere, Bagmane, Kengeri, Hebbal, Nagavara, Kogilu and Mathikere..
- Group-b, 22 lakes, which are moderately polluted lakes that have low ionic as well as nutrient contents compared to Group c but supports algal and macrophyte growth: Chikkabanavara, Yeklgata, Hemmigepura, Komghatta, Baallehannu, Andrahalli, Chikka Togur, Subbarayanna, Kelagiankare, Thirumenahalli 2, Jakkur, Kaikondrahalli, Kasavanahalli, Madivala, Kothanur, Yediyur, Lalbagh, Sankey, Kattigenahalli, Dasarahalli, Chokkanahalli and Thirumenahalli 1.
- Group-c, 34 lakes, which includes highly polluted lakes that have high ionic contents, rich in nutrients and have high oxygen demand due to high organic contents. These lakes are highly stressed due to anthropogenic activities - Kammasandra1, Hebbagodi, Bommasndra, Kammasandra 2, Ambalipura, Singasandra, Bhattrahalli, Begur, Konanakunte, Doddanekundi, Nallurahalli, Chinnappanahalli, KR Puram, Ullal, Anchepalya, Sheelavanthakere, Chunchugatta, Hulimavu, Herohalli, Kundalahalli, Chikka Begur, Dubasipalya, Chikkabettahalli, Allalasandra, Yelemallappashetty, Bellandur, Varthur, Maragondanahalli, Arekere, Mahadevapura, Chelekere, Mallathhalli, Kalkere and Rampura.
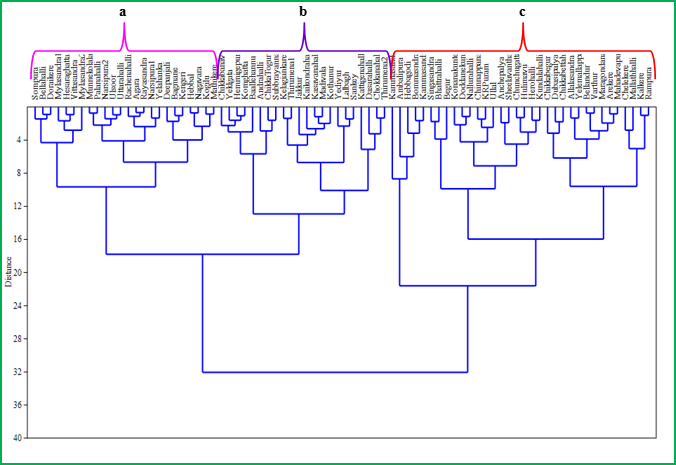
Figure 6.2: Hierarchical clustering analysis (Wards method) of 80 lakes in Bangalore based on physico-chemical parameters (like water temperature, pH, TDS, EC, DO, COD, total alkalinity, chlorides, total hardness, calcium hardness, magnesium hardness, nitrate and ortho-phosphate).
![]](s17.png)
Figure 6.3: Distribution of lakes based on hierarchical clustering analysis (Wards method) - less polluted (LP), moderately polluted (MP), highly polluted (HP) lakes
Principal Component Analysis: Principal component analysis (PCA) was performed to investigate the factors that caused variations in the observed water quality variables across various lakes in Bangalore district. PCA provides information on the most meaningful parameters, which will describe the whole data set, and help in data reduction with minimum loss of original information.
Based on the eigenvalues scree plot (figure 6.3), about 13 physicochemical parameters were reduced to 10 main factors (factors 1 to 10) from the leveling off point(s) in the scree plot. The remaining 3 factors have eigenvalues of less than unity. The table 6.1 shows the corresponding eigenvalues and total variance for each factor extracted. Any factor with an eigenvalue greater than 1 is considered significant. The first factor corresponding to the largest eigenvalue (5.22) accounts for approximately 40.19% of the total variance. The second factor corresponding to the second eigenvalue (2.10) accounts for approximately 16.16% of the total variance.
Table 6.1: Eigenvalues and total variance of water quality parameters on significant principal components
PC |
Eigenvalue |
% variance |
1 |
5.22 |
40.19 |
2 |
2.10 |
16.16 |
3 |
1.61 |
12.39 |
4 |
1.02 |
7.83 |
5 |
0.85 |
6.50 |
6 |
0.70 |
5.39 |
7 |
0.51 |
3.90 |
8 |
0.38 |
2.92 |
9 |
0.35 |
2.69 |
10 |
0.15 |
1.19 |
11 |
0.086 |
0.66 |
12 |
0.02 |
0.18 |
13 |
0.001 |
0.01 |
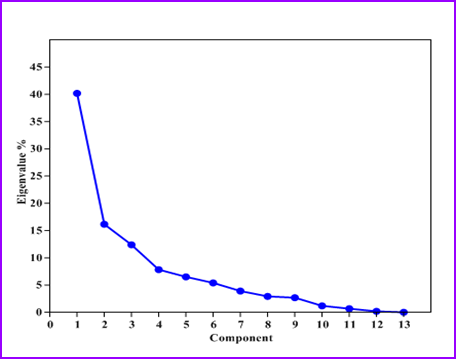
Figure 6.3: Scree plot of the eigenvalues of principal components
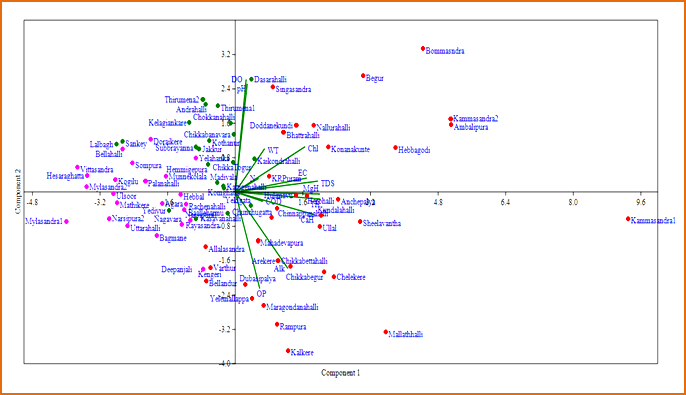
Figure 6.4: Principal component analysis for physico-chemical parameters of lakes in Bangalore
Principal component analysis for physico-chemical parameters of lakes in Bangalore (figure 6.4), revealed that
- Kammasandra 1 and Begur have higher TDS, EC, pH, COD, Total alkalinity, Total hardness, Calcium and Magnesium hardness and Nitrate.
- Yelemallappashetty, Rampura, Kalkere, Maragondanahalli, Mallathhalli, Chikka Togur, Chikka Begur, Allalasandra and Chelekere are highly influenced by orthophosphate as these lakes receive large amount of sewage water.
- Yelemallappashetty, Kammasandra 1, Ullal, Chelekere and Baallehannu are highly influenced by alkalinity. Kammasandra 1, Kattigenahalli and Chokkanahalli have higher Nitrate concentrations. Kammasandra 1, Kammasandra 2, Ambalipura, Hebbagodi, Bommasndra, Begur, Sheelavanthakere, Chikkabettahalli, Chikka Begur, Chikka Togur, Mallathhalli, Anchepalya, Herohalli and Ullal are affected by high levels of Hardness (TH, CaH and MgH).
- The lakes such as Kammasandra 1, Kammasandra 2, Begur, Hebbagodi, Ambalipura, Anchepalya and Bommasndra are highly influenced by chloride content.
- Andrahalli, Bommasndra, Singasandra, Thirumenahalli 1, Doddanekundi, Nallurahalli, Singasandra and Jakkur have high DO.
- Chikkabanavara, Dasarahalli, Chokkanahalli, Kelagiankare, Lalbagh, Sankey, Nallurahalli, Kothanur, Konanakunte, Thirumenahalli 1, Thirumenahalli 2 and Begur are highly affected by pH.
- Yelemallappashetty, Mallathhalli, Bellandur, Chikka Begur, Dubasipalya, Deepanjali Nagara kere, Kengeri, Kalkere, Arekere, Varthur, Maragondanahalli, Rampura and Bagmane are negatively correlated with DO.
The variation in water temperature had affected various parameters like pH, alkalinity, dissolved oxygen, electrical conductivity etc. and also various chemical and biological reactions such as solubility of oxygen, carbon dioxide, carbonate – bicarbonate equilibrium, and the metabolic rate.
In case of Hebbal Valley, 72% of lakes belong to class E and 28% belongs to class D and E. About 87% of lakes in Koramangala-Challaghatta Valley belongs to class E, 8% class D and E and 5% belongs to class A. In case of Vrishabavathi Valley, 69% of lakes belong to class E and 31% belongs to class D and E. When we consider all the sampled lakes in Bangalore, about 79% of lakes belongs to class E, 19% class D and E and 2% belongs to class A (figure 6.5, table 6.2).
Table 6.2: The water quality results based on Classification of Inland Surface Water (CPCB)
Sl.No |
Name of the Lake |
The valley to which lake belongs |
Class |
1 |
Agara Lake |
Koramangala-Challaghatta Valley |
E |
2 |
Ambalipura Lake |
Koramangala-Challaghatta Valley |
E |
3 |
Arekere Lake |
Koramangala-Challaghatta Valley |
E |
4 |
Bagmane Lake |
Koramangala-Challaghatta Valley |
E |
5 |
Bhattrahalli Lake |
Koramangala-Challaghatta Valley |
E |
6 |
Begur Lake |
Koramangala-Challaghatta Valley |
E |
7 |
Bellandur Lake |
Koramangala-Challaghatta Valley |
E |
8 |
Bommasndra Lake |
Koramangala-Challaghatta Valley |
E |
9 |
Chikkabegur Lake |
Koramangala-Challaghatta Valley |
E |
10 |
Chikka Togur Lake |
Koramangala-Challaghatta Valley |
E |
11 |
Chinnappanahalli Lake |
Koramangala-Challaghatta Valley |
E |
12 |
Chunchugatta Lake |
Koramangala-Challaghatta Valley |
E |
13 |
Doddanekundi Lake |
Koramangala-Challaghatta Valley |
E |
14 |
Hebbagodi Lake |
Koramangala-Challaghatta Valley |
E |
15 |
Hulimavu Lake |
Koramangala-Challaghatta Valley |
E |
16 |
Kaikondrahalli Lake |
Koramangala-Challaghatta Valley |
D and E |
17 |
Kammasandra Lake 1 |
Koramangala-Challaghatta Valley |
E |
18 |
Kammasandra Lake 2 |
Koramangala-Challaghatta Valley |
E |
19 |
Kasavanahalli Lake |
Koramangala-Challaghatta Valley |
E |
20 |
Kelagiankare Lake |
Koramangala-Challaghatta Valley |
E |
21 |
Kothanur Lake |
Koramangala-Challaghatta Valley |
E |
22 |
K R Puram Lake |
Koramangala-Challaghatta Valley |
E |
23 |
Kundalahalli Lake |
Koramangala-Challaghatta Valley |
E |
24 |
Lalbagh Lake |
Koramangala-Challaghatta Valley |
D and E |
25 |
Madivala Lake |
Koramangala-Challaghatta Valley |
E |
26 |
Mahadevapura Lake |
Koramangala-Challaghatta Valley |
E |
27 |
Munnekolala Lake |
Koramangala-Challaghatta Valley |
E |
28 |
Mylasandra Lake 1 |
Koramangala-Challaghatta Valley |
A |
29 |
Mylasandra Lake 2 |
Koramangala-Challaghatta Valley |
A |
30 |
Nallurahalli Lake |
Koramangala-Challaghatta Valley |
E |
31 |
Rayasandra Lake |
Koramangala-Challaghatta Valley |
E |
32 |
Sheelavanthakere Lake |
Koramangala-Challaghatta Valley |
E |
33 |
Singasandra Lake |
Koramangala-Challaghatta Valley |
E |
34 |
Subbrayanna Lake |
Koramangala-Challaghatta Valley |
E |
35 |
Ulsoor Lake |
Koramangala-Challaghatta Valley |
E |
36 |
Varthur Lake |
Koramangala-Challaghatta Valley |
E |
37 |
Vittasandra Lake |
Koramangala-Challaghatta Valley |
E |
38 |
Yediyur Lake |
Koramangala-Challaghatta Valley |
D and E |
39 |
Yeklgata Lake |
Koramangala-Challaghatta Valley |
E |
40 |
Anchepalya Lake |
Vrishabavathi Valley |
E |
41 |
Andrahalli Lake |
Vrishabavathi Valley |
D and E |
42 |
Baallehannu Lake |
Vrishabavathi Valley |
D and E |
43 |
Dasarahalli Lake |
Vrishabavathi Valley |
E |
44 |
Deepanjali Nagara Lake |
Vrishabavathi Valley |
E |
45 |
Doraikere Lake |
Vrishabavathi Valley |
D and E |
46 |
Dubasipalya Lake |
Vrishabavathi Valley |
E |
47 |
Hemmigepura Lake |
Vrishabavathi Valley |
D and E |
48 |
Herohalli Lake |
Vrishabavathi Valley |
D and E |
49 |
Kengeri Lake |
Vrishabavathi Valley |
E |
50 |
Komghatta Lake |
Vrishabavathi Valley |
E |
51 |
Konanakunte Lake |
Vrishabavathi Valley |
E |
52 |
Mallathhalli Lake |
Vrishabavathi Valley |
E |
53 |
Sompura Lake |
Vrishabavathi Valley |
E |
54 |
Ullal Lake |
Vrishabavathi Valley |
E |
55 |
Uttarahalli Lake |
Vrishabavathi Valley |
E |
56 |
Allalasandra Lake |
Hebbal Valley |
E |
57 |
Bellahalli Lake |
Hebbal Valley |
E |
58 |
Chelekere Lake |
Hebbal Valley |
E |
59 |
Chikkabettahalli Lake |
Hebbal Valley |
E |
60 |
Chikkabanavara Lake |
Hebbal Valley |
E |
61 |
Chokkanahalli Lake |
Hebbal Valley |
E |
62 |
Hebbal Lake |
Hebbal Valley |
D and E |
63 |
Hesaraghatta Lake |
Hebbal Valley |
D and E |
64 |
Jakkur Lake |
Hebbal Valley |
D and E |
65 |
Kalkere Lake |
Hebbal Valley |
E |
66 |
Kattigenahalli Lake |
Hebbal Valley |
E |
67 |
Kogilu Kere |
Hebbal Valley |
D and E |
68 |
Maragondanahalli Lake |
Hebbal Valley |
E |
69 |
Mathikere Lake |
Hebbal Valley |
E |
70 |
Nagavara Lake |
Hebbal Valley |
D and E |
71 |
Narsipura Lake 1 |
Hebbal Valley |
D and E |
72 |
Narsipura Lake 2 |
Hebbal Valley |
E |
73 |
Palanahalli Lake |
Hebbal Valley |
E |
74 |
Rachenahalli Lake |
Hebbal Valley |
D and E |
75 |
Rampura Lake |
Hebbal Valley |
E |
76 |
Sankey Lake |
Hebbal Valley |
E |
77 |
Thirumenahalli Lake 1 |
Hebbal Valley |
E |
78 |
Thirumenahalli Lake 2 |
Hebbal Valley |
E |
79 |
Yelahanka Lake |
Hebbal Valley |
E |
80 |
Yelemallappashetty Lake |
Hebbal Valley |
E |
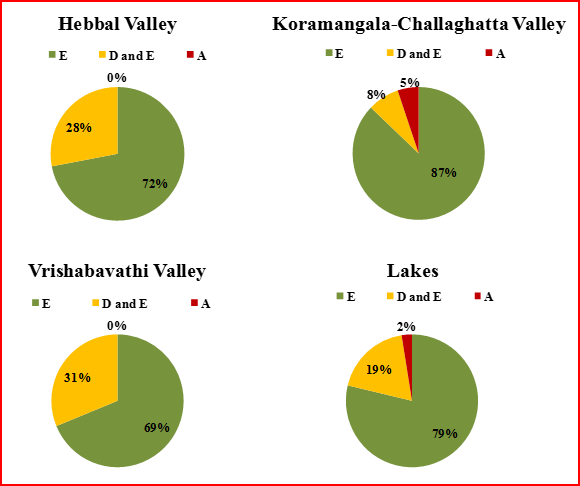
Figure 6.5: The class-wise distribution of the lakes in Bangalore belonging to 3 different valleys
CONCLUSION
An exploratory survey of 105 lakes in Bangalore revealed that about 25 lakes were found to be in a very bad state (either lakes had little/no water). The physico-chemical characteristics of 80 lakes were assessed to understand the prevailing condition of lakes in Bangalore.
- The water quality results revealed that lakes such as Andrahalli, Baallehannu, Doraikere, Hebbal, Hemmigepura, Herohalli, Hesaraghatta, Jakkur, Kaikondrahalli, Kogilu, Lalbagh, Nagavara, Narsipura 1, Rachenahalli and Yediyur falls under Class D and E, whereas all the other 63 lakes belonged to under Class E based on the Classification of Inland Surface Water (CPCB).
- Lakes in Koramangala-Challaghatta Valley (KC) are the most polluted than the lakes in Vrishabavathi Valley (V) and Hebbal Valley (H).
- About 79% of lakes monitored in Bangalore belongs to class E, 19% to class D and E and 2% belongs to class A.
- Lakes like Bellandur, Chelekere, Chikkabegur, Chunchugatta, Hebbagodi, Kalkere, Kammasandra lake 1, Kengeri, Mallathhalli, Maragondanahalli, Nallurahalli, Rampura, Varthur and Yelemallappachetty receives enormous amount of untreated sewage water.
- Cluster Analysis of physical and chemical variables in the water of 80 lakes in Bangalore revealed the existence of three groups namely less polluted, moderately polluted and highly polluted lakes.
- All monitored parameters showed diurnal as well as seasonal variations in the present study.
- Principal component analysis for physico-chemical parameters of lakes revealed that Kammasandra 1, Kammasandra 2, Ambalipura and Begur have higher TDS, EC, pH, COD, Total alkalinity, Total hardness, Calcium and Magnesium hardness.
- An enormous amount of wastewater is generated in Bangalore daily. The treatment capacities of STPs in Bangalore are far lower than generation. Only treated sewage to be let into lakes.
- Lakes that had profuse growth of Algae i.e., Cyanophyceae (due to continuous sewage inflow and high nutrients) are Sankey, Dasarahalli, Bagmane, Ulsoor, Anchepalya, Bommasndra, Kammasandra 1and 2.
- Fish death was seen in Sankey, Lalbagh, Jakkur and Munnekolala.
- In the case of Zooplanktons, Rotifera and Protozoa were present in high numbers in polluted/nutrient rich lake.
- In the case of Macrophytes, Eichhornia sp., Typha sp. and Alternanthera sp. were the most dominant species found. These macrophytes sometimes cover the entire lake surface resulting in anoxic conditions.
- Foam formation was seen in lakes such as Bellandur, Maragondanahalli, Rampura, Sarakki and Varthur.
- Recently, fire was reported in Bellandur lake.
- Lakes like Bellandur, Bommasndra, Dasarahalli, Deepanjali Nagara, Doddabidirakallu, Kammasandra, Kempambudhi, Mahadevapura, Nalagadderanahalli, Nayandanahalli, Shivapura, Varthur are near to industries.
- STPs are present in lakes like Kempambudhi, Marathahalli, Madivala, Dasarahalli, Lalbagh, Jakkur, Andrahalli, Allalsandra, Hebbal, Herohalli and Doraikere.
- About 25 lakes were found to be places for solid and liquid wastes dumping and fully macrophyte covered due to the excessive amount of nutrients present in those lakes.
- Lake such as Lakasandra had completely turned to a barren land due to the dumping of building debris.
- Immediate action should be taken for the lakes that are in worst conditions.
REFERENCES
- Alakananda, B., Mahesh, M. K., and Ramachandra, T. V., 2013, Biomonitoring to assess the efficacy of restoration and management of urban water bodies. International Journal of Environmental Sciences, Vol. 2(3), pp. 165-178.
- Altaff, K., A manual of Zooplankton. University Grants Commission, New Delhi. 2004.
- APHA, Standard Methods (20 Ed.) for the examination of water and waste water, APHA, AWWA, WPCE, Washington DC, 1998.
- Asulabha, K. S., Sincy, V., and Ramachandra, T. V., 2014, Aquatic biodiversity of Greater Bangalore wetlands. Proceedings of the Lake 2014: Conference on Conservation and Sustainable Management of Wetland Ecosystems in Western Ghats.
- Balachandran C., Dinakaran S., Alkananda B., Boominathan M. and Ramachandra. T.V, 2013. Monitoring aquatic macroinvertebrates as indicators for assessing the health of Lakes in Bangalore, Karnataka. International Journal of Advanced Life Sciences (IJALS), Vol. 5(1), pp. 19-33.
- Benjamin, R., Chakrapani, B. K., Devashish, K., Nagaratna, A. V., and Ramachandra, T. V., 1996, Fish mortality in Bangalore lakes. India. Electronic Green Journal, Vol. 1(6).
- Bhat, S. P., and Ramachandra, T. V., 2014, Macrophyte diversity in relation to water quality of Bangalore lakes. Lake 2014: Conference on Conservation and Sustainable Management of Wetland Ecosystems in Western Ghats.
- Desikachary, T.V., Cyanophyta. Indian Council of Agricultural Research, New Delhi, 1959.
- Kiran R., and Ramachandra T.V., 1999, Status of wetlands in Bangalore and its conservation aspects. ENVIS Journal of Human Settlements, pp. 16-24.
- Mahapatra, D. M., Chanakya H. N., and Ramachandra, T. V., 2013, Treatment efficacy of algae-based sewage treatment plants. Environmental Monitoring and Assessment, Vol. 185, pp. 1-20.
- Mahapatra, D. M., Chanakya, H. N., and Ramachandra, T. V., 2012, Sustainable algal scum management and wastewater treatment in Bangalore. Lake 2012: National Conference on Conservation and Management of Wetland Ecosystems.
- Mahapatra, D. M., Chanakya H. N., and Ramachandra, T. V., 2011a, Role of macrophytes in a sewage fed urban lake. Institute of Integrative Omics and Applied Biotechnology Journal (IIOABJ), Vol. 2, Issue 8, pp. 1-9
- Mahapatra, D. M., Chanakya, H. N., and Ramachandra, T. V., 2011b, Assessment of treatment capabilities of Varthur Lake, Bangalore, India. International Journal of Environmental Technology and Management, Vol. 14, pp. 84-102.
- Mahapatra, D. M., Chanakya, H. N., and Ramachandra, T. V., 2011c, C:N ratio of sediments in a sewage fed urban lake. International Journal of Geology, Vol. 5(3), pp. 86-92.
- Prescott, G. W., How to Know the Fresh-Water Algae. Published by W.M.G Brown Company, Dubuque, Iowa, 1954.
- Mahapatra, D. M., Supriya, G., Chanakya, H. N., and Ramachandra, T. V., 2010, Algal photosynthetic dynamics in urban lakes under stress conditions. Proceedings of the Conference on Infrastructure, Sustainable Transportation and Urban Planning CiSTUP@CiSTUP 2010. 18th - 20th October 2010, CiSTUP, IISc, Bangalore
- Ramachandra, T. V., Conservation and management of urban wetlands: Strategies and challenges, ENVIS Technical Report: 32, Environmental Information System, Centre for Ecological Sciences, Bangalore, 2009.
- Ramachandra, T. V., Conservation, restoration and management of aquatic ecosystems, In Aquatic Ecosystems - Conservation, Restoration and Management, Ramachandra, Ahalya N. and Rajasekara Murthy (ed.), Capital Publishing Company, New Delhi, 2005.
- Ramachandra T V, 2009. Essentials in urban lake monitoring and management, CiSTUP Technical report 1, Urban Ecology, Environment and Policy Research, Centre for Infrastructure, Sustainable Transportation and Urban Planning, IISc, Bangalore.
- Ramachandra, T.V., 2010, Wetlands: Need for appropriate strategies for conservation and sustainable management. Journal of Basic and Applied Biology, Vol. 4(3), pp. 1-17.
- Ramachandra, T. V., 2012, Conservation and Management of Wetlands: Requisite Strategies. LAKE 2012: National Conference on Conservation and Management of Wetland Ecosystems.
- Ramachandra T V, 2009. Essentials in urban lake monitoring and management, CiSTUP Technical report 1, Urban Ecology, Environment and Policy Research, Centre for Infrastructure, Sustainable Transportation and Urban Planning, IISc, Bangalore.
- Ramachandra, T. V., 2008. Spatial analysis and characterisation of lentic ecosystems: A case study of Varthur lake, Bangalore. International Journal of Ecology & Development, Vol. 9(1), pp. 39-56.
- Ramachandra, T. V., and Ahalya, N., Essentials of Limnology and Geographical Information System (GIS). Energy and Wetlands Research Group, Center for Ecological Sciences, Indian Institute of Science, Bangalore, 2001.
- Ramachandra, T. V., and Solanki, M., Ecological assessment of lentic water bodies of Bangalore. Technical Report 25, CES, Bangalore, 2007.
- Ramachandra, T. V., Ahalya N., and Payne, M., Status of Varthur Lake: opportunities for restoration and sustainable management. Technical report 102, Centre for Ecological Sciences, Indian Institute of Science, Bangalore, 2003.
- Ramachandra, T. V., Aithal, B. H., and Durgappa, D. S., 2012, Insights to urban dynamics through landscape spatial pattern analysis. International Journal of Applied Earth Observation and Geoinformation, Vol.18, pp. 329-343.
- Ramachandra, T. V., Aithal, B. H., and Kumar, U., 2012, Conservation of wetlands to mitigate urban floods. Resources, Energy, and Development. Vol. 9(1), pp. 1-22.
- Ramachandra, T. V., Aithal, B. H., Vinay, S., Setturu, B., Asulabha, K. S., Sincy, V., and Bhat, S. P., Vanishing lakes interconnectivity and violations in valley zone: Lack of co-ordination among para-state agencies, ENVIS Technical Report 85, CES, Indian Institute of Science, Bangalore, 2015c.
- Ramachandra, T. V., Aithal, B. H., Vinay, S., and Lone, A. A., Conservation of Bellandur wetlands: Obligation of decision makers to ensure intergenerational equity. ENVIS Technical Report: 55, Environmental Information System, Centre for Ecological Sciences, Bangalore, 2013.
- Ramachandra, T. V., Alakananda, B., Ali Rani and Khan, M. A., 2011, Ecological and socio-economic assessment of Varthur wetland, Bengaluru (India). Journal of Environmental Science and Engineering, Vol. 53(1), pp. 101-108.
- Ramachandra, T. V., and Ahalya, N., Essentials of Limnology and Geographical Information System (GIS). Energy and Wetlands Research Group, Center for Ecological Sciences, Indian Institute of Science, Bangalore, 2001.
- Ramachandra,T. V., Asulabha, K. S., Aithal, B. H., Settur, B., Mahapatra, D. M., Kulkarni, G., Bhat, H., R., Sincy V., Bhat, S. P., Vinay, S., Environment monitoring in the neighbourhood, ENVIS Technical Report 77, Environmental Information System, CES, Indian Institute of Science, Bangalore, 2014a.
- Ramachandra, T. V., Asulabha, K. S., Sincy, V., and Bhat, S. P., Agony of Chikkabettahalli lake, Vidyaranyapura, Bruhat Bangalore. ENVIS Technical Report 83, Environmental Information System, CES, Indian Institute of Science, Bangalore, 2014b.
- Ramachandra, T. V., Asulabha, K. S., Sincy, V., Vinay, S., Bhat, S. P., and Aithal, B. H., Sankey Lake: Waiting for an immediate sensible action. ENVIS Technical Report 74, Environmental Information System, CES, Indian Institute of Science, Bangalore, 2015a.
- Ramachandra, T. V., Asulabha, K. S., Sincy, V., Vinay, S., Aithal, B. H., Bhat, S. P., and Mahapatra, D. M., Pathetic status of wetlands in Bangalore: Epitome of inefficient and uncoordinated Governance. ENVIS Technical Report 93, CES, Indian Institute of Science, Bangalore, 2015b.
- Ramachandra T.V., Kiran R., Ahalya N., and Deepa R.S., Status of wetlands in Bangalore. CES Technical Report 86, Centre for Ecological Sciences, Indian Institute of Science, Bangalore, 2001.
- Ramachandra, T. V., and Kumar, U., 2008, Wetlands of Greater Bangalore, India: Automatic delineation through pattern classifiers, The Greendisk Environmental Journal. Issue 26 (http://egj.lib.uidaho.edu/index.php/egj/article/view/3171).
- Ramachandra, T. V., Mahapatra, D. M., Bhat, S. P., Asulabha, K. S., Sincy, V., and Aithal, B. H., Integrated wetlands ecosystem: Sustainable model to mitigate water crisis in Bangalore. ENVIS Technical Report 76, Environmental Information System, CES, Indian Institute of Science, Bangalore, 2014.
- Ramachandra, T. V, Meera, D. S., and Alakananda, B., 2013, Influence of catchment land cover dynamics on the physical, chemical and biological integrity of wetlands. Environment and We -International Journal of Science and Technology - (EWIJST), Vol. 8(1), pp. 37-54.
- Ramachandra, T. V., Rishiram, R., and Karthick, B., Zooplankton as bioindicators: Hydro-biological investigatios in selected Bangalore lakes. Technical Report: 115, Environmental Information System, Centre for Ecological Sciences, Bangalore, June 2006.
- Rau, L., 1988, Report of the expert committee for preservation, restoration or otherwise of the existing tanks in Bangalore metropolitan area.
- Sincy, V., Asulabha, K. S., and Ramachandra, T. V., 2014, Inventorying and monitoring of wetlands in Greater Bangalore. Lake 2014: Conference on Conservation and Sustainable Management of Wetland Ecosystems in Western Ghats.
- Sincy, V., Mahapatra, D. M., and Ramachandra, T. V., 2012, Nutrient removal of secondary treated water through algal ponds. Lake 2012: National Conference on Conservation and Management of Wetland Ecosystems.
- Sudhira, H.S, Ramachandra, T.V, Bala Subramanya, M.H., 2007, City Profile: Bangalore. Cities, Vol. l24 (5), 379-390.
- Thippaiah, P., Vanishing lakes: A study of Bangalore city. Published by Social and Economic Change Monograph Series, The Institute for Social and Economic Change, Bangalore, 2009.
- Trivedi, R. K., and Goel, P. K., Chemical and biological methods for water pollution studies. Published by Environmental Publications, Post Box 60, Karad, 1986.
- http://www.iddkarnataka.gov.in/docs/23.Prefea_lake_cons.pdf
- http://www.ecy.wa.gov/programs/sea/wetlands/functions.html
- http://water.epa.gov/type/wetlands/outreach/upload/fun_val_pr.pdf
- http://www.newagepublishers.com/samplechapter/001754.pdf
- http://edugreen.teri.res.in/explore/water/health.htm
- http://www.bpac.in/wp-content/uploads/2014/08/Death-of-lakes-and-the-future-of-bangalore.pdf
- http://bangalore.citizenmatters.in/articles/print/5029-bwssb-hoodwinking-bengaluru-on-water-crisis-says-former-bureaucrat
- http://archive.deccanherald.com/deccanherald/oct192005/city20104420051018.asp
- http://wgbis.ces.iisc.ac.in/energy/
- http://wgbis.ces.iisc.ac.in/energy/water/paper/researchpaper2.html
- http://wgbis.ces.iisc.ac.in/energy/water/paper/researchpaper2.html#br
- http://wgbis.ces.iisc.ac.in/energy/water/paper/researchpaper2.html#us
- https://www.researchgate.net/profile/T_V_Ramachandra/publications
|
T.V. Ramachandra
Centre for Sustainable Technologies, Centre for infrastructure, Sustainable Transportation and Urban Planning (CiSTUP), Energy & Wetlands Research Group, Centre for Ecological Sciences, Indian Institute of Science, Bangalore – 560 012, INDIA.
E-mail : cestvr@ces.iisc.ac.in
Tel: 91-080-22933099/23600985,
Fax: 91-080-23601428/23600085
Web: http://ces.iisc.ac.in/energy
Asulabha K. S.
Energy & Wetlands Research Group, Centre for Ecological Sciences, Indian Institute of Science, Bangalore – 560 012, INDIA.
E-mail: asulabha@ces.iisc.ac.in
Sincy V.
Energy & Wetlands Research Group, Centre for Ecological Sciences, Indian Institute of Science, Bangalore – 560 012, INDIA.
E-mail: sincy@ces.iisc.ac.in
Sudarshan P Bhat
Energy & Wetlands Research Group, Centre for Ecological Sciences, Indian Institute of Science, Bangalore – 560 012, INDIA.
E-mail: sudarshan@ces.iisc.ac.in
Bharath H. Aithal
Energy & Wetlands Research Group, Centre for Ecological Sciences, Indian Institute of Science, Bangalore – 560 012, INDIA.
E-mail: bharath@ces.iisc.ac.in
Citation: Ramachandra T V, Asulabha K S, Sincy V, Sudarshan Bhat and Bharath H.Aithal, 2015. Wetlands: Treasure of Bangalore, ENVIS Technical Report 101, Energy & Wetlands Research Group, CES, IISc, Bangalore, India.
|