|
Status |
Disappearing water-bodies and vegetation |
Cause: |
Unplanned urbanisation |
|
|
Recommendation |
“Decongest and decontaminate Bangalore” so that at least next generation enjoys better environment in Bangalore
Need to ensure the ecosystem integrity to sustain goods and services for maintaining inter-generation equity.
Carrying capacity studies for all macro cities: Unplanned concentrated urbanisation in many cities has telling impacts on local ecology and biodiversity, evident from decline of water bodies, vegetation, enhanced pollution levels (land, water and air), traffic bottlenecks, lack of appropriate infrastructure, etc. There is a need to adopt holistic approaches in regional planning considering all components (ecology, economic, social aspects). In this regard, we recommend carrying capacity studies before implementing any major projects in rapidly urbanizing macro cities such as Greater Bangalore, etc. |
Action Plan |
- Good governance (too many para-state agencies and lack of co-ordination) - Single agency with the statutory and financial autonomy to be the custodian of natural resources (ownership, regular maintenance and action against polluters (encroachers as well as those let untreated sewage and effluents, dumping of solid wastes).
- De-congest Bangalore: Growth in Bangalore has surpassed the threshold evident from stress on supportive capacity (insufficient water, clean air and water, electricity, traffic bottlenecks, etc.) and assimilative capacity (polluted water and sediments in water bodies, enhanced GHG – Greenhouse gases, etc.)
- Disband BDA – creation of Bangalore Development Agency has given impetus to inefficient governance evident from Bangalore, the garden city turning into ‘dead city’ during the functional life of BDA.
- Digitation of land records (especially common lands – lakes, open spaces, parks, etc.) and availability of this geo-referenced data with query option (Spatial Decision Support System) to public.
- Threshold on high raise building in the region. Need to protect valley zones considering ecological function and these regions are ‘NO DEVELOPMENT ZONES’ as per CDP 2005, 2015
- Evict all encroachments from lake bed and raja kaluves
- Reestablish interconnectivity among lakes
- Restoration of lakes
|
3.1 Bangalore to Bengaluru (transition from green landscape to brown landscape)
Bangalore (77°37’19.54’’ E and 12°59’09.76’’ N), is the principal administrative, cultural, commercial, industrial, and knowledge capital of the state of Karnataka. With an area of 741 sq. km., Bangalore's city administrative jurisdiction was widened in 2006 (Greater Bangalore) by merging the existing area of Bangalore city spatial limits with 8 neighbouring Urban Local Bodies (ULBs), and 111 Villages of Bangalore Urban District (Ramachandra and Kumar, 2008; Ramachandra et al., 2012). Thus, Bangalore has grown spatially more than ten times since 1949 (69 square kilometres) and is a part of both the Bangalore urban and rural districts (figure 3.1). The mean annual total rainfall is about 880 mm with about 60 rainy days a year over the last ten years. The summer temperature ranges from 18° C – 38° C, while the winter temperature ranges from 12° C – 25° C. Bangalore is located at an altitude of 920 meters above mean sea level, delineating three watersheds, viz. Hebbal, Koramangala-Challaghatta and Vrishabhavathi watersheds (Figure 3.2). The undulating terrain in the region has facilitated creation of a large number of tanks providing for the traditional uses of irrigation, drinking, fishing, and washing. Bangalore had the distinction of having hundreds of water bodies through the centuries. Even in early second half of 20th century, in 1961, the number of lakes and tanks in the city stood at 262 (and spatial extent of Bangalore was 112 sq. km). However, number of lakes and tanks in 1985 was 81 (and spatial extent of Bangalore was 161 sq. km). This forms important drainage courses for the interconnected lake system (Figure 3.2), which carries storm water beyond the city limits. Bangalore, being a part of peninsular India, had the tradition of harvesting water through surface water bodies to meet the domestic water requirements in a decentralised way. After independence, the source of water for domestic and industrial purpose in Bangalore is mainly from the Cauvery River and ground water. Untreated sewage is let into the storm water drains, which progressively converge at the water bodies. Now, Bangalore is the fifth largest metropolis in India currently with a population of about 8.72 million as per the latest population census. Spatial extent of the city has increased from 69 (1941) to 161 (1981), 226 (2001) and 745 (2011) sq.km. Due to the changes in the spatial extent of the city, the population density varies from 5956 (1941) to 18147 (1981), 25653 (1991), 25025 (2001) and 11704 (2011) persons per sq.km.
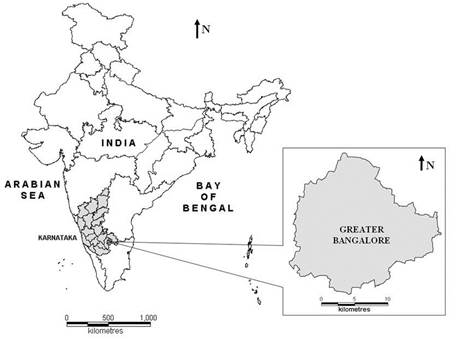
Figure 3.1: Study area –Bangalore


Figure 3.2: Watersheds (drainage with water bodies) of Bangalore
Land use analyses were carried out using supervised pattern classifier - Gaussian maximum likelihood classifier (GMLC) for Landsat and IRS data, and Bayesian Classifier (MODIS data). The method involved (Ramachandra et al., 2012): i) generation of False Colour Composite (FCC) of remote sensing data (bands – green, red and NIR). This helped in locating heterogeneous patches in the landscape ii) selection of training polygons (these correspond to heterogeneous patches in FCC) covering 15% of the study area and uniformly distributed over the entire study area, iii) loading these training polygons co-ordinates into pre-calibrated GPS, vi) collection of the corresponding attribute data (land use types) for these polygons from the field. GPS helped in locating respective training polygons in the field, iv) supplementing this information with Google Earth (latest as well as archived data), v) 60% of the training data has been used for classification, while the balance is used for validation or accuracy assessment.
Land use analysis carried out using GRASS - Geographic Resources Analysis Support System (http://wgbis.ces.iisc.ac.in/ grass) for the period 1973 to 2013 and details are in table 3.1 and urban dynamics is illustrated in Figure 3.3. There has been a 925% increase in built up area from 1973 to 2013 leading to a sharp decline of 79% area in water bodies in Bangalore mostly attributing to intense urbanisation process. Analyses of the temporal data reveals an increase in urban built up area of 342.83% (during 1973 to 1992), 129.56% (during 1992 to 1999), 106.7% (1999 to 2002), 114.51% (2002 to 2006) and 126.19% (2006 to 2010). The rapid development of urban sprawl has many potentially detrimental effects including the loss of valuable agricultural and eco-sensitive (e.g. wetlands, forests) lands, enhanced energy consumption and greenhouse gas emissions from increasing private vehicle use (Ramachandra and Shwetmala, 2009). Vegetation has decreased by 32% (during 1973 to 1992), 38% (1992 to 2002) and 64% (2002 to 2013). Disappearance of water bodies or sharp decline in the number of water bodies in Bangalore is mainly due to intense urbanisation and urban sprawl. Many lakes (54%) were encroached for illegal buildings. Field survey of all lakes (in 2007) shows that nearly 66% of lakes are sewage fed, 14% surrounded by slums and 72% showed loss of catchment area. In addition, lake catchments were used as dumping yards for either municipal solid waste or building debris (Ramachandra, 2009a). The surrounding of these lakes have illegal constructions of buildings and most of the times, slum dwellers occupy the adjoining areas. At many sites, water is used for washing and household activities and even fishing was observed at one of these sites. Multi-storied buildings have come up on some lake beds that have totally intervene the natural catchment flow leading to sharp decline and deteriorating quality of water bodies. This is correlated with the increase in built up area from the concentrated growth model focusing on Bangalore, adopted by the state machinery, affecting severely open spaces and in particular water bodies. Some of the lakes have been restored by the city corporation and the concerned authorities in recent times.
Table 3.1: Land use changes in Bengaluru during 1973 to 2013
Class à |
Urban |
Vegetation |
Water |
Others |
Year â |
Ha |
% |
Ha |
% |
Ha |
% |
Ha |
% |
1973 |
5448 |
7.97 |
46639 |
68.27 |
2324 |
3.40 |
13903 |
20.35 |
1992 |
18650 |
27.30 |
31579 |
46.22 |
1790 |
2.60 |
16303 |
23.86 |
1999 |
24163 |
35.37 |
31272 |
45.77 |
1542 |
2.26 |
11346 |
16.61 |
2002 |
25782 |
37.75 |
26453 |
38.72 |
1263 |
1.84 |
14825 |
21.69 |
2006 |
29535 |
43.23 |
19696 |
28.83 |
1073 |
1.57 |
18017 |
26.37 |
2010 |
37266 |
54.42 |
16031 |
23.41 |
617 |
0.90 |
14565 |
21.27 |
2013 |
50440 |
73.72 |
10050 |
14.69 |
445.95 |
0.65 |
7485 |
10.94 |
Urbanisation in Greater Bangalore |

|

|

|
Figure 3.3: Land use dynamics since 1973


Figure 3.4: Temperature profile in various directions. X axis – Movement along the transacts from the city centre, Y-axis - Temperature (°C)

Figure 3.5: Google Earth image showing the low temperature areas [Source: http://earth.google.com/]
The temperature profile plot fell below the mean when a vegetation patch or water body was encountered on the transact beginning from the centre of the city and moving outwards eight directions along the transact as in figure 3.4 It is evident that major natural green area and water bodies act as microclimate moderators responsible for lower temperature (marked with circle in Figure 3.5). The spatial location of these green areas and water bodies are marked in figure 3.5.

CONCLUSION
Urbanisation and the consequent loss of lakes has led to decrease in catchment yield, water storage capacity, wetland area, number of migratory birds, flora and fauna diversity and ground water table. Temporal land use analysis reveal that there has been a 925% increase in built up area from 1973 to 2013 leading to a sharp decline of 79% area in water bodies in Bangalore mostly attributing to intense urbanisation process. The increase in urban built up area ranges from 342.83% (during 1973 to 1992), 129.56% (during 1992 to 1999), 106.7% (1999 to 2002), 114.51% (2002 to 2006) to 126.19% (2006 to 2010). The gradient analysis showed that Bangalore grew radially from 1973 to 2010 indicating that the urbanization is intensifying from the city centre and has reached the periphery of the Bangalore. The temperature profile analysis by overlaying the LST on the land use reveal of higher temperatures in urban area while vegetation and water bodies aided in moderating temperature at local levels (evident from at least 2 to 2.5 °C lower temperature compared to urban pockets).
Frequent flooding in the city is a consequence of the drastic increase in impervious area (of 925% in 4 decades) and loss of wetlands (and interconnectivity of wetlands) with the high-density urban developments. The uncoordinated pattern of urban growth is attributed to a lack of good governance and decentralized administration, which was evident from the lack of coordination among many Para-state agencies. This has led to unsustainable use of the land and other resources. The mitigation of frequent floods and the associated loss of human life and properties entail the restoration of interconnectivity among wetlands, restoration of wetlands (removal of encroachments), conservation, and sustainable management of wetlands.
REFERENCES
-
Ramachandra, T.V. (2002). Restoration and management strategies of wetlands in developing countries. Electronic Green Journal, 15. http://egj.lib.uidaho.edu/index.php/egj/article/view/2839/2797
-
Ramachandra, T.V., Kiran, R., & Ahalya, N. (2002). Status, conservation and management of wetlands. New Delhi: Allied Publishers.
-
Ramachandra T V, Rajinikanth R and Ranjini V G, (2005), Economic valuation of wetlands, Journal of environment Biology, 26(2):439-447.
- Kulkarni, V. and Ramachandra T.V. (2009), Environmental Management, Commonwealth Of Learning, Canada and Indian Institute of Science, Bangalore, Printed by TERI Press, New Delhi
- Ramachandra T V, (2009a), Conservation and management of urban wetlands: Strategies and challenges, ENVIS Technical Report: 32, Environmental Information System, Centre for Ecological Sciences, Bangalore.
- Ramachandra T V, (2009b). Essentials in urban lake monitoring and management, CiSTUP Technical report 1, Urban Ecology, Environment and Policy Research, Centre for Infrastructure, Sustainable Transportation and Urban Planning, IISc, Bangalore
- Ramachandra T.V and Kumar U, (2008), Wetlands of Greater Bangalore, India: Automatic Delineation through Pattern Classifiers, The Greendisk Environmental Journal. Issue 26 (http://egj.lib.uidaho.edu/index.php/egj/article/view/3171).
- Ramachandra T V and Mujumdar P M, (2009). Urban floods: case study of Bangalore, Journal of Disaster Development, 3(2):1-98
- Ramachandra T.V. and Shwetmala (2009), Emissions from India's Transport sector: State wise Synthesis, Atmospheric Environment, 43 (2009) 5510–5517.
- Ramachandra T.V., (2009c).Soil and Groundwater Pollution from Agricultural Activities, Commonwealth Of Learning, Canada and Indian Institute of Science, Bangalore, Printed by TERI Press, New Delhi.
- Ramachandra. T.V., Bharath H. Aithal and Durgappa D. Sanna (2012) Insights to Urban Dynamics through Landscape Spatial Pattern Analysis., International Journal of Applied Earth Observation and Geoinformation, Vol. 18, Pp. 329-343.
- Ramachandra T V and Uttam Kumar (2009), Land surface temperature with land cover dynamics: multi-resolution,spatio-temporal data analysis of Greater Bangalore, International Journal of Geoinformatics, 5 (3):43-53
- Ramachandra T. V., Alakananda B, Ali Rani and Khan M A, (2011), Ecological and socio-economic assessment of Varthur wetland, Bengaluru (India), J Environ Science & Engg, Vol 53. No 1. p 101-108, January 2011.
- Ramachandra. T.V., Bharath H. Aithal and Uttam Kumar., (2012). Conservation of Wetlands to Mitigate Urban Floods., Resources, Energy, and Development. 9(1), pp. 1-22.
|
T.V. Ramachandra
Centre for Sustainable Technologies, Centre for infrastructure, Sustainable Transportation and Urban Planning (CiSTUP), Energy & Wetlands Research Group, Centre for Ecological Sciences, Indian Institute of Science, Bangalore – 560 012, INDIA.
E-mail : cestvr@ces.iisc.ac.in
Tel: 91-080-22933099/23600985,
Fax: 91-080-23601428/23600085
Web: http://ces.iisc.ac.in/energy
Asulabha K. S.
Energy & Wetlands Research Group, Centre for Ecological Sciences, Indian Institute of Science, Bangalore – 560 012, INDIA.
E-mail: asulabha@ces.iisc.ac.in
Sincy V.
Energy & Wetlands Research Group, Centre for Ecological Sciences, Indian Institute of Science, Bangalore – 560 012, INDIA.
E-mail: sincy@ces.iisc.ac.in
Sudarshan P Bhat
Energy & Wetlands Research Group, Centre for Ecological Sciences, Indian Institute of Science, Bangalore – 560 012, INDIA.
E-mail: sudarshan@ces.iisc.ac.in
Bharath H. Aithal
Energy & Wetlands Research Group, Centre for Ecological Sciences, Indian Institute of Science, Bangalore – 560 012, INDIA.
E-mail: bharath@ces.iisc.ac.in
Citation: Ramachandra T V, Asulabha K S, Sincy V, Sudarshan Bhat and Bharath H.Aithal, 2015. Wetlands: Treasure of Bangalore, ENVIS Technical Report 101, Energy & Wetlands Research Group, CES, IISc, Bangalore, India.
|