|
Wetlands/lakes constitute the earth’s most important freshwater resource, supporting huge biological diversity and provide a wide range of ecosystem services. Wetlands are highly productive ecosystems as they function as eco-tones, transition zones between different habitats, and have characteristics of both aquatic and terrestrial ecosystems. Wetlands are also the most threatened and fragile ecosystems that are susceptible to changes owing to changes in the composition of their biotic and abiotic factors (Ramachandra, 2005). They help in maintaining the ecological balance of the region and meets the need for life on the Earth such as source of drinking water, fish production, storage of water, sediment trapping, nutrient retention and removal, ground water recharge and discharge, flood and erosion control, transport, recreation, climate stabilizers, support for food chains, habitat for indigenous and migratory birds, etc. Wetlands/lakes also play a major role in treating and detoxifying a variety of waste products (Kiran and Ramachandra, 1999; Ramachandra and Solanki, 2007). Wetlands aid in remediation and aid as kidneys of landscape.
Wetland loss and degradation are due to conversion of wetland to non-wetland areas, encroachment of drainages (raja kaluves) through land filling, pollution due to sustained discharge of untreated domestic sewage as well as industrial effluents and dumping of solid waste, hydrological alterations (water withdrawal and inflow changes), and over-exploitation of their natural resources. These anthropogenic activities results in habitat degradation, weed infestation due to nutrient enrichment, loss of biodiversity and decline in goods and services provided by wetlands (Ramachandra, 2010). Pollution of water bodies is due to:
- pollutants entering from point sources (i) Nutrients from wastewater from municipal and domestic effluents (ii) Organic, inorganic and toxic pollution from industrial effluents (iii) Storm water runoff
- pollutants from non-point sources (i) Nutrients through fertilizers, toxic pesticides etc., from agriculture runoff (ii) Organic pollution from human settlements near lakes/fresh water resources.
The entry of untreated sewage into lakes has resulted in nutrient enrichment leading to eutrophication with algal blooms and macrophytes cover with dissolved oxygen depletion and malodor generation (Mahapatra et al., 2011). Land use and land cover (LULC) changes in the wetland catchment alter the physical and chemical integrity of the system, which influences the biological community structure of the area (Ramachandra et al., 2013).
Greater Bangalore with an area of 741 square kilometers lies between the latitudes 12°39’00” to 13°13’00”N and longitude 77°22’00” to 77°52’00”E. Bangalore is located at an altitude of 920 meters above mean sea level, delineating into three watersheds namely, Hebbal, Koramangala-Challaghatta and Vrishabhavathi watersheds. The undulating terrain in the region has facilitated creation of a large number of tanks (mainly attributed to the vision of Kempe Gowda and of the Wodeyar dynasty) providing for the traditional uses of irrigation, drinking, fishing and washing (Ramachandra and Kumar, 2008; Sudhira et al., 2007). Wetlands of Bangalore occupy about 4.8% of the city's geographical area (640 sq.km) covering both urban and non-urban areas. Bangalore has many manmade wetlands but no natural wetlands (Ramachandra and Ahalya, 2001). In 1973, Greater Bangalore had 207 water bodies, which has now reduced to 93 (by 2011), many lakes (54%) were encroached for illegal buildings (Ramachandra et al., 2013). Earlier field investigations had revealed that nearly 66% of lakes are sewage fed, 14% surrounded by slums and 72% showed loss of catchment area. About 30% of the lakes were drained for residential sectors. About 22% of lakes had land filling and construction activities. Now, lake beds are being used as dumping yards for either municipal solid waste or building debris (Ramachandra, 2010). The storm water drains, lake beds, flood plains and catchment areas have been encroached and converted to layouts or for commercial purposes. In case of Bangalore, a decline of vegetation by 66% and water bodies by 74% has been noticed with 584% growth in built-up area during the last four decades (Ramachandra et al., 2012). Recent studies reveal of 925% increase in built-up area with decline of 78% vegetation and 79% water bodies.
Water demand in Bangalore is roughly about 150 liters per day (lpd) per person and the total water requirement for domestic purposes is about 1,400 million liters per day (MLD). Water available from Cauvery (Stages I to IV, Phase I) and Arkavathy (Hesarghatta and Tippagondanahalli reservoirs) rivers is about 975 MLD. The loss of water during transportation and distribution is assumed to be ~30%. These indicate that there is a high demand for water/water scarcity in Bangalore (Ramachandra, et al., 2014). Functions of wetlands are listed in Table 1. Wetlands/lakes help in preventing frequent flooding and micro–climatic changes in the city. The decline in number of water bodies due to industrialization and urbanization had brought about many undesirable effects/impacts on water quality, diversity of flora and fauna and affected the livelihood of dependent population (fisherman, dhobis, etc.). There has been a decrease in the number of migratory birds. Wetlands capture rainwater efficiently and help in ground water recharge apart from aiding in the treatment as kidneys of the landscape. There has been a rapid increase in the number of bore wells in Bangalore over the last three decades from 5,000 to around 4.08 lakh. About 40% of Bengaluru populations are dependent on 750 MLD of ground water (Ramachandra, et al., 2014). The water scarcity issues in Bangalore city can be tackled if the lakes are well/properly maintained to satisfy the needs of the people.
Table 1: Importance of Wetlands/Lakes
FUNCTIONS
|
Wetlands as natural water purifiers –kidneys of the landscape |
Wetlands act as natural water purifiers by removing contaminants, excessive nutrients, and suspended particles and absorbing many pollutants in surface waters. This enhances the quality of groundwater supplies and mitigates the negative effects of point and non-point sources of pollution. |
Role in biogeological cycles |
Wetlands play an important role in atmospheric and natural cycles (bio geological cycles). |
Groundwater recharge and discharge |
Wetlands act like giant sponges, storing, then slowly releasing groundwater, and floodwater. The extent of groundwater recharge depends on the type of soil and its permeability, vegetation, sediment accumulation in the lakebed, surface area to volume ratio and water table gradient. |
Flood mitigation and erosion control |
Wetlands downstream of urban areas perform valuable flood control services. Wetlands along rivers and streams store excess water during rainstorms. This reduces downstream flood damage and lessens the risk of flash floods. The slow release of this stored water to rivers and streams helps keep them from drying up during periods of drought. |
Wetlands as carbon sinks |
Wetlands contain roughly 10-14% of the carbon. Their plants and rich soil store carbon instead of releasing it into the atmosphere as carbon-dioxide, which will contribute to global climate change. |
Wetland products |
Wetland products include fish, timber, medicinal plants, water supply for domestic and industrial purposes, energy resource, transport, recreation, tourism, etc. |
Microclimate control |
Wetlands control microclimate variations. Shade providing, biodiversity friendly trees and plants minimizes evapotranspiration levels. |
Provides habitat |
Wetlands serve as habitats for diverse organisms - planktons, insects, fishes, birds, amphibians, reptiles and support other wild life. |
Recreation activities |
Lakes provide areas for walking, jogging and exercise as well as small play areas for children. Many wetlands contain a diversity of plants and animals that provide beautiful places for sightseeing, fishing, hunting, boating, bird watching and photography. |
Educational purposes |
Wetlands provide opportunities for environmental education, research and public awareness programs. |
Reference |
Ramachandra, et al., 2001; Ramachandra and Solanki, 2007;
http://www.ecy.wa.gov/programs/sea/wetlands/functions.html; http://water.epa.gov/type/wetlands/outreach/upload/fun_val_pr.pdf |
According to Bruhat Bangalore Mahanagara Palike (BBMP), Bangalore city had lost many lakes due to developmental activities such as residential layouts, playgrounds, stadiums, industries, government buildings and bus stands. Lakebeds now are dominated by private projects, apartments and houses etc. (table 2).
Table 2: Lost wetlands of Bangalore
Lakes
|
Conversion to non- wetlands |
Agarahar Hosakere |
Cheluvadipalya |
Akkithimmanhalli lake |
Corporation Hockey stadium |
Baalayyana Kere (Kamakshipalya) |
Sports ground |
Banaswadi lake |
Subbayapalya Extension |
Challaghatta lake |
Karnataka golf Association |
Chenamma tank |
Burial ground, Banashankari 2nd Stage |
Chennasandra lake |
Pulla Reddy layout |
Chinnagara lake |
Ejipura |
Dasarahalli tank |
Dr. B.R Ambedkar Stadium |
Dharmambundhi lake |
Kempegowda Bus Terminal |
Domlur lake |
BDA layout |
Gangashetty lake |
Minerva mills and Open ground |
Gangodanhalli |
Gangodanhalli |
Geddalahalli lake |
RMV 2nd stage, 1st block |
Gokula Tank |
Mathikere |
Hennur lake |
Nagavara (HBR layout) |
Hoskere |
Residential Railway Stockyard |
Jakarayana Kere |
Krishna Floor mills |
Kadirenahalli lake |
Banashankari 2nd stage |
Kalasipalya lake |
Kalasipalya |
Karanji tank |
Gandhi Bazar area |
Kempambudhi |
Sewerage collection tank |
Ketamaranahalli lake |
Rajaji Nagar (Mahalakshmipuram) |
Kodihalli lake |
New Tippasandra/Government buildings/Residential layout |
Kodugondanahalli |
Kadugondanahalli/ Ambedkar Medical College |
Koramangala lake |
National Dairy Research Institute |
Kurubarahalli lake |
Basaveshwaranagar/Residential layout |
Marenahalli lake |
Residential layout |
Mestripalya lake |
Mestripalya (open ground) |
Millers lake |
Guru Nanak Bhavan, Badminton Stadium |
Murueshpalya lake |
Murueshpalya |
Nagashettihalli lake |
RMV 2nd stage, 2nd block/Space department |
Oddarapalya lake |
Rajajinagar (Industrial area) |
Parangipalya lake |
HSR layout |
Puttennahalli tank |
J.P. Nagar 6th Phase |
Ramashetty Palya kere |
Milk colony (Playground) |
Sampangi lake |
Kanteerava Stadium/Sports Complex |
Saneguruvanahalli lake |
Shivanahalli (Playground KSPCB buildings) |
Sarakki Agrahara lake/ Doresanipalya |
JP Nagar 4th phase |
Shivanahalli lake |
Playground, Bus stand |
Shoolay lake |
Football stadium |
Shule tank |
Ashok Nagar Football stadium |
Siddapura lake |
Siddapura/ Jayanagara 1st block |
Siddikatte Lake |
KR Market |
Sinivaigalu lake |
Residential layout |
Sonnenahalli lake |
Austin Town (RES Colony) |
Subhashnagar lake |
Residential layout |
Sunkal tank |
KSRTC Regional Workshop |
Timeyard lake |
Timeyard layout |
Tumkur lake |
Mysore Lamps |
Tyagarajanagara lake |
Tyagarajanagara |
Vidyaranyapura lake |
Vidyaranyapura (Jalahalli East) |
Vijanapura lake(Kotturu) |
Rajarajeshwari layout |
Vijayanagar Chord Road lake |
Vijayanagar |
Source:http://www.bpac.in/wp-content/uploads/2014/08/Death-of-lakes-and-the-future-of-bangalore.pdf;
http://bangalore.citizenmatters.in/articles/print/5029-bwssb-hoodwinking-bengaluru-on-water-crisis-says-former-bureaucrat; http://archive.deccanherald.com/deccanherald/oct192005/city20104420051018.asp |
The Bangalore Water Supply and Sewerage Board (BWSSB) is mandated to provide drinking water and treat the sewage generated in the city. Unfortunately, BWSSB has been transporting partially or untreated sewage to lakes. Due to this irresponsible act of para-state agency, existing lakes have been reduced to cesspools with the sustained inflow of untreated sewage. Coupled to this, untreated effluents from industries and dumping of solid wastes have further compounded the agony. Unplanned urbanization, lack of co-ordination among para-state agencies and enhanced anthropogenic activities have resulted to (i) the loss of interconnectivity among wetlands (due to encroachments of storm water drains and Raja kaluves, (ii) senseless conversion of wetlands, (iii) nutrient enrichment and heavy metal contamination in wetlands, (iv) increased episodes of floods, (v) dumping of solid wastes and building demolition debris, etc.
The shortfall or lack of sewage treatment facilities is the prime causal factor for contamination of surface and ground waters. The sewage treatment plants (STPs) can remove contaminants (Carbon and solids) from sewage water. BWSSB has commissioned STPs (table 3) in recent times. But the treatment efficiency is low, so a substantial part of the sewage goes untreated which makes lake water polluted. But, the introduction of an integrated wetland system as in JAKKUR Lake (consisting of sewage treatment plant, constructed wetlands with location specific macrophytes and algal pond integrated with the lake) helps in the complete removal of nutrients in a cost effective way (Ramachandra et al., 2014).
Table 3: STPs at Bangalore
Location of STP |
Designed capacity
(MLD) |
Technology used |
Capacity utilized
(2010, MLD) |
Vrishabhavathi (V) Valley (secondary) |
180 |
Secondary: trickling filter |
66 |
Koramangala-Challaghatta (K & C) Valley |
248 |
Secondary: activated sludge process |
102 |
Hebbal Valley |
60 |
Secondary: activated sludge process |
35 |
Madivala (mini STP) |
4 |
Secondary: UASB + oxidation ponds + constructed wetlands |
4 |
Kempambudhi (mini STP) |
1 |
Secondary: extended aeration |
1 |
Yelahanka |
10 |
Activated sludge process + filteration + chlorination (tertiary) |
2 |
Mylasandra |
75 |
Secondary: extended aeration |
33 |
Nagasandra |
20 |
Secondary: extended aeration |
4 |
Jakkur |
10 |
Secondary: UASB + extended aeration |
4 |
K R Puram |
20 |
Secondary: UASB |
3 |
Kadabeesanahalli |
50 |
Secondary: extended aeration |
31 |
Raja Canal |
40 |
Secondary: extended aeration |
15 |
Cubbon Park |
1.5 |
Membrane |
0.9 |
Lalbagh |
1.5 |
Extended aeration + plate settlers + ultra-violet disinfection |
0.9 |
Total |
721 |
|
302 |
(Source: http://cseindia.org/userfiles/bangaluru_portrait.pdf)
The aquatic conservation strategy should focus on conservation and maintenance of ecological health of aquatic ecosystems to maintain the aquatic biodiversity in the region, maintain inter-connectivity among lakes, and preserve its physical integrity (shorelines, banks and bottom configurations) and water quality to support healthy riparian, aquatic and wetland ecosystems. The regular monitoring of water bodies involving students at school, college and research institutions, and also public awareness will help in developing appropriate conservation and management strategies (Ramachandra et al., 2005).
The agencies that undertake conservation, restoration and maintenance of wetlands in BBMP area are Bangalore Water Supply and Sewerage Board (BWSSB), Bangalore Development Authority (BDA), Bangalore Metropolitan Regional Development Authority (BMRDA), Bangalore Mahanagara Palike (BBMP), Lake Development Authority (LDA), Minor Irrigation Department and Karnataka Forest Department.
The important recommendations suggested through Lakshman Rau committee report, emphasizing the preservation and restoration of existing tanks in Bangalore in 1988 are:
- The existing tanks help in ground water recharge so they should not be breached but retained as water bodies
- Efforts should be made to ensure that these tanks are not polluted by discharge of domestic and industrial wastes
- The tanks which have already been breached should not be utilized for formation of sites
- Offshore development by large scale planting of trees and also removal of encroachments to prevent silting
- Existing tanks should be deweeded and aquatic life must be developed
- The tank areas where there is no catchment should be handed over to Forest department for tree planting and formation of regional parks
- The Bangalore Development Authority / Bangalore City Corporation / Minor Irrigation Department must remove encroachments in the tank areas
- The Forest Department, Bangalore Development Authority, Bruhat Bengaluru Mahanagara Palike, Minor Irrigation Department, Bangalore Water Supply and Sewerage Board, and Town Planning Department should play an active role in the implementation of recommendations and these recommendations should be reviewed periodically
- The responsibility of maintenance of water bodies in a clean and safe condition should be with Bangalore Water Supply and Sewerage Board
- The possibility of construction of more tanks along the natural valleys which now have run-off water should be examined and implementation is to be taken up
Privatization of lakes in Bangalore: Livelihood of wetland dependent population and ecology research received major blow with the ill-conceived programme implementation under "public-private partnership" of LDA (Lake Development Agency) in 2004.
LDA began a process of "public-private participation" in 2004 where, private companies bid for the lakes to develop, beautify and maintain lakes under Develop/Operate/Transfer (DOT) or NON-DOT basis for the next 15 years. The private partners can be interested private/public participants, including Registered NGO’s, Corporations/Business Houses/Resident Associations etc. These private partners can be involved in the conservation of lakes and allowed to operate recreational facilities in return for conserving and maintaining the lake. The private partner shall be responsible for desilting, dredging, landscaping, sewage diversions, foreshore and island development, building of walkways and jogging paths, creation of tree parks, rock gardens, children park area, cycling tracks, fountains, electrification for illumination etc. They can be allowed to construct boat jetty, sports fishing, bird watching, Butterfly park, boating, eco-friendly water sports, eco friendly restaurants etc to generate revenues to make the project financially viable (Thippaiah, 2009; Lake Conservation, Karnataka). Some privatized lakes in Bangalore are Hebbal lake, Nagavara lake (also called Lumbini Gardens after privatization) and K.R. Puram lake or Vengaiahna kere (also called Fantasy Lagoon, or Hagalu Kanasina Kere, after privatization). In May 2004, LDA leased out the Hebbal lake to East India Hotels Ltd (Oberoi group) for a period of 15 under the Public-Private Partnership policy.The Nagavara lake was leased to Lumbini Developers in 2004 for a period of 15 years and Vengaiahnakere was leased to Par C Ltd. The privatization of lakes has severely impacted the natural ecosystem due to:
-
increased commercialization of public/natural assets,
-
construction of theme parks, entertainment venues and shopping malls affected natural ecosystem,
-
violation of land use regulations by the private partners during implementation of the scheme,
-
denying access to dependent populations for washing, bathing; for fodder; fishing, irrigation, recreation, etc.,
-
poor water quality (due to lack of maintenance) and impact on flora and fauna
The common threats (figure 1, table 4) faced by lakes in Bangalore include a) dumping of building debris, plastic and solid waste into lakes, b) constructing buildings illegally near or on the lakes by the developers/agencies, c) improper and damaged fencing which will increase encroachments in the area, e) inflow of untreated sewage into lakes from surrounding households, apartments, companies, industries etc. and f) filling the lake area of abandoned lakes. The mismanagement of municipal solid waste management in Bangalore has affected the local environment, which is evident from illegal dumping of solid wastes and building debris in lake beds, open drains, parks and open spaces, etc. The leaching of organic fraction of solid waste contaminates land and water (Shwetmala et al., 2012).

Figure 1: Common threats faced by lakes in Bangalore: a) Dumping of building debris, b) plastic and solid waste dumping, c) constructing building near the lakes, d) improper and damaged fencing, e) inflow of untreated sewage into lakes and f) filling the lake area of abandoned lakes.
Table 4: The common threats faced by lakes in Bangalore are:
Sl.No |
Problems faced by lakes |
Effects on lakes |
1. |
Discharge of untreated domestic sewage into lakes |
- Degradation of water quality
- Nutrient accumulation
- Dissolved oxygen depletion
- Over growth of algae and aquatic macrophytes
- Accumulation of silt and organic matter
- Reduction in depth of lake
- Contamination of ground water
- Odour problems; Loss of aesthetic value
|
2. |
Encroachment of lake and construction activities in the lake catchment |
- Reduction of catchment area of lakes
- Reduction of ground water table as water recharge capacity goes down
- Increased discharge of domestic sewage
- Generation of building debris and solid wastes
- Soil erosion, Silt accumulation
- Cutting down of trees in that location
- Affects bird population
- Loss of interconnectivity among lakes
|
3. |
Land use changes |
- Reduction of catchment area
- Affects the hydrological regime
- Affects climatic condition
|
4. |
Unplanned urbanization |
- Loss of wetlands and green spaces
- Increased frequency of floods
- Decline in groundwater table
- Heat island
- Increased carbon footprint
|
5. |
Threat to ecological balance |
- Aquatic biodiversity is affected (fish, birds, flora and fauna that are dependent on lake system)
|
6. |
Decline of Ecosystem goods and services |
- Affects economic growth and livelihood of local people
|
7. |
Removal of shoreline riparian vegetation |
- Causes soil erosion
- Effects the habitat of aquatic organisms
|
8. |
Dumping of municipal solid waste and building debris |
- Affects human health
- Breeding of disease vectors and pathogens
|
Reference |
Ramachandra et al., 2015b |
The main consequences faced by lakes (figure 2) due to anthropogenic activities include a) profuse growth of algae and macrophytes due to nutrient enrichment. This leads to oxygen depletion in lakes, affecting aquatic flora and fauna (example, fish death), b) lake will eventually dry up due to accumulation of silt and organic sediments. This reduces the water holding capacity of the lakes and also contaminates ground water, c) The disposal of solid and liquid wastes to the lakes makes water black in color with stinking environment, d) Foams are formed in lakes naturally when algae and fish, die and decompose, releasing a variety of organic compounds into the waterbody. The surface-active agents in wastewater include synthetic detergents, fats, oils, greases and biosurfactants. These act as surfactants and reduce surface tension among water molecules. When air mixes with water molecules vigorously, foam formation occurs. Bellandur and Varthur lakes faced severe froth formation and also fire (Ramachandra et al., 2015b).
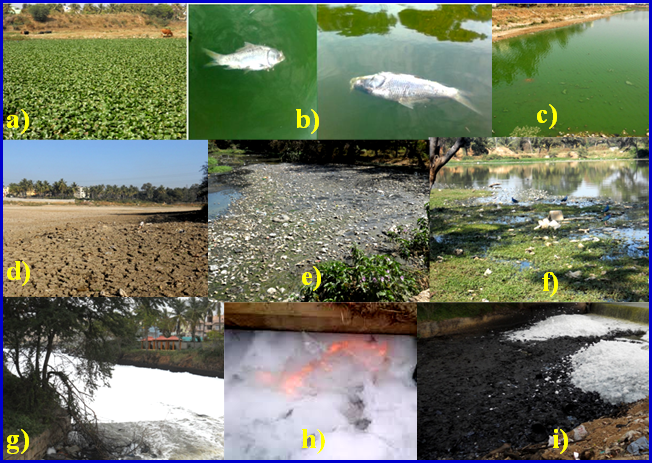
Figure 2: The consequences faced by lakes due to anthropogenic activities: a) fully covered with macrophytes, b) fish death, c) profuse growth of algae, d) dried up lake, e) lake with accumulated plastics wastes, f) black coloured stagnant water with stinking environment, g) foam formation, h) fire in lakes and i) accumulation of organic sediments.
Water pollution and health effects: The pollution of fresh water bodies and ground water are harmful for human and animal health. Polluted water may have undesirable colour, odour, taste, turbidity, high total dissolved solids (TDS), nitrates, phenols, salts, harmful chemical contents, toxic and heavy metals, pesticides, oily matters, industrial waste products, domestic sewage content, organic matter contents, bacteria, protozoa, rotifers, virus, worms, etc. These makes the fresh water unfit for drinking and irrigation purposes. Nitrate contamination in drinking water causes ‘blue baby’ syndrome and is linked to digestive tract cancers. Water-borne diseases like Hepatitis, cholera, dysentery, and typhoid are infectious diseases spread primarily through contaminated water. The exposure to polluted water can cause skin irritation, respiratory problems etc. Untreated water provides a habitat for the mosquito and a host of other parasites and insects that cause a large number of diseases. The proper management of water resources can tackle such water-borne epidemics and health hazards.

2.1 WATER QUALITY ASSESSMENT
Water quality assessment includes periodical monitoring of lakes to understand the present status of water bodies, identify and quantify trends in water quality, which will help in understanding the water quality problems as well as contamination status. All these information will help decision makers, resource management groups, regulatory agencies and public to solve water quality as well as water scarcity issues in the state/country and make necessary decisions (Ramachandra, 2009).
The continuous inflow of sewage into lakes results in the prolific growth of macrophytes due to increased levels of nutrient in the system. This restricts sunlight penetration and reduces algal photosynthesis hindering the aerobic environment of lake. Also, the roots of these floating macrophytes harbor bacteria. The high bacterial activity in lakes also reduces DO levels. The overgrowth, ageing, and subsequent decay of macrophytes creates anoxic conditions and depletes oxygen level in lakes which in turn, affects the food chain and the whole aquatic eco system (Mahapatra et al., 2011). The excessive growth/bloom formation of cyanobacteria persists in water bodies that contain adequate levels of essential inorganic nutrients such as nitrogen and phosphorus and increased levels of organic matter. Fish deaths in lakes occur due to water pollution and sudden change in temperature (thermal stress), high ammonia concentrations and hydrogen sulphide, oxygen depletion, diseases and parasite attacks, overcrowded fish population and excessive algae or other plant growth in lakes (Ramachandra et al., 2015). Pollution of water bodies will in turn, affect the aquatic organisms like algae, zooplankton and macrophytes, by bringing about changes in the species composition of the aquatic communities, the dominance of a particular species, decline in species diversity, mortality of some species and sensitive life stages (larvae and eggs).
Table 5: The various physico-chemical parameters with explanations
Parameters |
Explanations |
Water Temperature (°C) |
Temperature effects various physical, chemical and biological reactions in the aquatic organisms. It influences water chemistry i.e. DO, solubility, density, pH, alkalinity, salinity, conductivity etc. Aquatic organisms have varying tolerance to temperature. An increase in the temperature speeds up the chemical reactions, increases the rate of metabolic activities, reduces the solubility of gases like dissolved oxygen and carbon dioxide in the water. |
TDS (mg/l) |
Total Dissolved solids are solids that are in the dissolved state in water. TDS constitutes inorganic salts, as well as a small amount of organic matter. The chloride, carbonates, bicarbonates, phosphates, nitrates, sodium, potassium, iron, manganese, sulphates, etc. contribute towards TDS in lakes. |
EC (µS/cm) |
Electrical Conductivity (the ability of water to conduct an electric current) depends on the total concentration, mobility, valence and the temperature of the solution of ions. Chloride, carbonates, bicarbonates, phosphates, nitrates, sodium, potassium, iron, manganese, sulphates, etc. contribute towards EC in lakes. |
pH |
pH is the measure of acidity or alkalinity of water. pH scale ranges from 0 to 14 (i.e., very acidic to very alkaline) with pH 7 being neutral. pH is also governed by the equilibrium between carbon dioxide/bicarbonate/carbonate ions. At day time, pH increase due to the photosynthetic activity (consumption of carbondioxide) whereas pH decreases during night due to respiratory activity (release of carbondioxide). |
Turbidity (NTU) |
Turbidity in water is caused due to the presence of clay, silt, organic and inorganic matter, plankton and other microscopic organisms. It also makes water unfit for domestic purposes as well as other industrial uses. |
DO (mg/l) |
Oxygen is essential to all life forms. DO more than 5 mg/l favors good aquatic life. The two main sources of dissolved oxygen are diffusion of oxygen from the air and photosynthetic activity. The presence of high amount of organic matter, hydrogen sulphide, ferrous ions, ammonia, nitrates and other oxidizable substances in lakes imposes a very high oxygen demand, which may in turn, lead to oxygen depletion thus, affecting other aquatic life. |
COD (mg/l) |
Chemical oxygen demand (COD) determines the amount of oxygen required for chemical oxidation of most organic matter and oxidizable inorganic substances with the help of strong chemical oxidant. COD is also determined by the presence of various organic and inorganic materials like calcium, magnesium, potassium, sodium etc. |
BOD (mg/l) |
BOD is the amount of oxygen required by microorganisms for stabilizing biologically decomposable organic matter (carbonaceous) in water under aerobic conditions. Plankton/wetland plant decay and leaf fall, domestic wastes and stormwater runoff from farmland or urban areas contribute to BOD. |
Alkalinity (mg/l) |
Alkalinity is a measure of the buffering capacity of water. It is the good indicator of presence of dissolved inorganic carbon (bicarbonates and carbonate anions). The presence of excess of hydroxyl ions, borates, silicates, phosphate etc. in lake water causes alkalinity. |
Chloride (mg/l) |
Chloride is an indicator of water pollution and is an abundant anion found in the wastewaters. The sources of chloride in water are dissolution of salt deposits, discharge of effluents from industries, sewage discharges, etc. The excreta contain high quantities of chlorides and other nitrogenous compounds. |
Total Hardness, Calcium Hardness and
Magnesium Hardness (mg/l) |
Hardness of water is mainly due to the presence of calcium, magnesium, carbonates, bicarbonates, sulphates, chloride, nitrates etc. Higher values of hardness in lakes are due to the regular addition of sewage and detergents. Hard water is unfit for domestic and industrial purposes. Calcium is an important micronutrient in aquatic environment and is especially required in large quantities by molluscs and vertebrates. Magnesium acts as a co-factor in various enzymatic reactions and constitutes the chlorophyll molecule, which is essential for photosynthesis. Sewage and industrial wastes are major contributors of calcium and magnesium in lake water. |
Phosphate (mg/l) |
Phosphates are essential for the growth of phytoplankton (used up as orthophosphates) and acts as a limiting nutrient that limits primary productivity of aquatic ecosystems. The major sources of phosphorus are domestic sewage, detergents, agricultural runoff and industrial wastewater. |
Nitrate (mg/l) |
Nitrate is the oxidized form of nitrogen and end- product of aerobic decomposition of organic nitrogenous matter. The major sources of nitrate are precipitation, surface run off, sewage, organic matter, leaf litter etc. |
Sodium (mg/l) |
Sodium is highly soluble in water and makes water salty and unfit for use. Sodium is present is in water treatment chemicals, in domestic water softeners, and in sewage effluents. |
Potassium (mg/l) |
Potassium is found in lesser concentrations naturally than calcium, magnesium and sodium ions. The natural source of potassium is weathering of rocks, but it also increases due to sewage entry to lakes. |
References |
Ramachandra et al., 2001; Ramachandra and Ahalya, 2001; Ramachandra et al., 2005; Ramachandra et al., 2014a; Ramachandra et al., 2014b; Ramachandra et al., 2015a; Ramachandra et al., 2015b; Ramachandra et al., 2015c; Sincy et al., 2012; Sincy et al., 2014. |
The trophic structure includes various trophic levels as producers (algae, bacteria), primary consumers (zooplanktons and grazers), secondary consumers (small fish), tertiary (large fish, birds, etc.). The nutrient loading in lakes increases the phytoplankton productivity, zooplankton and fish density. Also, macrophytes grow well in nutrient rich water.
Phytoplankton/Algae (figure 3 and table 6) are unicellular, colonial or filamentous forms and mostly photosynthetic thus, forms the basis of aquatic food chain. Phytoplanktons are the producers and grazed upon by the zooplanktons and other organisms present in the same environment. The quality of water (nutrients) influence its population. Phytoplankton survey thus indicates the trophic status and the presence of organic population in the ecosystem (Asulabha et al., 2014). The high nutrients due to sewage inflow in to a water body causes algal blooms, sometimes creating offensive tastes and odours or toxic conditions in water bodies.
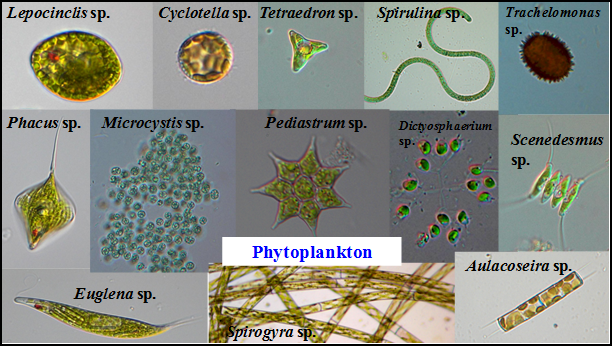
Figure 3: Phytoplanktons in lakes of Bangalore

Figure 4: Zooplanktons in lakes of Bangalore
Zooplankton (figure 4 and table 6) comprises of microscopic protozoan, rotifers, cladocerons and copepods. They constitute an important link in food chain as grazers (primary and secondary consumers) and serve as food for fishes directly or indirectly. Therefore, any adverse effect to zooplankton community may affect the fish populations. Zooplanktons have short generation time (usually days to weeks). Zooplankton diversity responds rapidly to changes in the aquatic environment, so they serve as a bioindicators and thus, used for water pollution studies.
Table 6: Phytoplankton and Zooplankton as pollution indicators
Indian StandardDrinking Water - Specification ( Second Revision )
ANNEX C (Clause 4.3.10)
Illustrative List of Microscopic Organisms Present in Water |
Group and Name of the Organism |
Habitat |
Effects/significance |
Classification of Microscopic Organism: 1. Algae |
a) Chlorophyceae:
1) Species of Coelastrum, Gomphosphaerium, Micractinium, Oocystis, Scenedesmus, Chlorella, Actinastrum, Gonium, Eudorina, Pandorina, Pediastrum, Chlamydomonas, Spirogyra, Chroococcus, Stigeoclonium
Tetraedron, Chlorogonium, |
Polluted water,
impounded
sources |
Impart
colouration
|
2) Species of Pandorina, Volvox, Gomphospherium, Staurastrum, Hydrodictyon, Nitella |
Polluted waters |
Produce taste and
odour |
3) Species of Calothrix, Ankistrodesmus, Ulothrix, Micrasterias |
Clean water |
Indicate clean
condition |
4) Species of Chlorella, Closterium, Spirogyra, Palmella |
Polluted waters,
impounded
sources |
Clog filters and
create impounded
difficulties |
b) Cyanophyceae:
1) Species of Anacystis and Cylindrospermopsis |
Polluted waters |
Cause water
bloom and impart
colour |
2) Species of Anabena, Phormidium, Lyngbya, Arthrospira, Oscillatoria |
Polluted waters |
Impart colour |
3) Species of Anabena, Anacystis,
Aphanizomenon |
Polluted waters,
impounded
sources |
Produce taste and
odour |
4) Species of Anacystis, Anabaena,
Coelospherium, Aphanizomenon |
Polluted waters |
Toxin producing |
5) Species of Anacystis, Rivularia, Anabaena
Oscillatoria |
Polluted waters |
Clog filters |
c) Diatoms (Bacillariophyceae):
1) Species of Fragillaria, Stephanodiscus, Stauroneis |
- |
Cause
discoloration |
2) Species of Asterionella, Tabellaria |
Hill streams
high altitude,
torrential and
temperate waters |
Taste and odour
producing clog
filters |
3) Species of Synedra and Fragillaria |
Polluted waters |
Taste and odour
producing |
4) Species of Nitzschia, Gomphonema |
Moderately
polluted waters |
Cause
discoloration |
5) Species of Cymbella, Synedra, Melosira, Navicula, Cyclotella, Fragillaria, Diatoma |
Rivers and
streams
impounded
sources |
Clog filters and
cause operational
difficulties |
6) Species of Pinmularia, Surirella, Cyclotella, Meridion, Cocconeis |
Clean waters |
Indicators of
purification |
d) Xanthophyceae:
Species of Botryococcus |
Hill streams,
high altitude and
temperate waters |
Produces
coloration |
Classification of Microscopic Organism: Zooplankton |
a) Protozoa: 1) Amoeba, Giardia, Lamblia, Arcella, Difflugia, Actinophrys |
Polluted waters |
Pollution
indicators |
2) Endoamoeba histolytica |
Sewage and
activated sludge |
Parasitic and
pathogenic |
b) Ciliates: Paramoecium, Vorticella, Stentor, Colpidium, Coleps, Euplotes, Colopoda, Bodo |
Highly polluted
waters, sewage
and activated
sludge |
Bacteria eaters |
c) Crustacea: 1) Bosmina, Daphnia |
Stagnant polluted
waters |
Indicators of
pollution |
2) Cyclops |
Step wells in
tropical climate |
Carrier host of
guinea worm |
d) Rotifers
i) Rotifers: Anurea, Rotaria, Philodina |
Polluted and
Algae laden
waters |
Feed on algae |
ii) Flagellates: 1) Ceratium, Glenodinium, Peridinium, Dinobryon |
Rocky strata, iron
bearing and
acidic water |
Impart colour
and fishy taste |
2) Euglena, Phacus |
Polluted waters |
Impart colour |
Macrophytes (figure 5) are aquatic plants that grow in or near water and are emergent, sub-mergent, or floating. Macrophytes are the plants that dominate in wetlands, shallow lakes, and streams. They act as food for some fish and wildlife and produces oxygen. A decline in a macrophyte community may indicate water quality problems (high turbidity, herbicides, or salinization). If lakes have high nutrient contents, an overabundance of macrophyte occurs, which may in turn interfere with lake functioning. The nutrients so logged in the body material are released only after death, decay and subsequent mineralization thus, their role in nutrient dynamics and primary productivity of shallow systems are important (Bhat and Ramachandra, 2014). Some macrophytes are now used in “constructed wetlands” to remove nutrients and reduce concentrations of phosphorus and nitrogen from raw sewage or from the effluent sewage treatment facilities.

Figure 5: Macrophytes in lakes of Bangalore
2.2 MATERIALS AND METHODS
An exploratory field survey was conducted to understand the prevailing condition of lakes in Bangalore. The survey included 105 lakes and out of which 25 were completely covered with macrophytes (predominantly water hyacinth). The physico – chemical characteristics of 80 lakes were assessed.
Water Quality Analysis: The analysis of physico- chemical parameters like water temperature; pH; total dissolved solids; electrical conductivity; turbidity; dissolved oxygen; chemical oxygen demand; total alkalinity; chloride; total hardness; calcium hardness; magnesium hardness; nitrate; orthophosphate; sodium and potassium of lake samples collected from Bangalore district were done according to the standard procedures by APHA AWWA WEF (1998) and Trivedy Goel (1986).
Table 7: Standard methods followed for water quality analysis
Parameters |
Methods (with Reference) |
Onsite Measurements |
Water temperature (0C) |
Eutech: PCSTestr 35 |
pH |
Eutech: PCSTestr 35 |
Total Dissolved Solids (TDS, mg/l) |
Eutech: PCSTestr 35 |
Electrical conductivity (µS/cm) |
Eutech: PCSTestr 35 |
Dissolved Oxygen (DO) (mg/l) |
Winkler’s Method (APHA, 1998: 4500-O) |
Laboratory Measurements |
Hardness (mg/l) |
EDTA titrimetric method (APHA, 1998: 2340-C) |
Calcium hardness (mg/l) |
EDTA titrimetric method (APHA, 1998: 3500-Ca B) |
Magnesium hardness (mg/l) |
Magnesium by calculation (APHA, 1998:3500-Mg) |
Sodium (mg/l) |
Flame emission photometric method (APHA, 1998:3500-Na B) |
Potassium (mg/l) |
Flame emission photometric method (APHA, 1998: 3500-K B) |
Alkalinity (mg/l) |
Titrimetric method (APHA, 1998: 2320 B) |
Chloride (mg/l) |
Argentometric method (APHA, 1998:4500-Cl- B) |
Biochemical Oxygen Demand(mg/l) |
5-Day BOD test (APHA, 5210 B, Trivedi and Goel, 1986, pp.53-55) |
Chemical Oxygen Demand (mg/l) |
Closed reflux, titrimetric method (APHA, 5220 C, Trivedi&Goel, 1986, pp.55-57) |
Nitrates |
Phenol Disulphonic acid method (Trivedy and Goel, 1986: pp 61) |
Orthophosphates (mg/l) |
Stannous chloride method (APHA, 4500-P) |
Turbidity(NTU) |
Nephlophotometer |
The water quality results are compared with reference to BIS drinking water standards and Classification of Inland Surface Water (CPCB, table 8)
Plankton collection and Identification: The plankton samples were collected by filtering 50 litres of lake water through the standard plankton net (No. 25 bolting silk cloth net of mesh size 63 mm and 30 cm diameter). The final volume of the filtered sample was made to 20 ml and then transferred to another 125 ml plastic bottle and labeled, mentioning the time, date and place of sampling. The samples collected were preserved by adding 2ml of 5% formalin. The phytoplanktons and zooplanktons were identified using microscope based on the standard keys (Ramachandra et al., 2006; Altaff, 2004; APHA, 1998; Prescott, 1954; Desikachary, 1959).
Macrophyte collection and Identification: In lakes, quadrats laid at different localities (inlet, outlet and middle) randomly and macrophyte samples are collected (all species falling in the quadrat). Then, samples were washed and identified using standard keys (APHA, 1998).
Table 8: Classification of Inland Surface Water (CPCB)
As per ISI-IS: 2296-1982 |
Classification |
Type of use |
Class A |
Drinking water source without conventional treatment but after disinfection |
Class B |
Outdoor bathing |
Class C |
Drinking water source with conventional treatment followed by disinfection |
Class D |
Fish culture and wild life propagation |
Class E |
Irrigation, industrial cooling or controlled waste disposal |
Characteristic |
A |
B |
C |
D |
E |
pH |
6.5 - 8.5 |
6.5 - 8.5 |
6.5 - 8.5 |
6.5 - 8.5 |
6.0 - 8.5 |
DO (mg/L) |
6 |
5 |
4 |
4 |
- |
BOD (mg/L) |
2 |
3 |
3 |
- |
- |
TDS, mg/l, Max |
500 |
- |
1500 |
- |
2100 |
Electrical Conductance at 25 °C, µS, Max |
- |
- |
- |
1000 |
2250 |
Total Hardness (as CaCO3), mg/l, Max |
300 |
- |
- |
- |
- |
Calcium Hardness (as CaCO3), mg/l, Max |
200 |
- |
- |
- |
- |
Magnesium Hardness (as CaCO3), mg/l, Max |
100 |
- |
- |
- |
- |
Chlorides (as Cl), mg/l, Max |
250 |
- |
600 |
- |
600 |
Nitrates (as NO2), mg/1, Max |
20 |
- |
50 |
- |
- |
|
T.V. Ramachandra
Centre for Sustainable Technologies, Centre for infrastructure, Sustainable Transportation and Urban Planning (CiSTUP), Energy & Wetlands Research Group, Centre for Ecological Sciences, Indian Institute of Science, Bangalore – 560 012, INDIA.
E-mail : cestvr@ces.iisc.ac.in
Tel: 91-080-22933099/23600985,
Fax: 91-080-23601428/23600085
Web: http://ces.iisc.ac.in/energy
Asulabha K. S.
Energy & Wetlands Research Group, Centre for Ecological Sciences, Indian Institute of Science, Bangalore – 560 012, INDIA.
E-mail: asulabha@ces.iisc.ac.in
Sincy V.
Energy & Wetlands Research Group, Centre for Ecological Sciences, Indian Institute of Science, Bangalore – 560 012, INDIA.
E-mail: sincy@ces.iisc.ac.in
Sudarshan P Bhat
Energy & Wetlands Research Group, Centre for Ecological Sciences, Indian Institute of Science, Bangalore – 560 012, INDIA.
E-mail: sudarshan@ces.iisc.ac.in
Bharath H. Aithal
Energy & Wetlands Research Group, Centre for Ecological Sciences, Indian Institute of Science, Bangalore – 560 012, INDIA.
E-mail: bharath@ces.iisc.ac.in
Citation: Ramachandra T V, Asulabha K S, Sincy V, Sudarshan Bhat and Bharath H.Aithal, 2015. Wetlands: Treasure of Bangalore, ENVIS Technical Report 101, Energy & Wetlands Research Group, CES, IISc, Bangalore, India.
|