
|

|

|

GROUNDWATER QUALITY OF PANDAVAPURA TOWN, MANDYA DISTRICT, KARNATAKA, INDIA
L. Prasanna Kumar1 and D. Nagaraju2

|
|
|
|
 ABSTRACT
INTRODUCTION
STUDY AREA
METHODS OF STUDY
RESULTS
TOTAL DISSOLVED SOLIDS
ELECTRICAL CONDUCTIVITY (Micro mhos/cm at 25oC)
SODIUM ADSORPTION RATIO
CORROSIVITY RATIO
HARDNESS
SALINITY SODIUM HAZARD
STUYFZAND'S GROUNDWATER TYPES
STUYFZAND'S GROUNDWATER FACIES
PIPERS SIGNIFICANT ENVIRONMENT
STUYFZAND'S SIGNIFICANT ENVIRONMENT
DONEEN'S PERMEABILITY INDEX
REFERENCES
TABLE 1: CHEMICAL CONSTITUENCY OF GROUNDWATER IN PANDAVAPURA TOWN
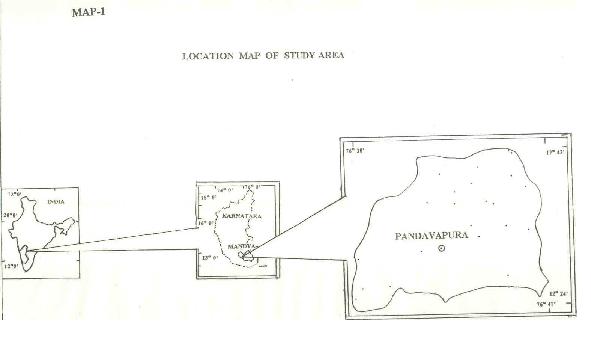
MAP-1: LOCATION MAP OF STUDY AREA
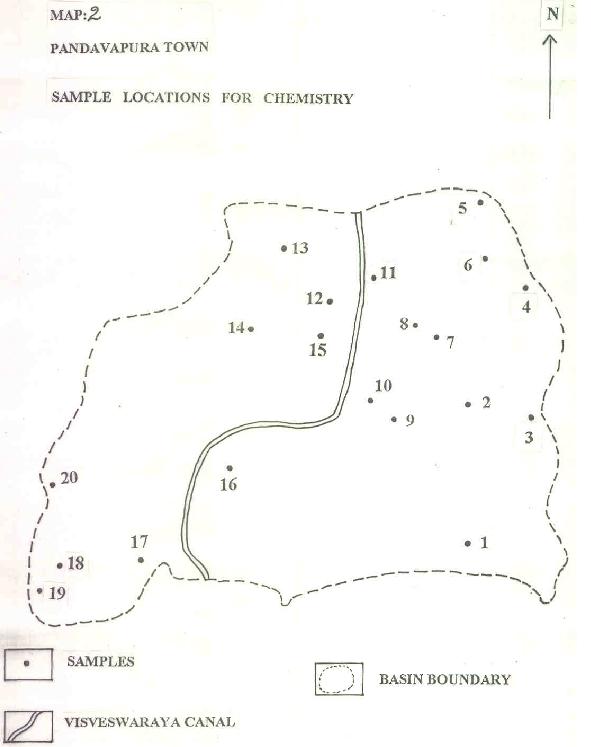
MAP-2: PANDAVAPURA TOWN - SAMPLE LOCATIONS FOR CHEMISTRY
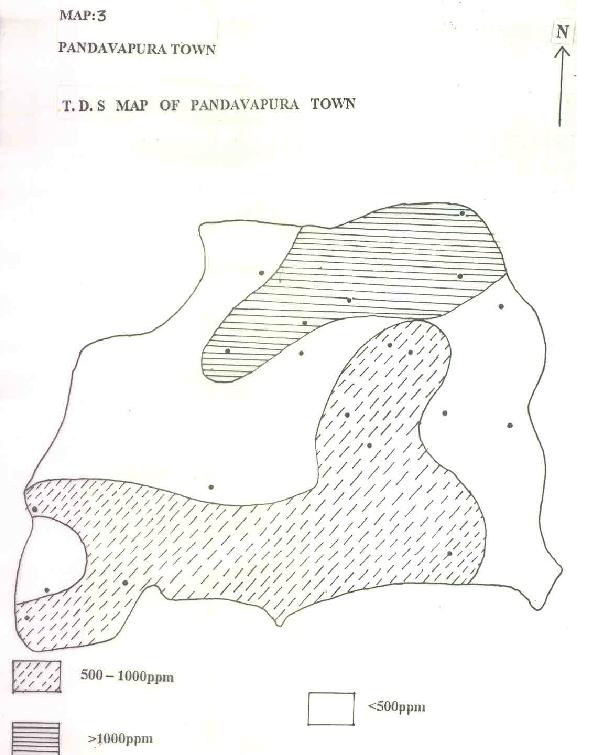
MAP-3: PANDAVAPURA TOWN - T.D.S MAP OF PANDAVAPURA TOWN
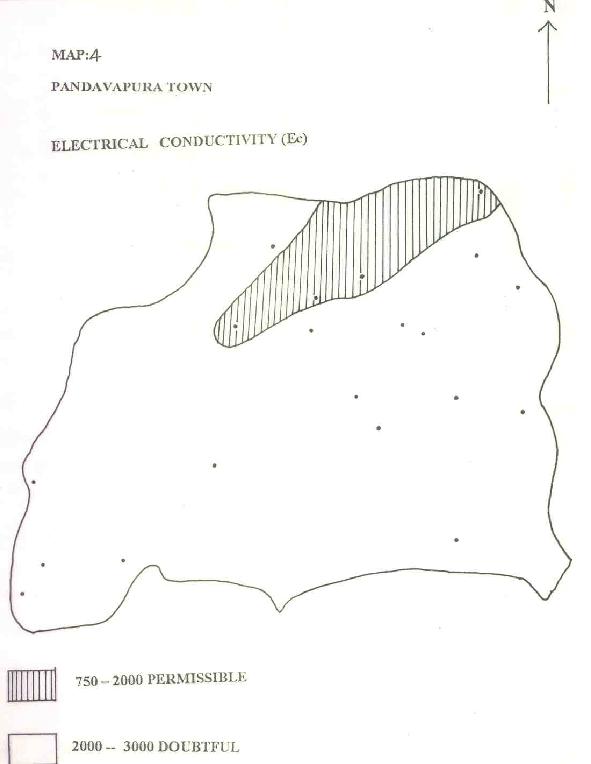
MAP-4: PANDAVAPURA TOWN - ELECTRICAL CONDUCTIVITY(Ec)
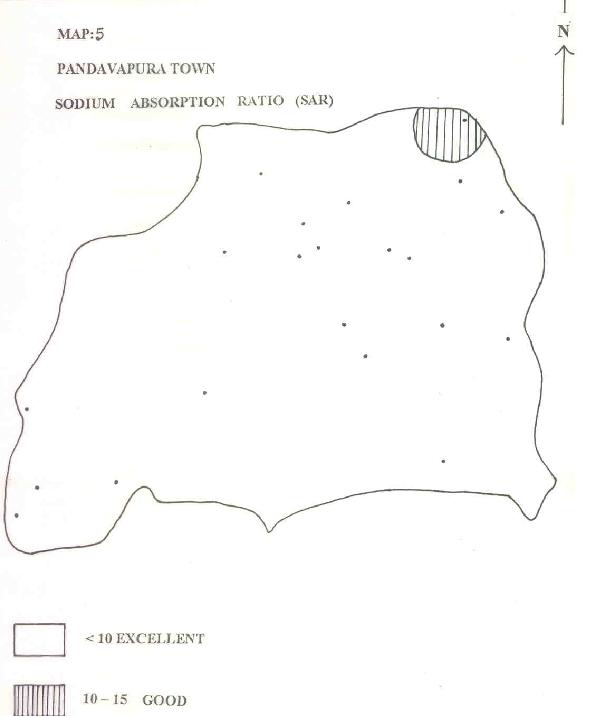
MAP-5: PANDAVAPURA TOWN - SODIUM ABSORPTION RATIO (SAR)
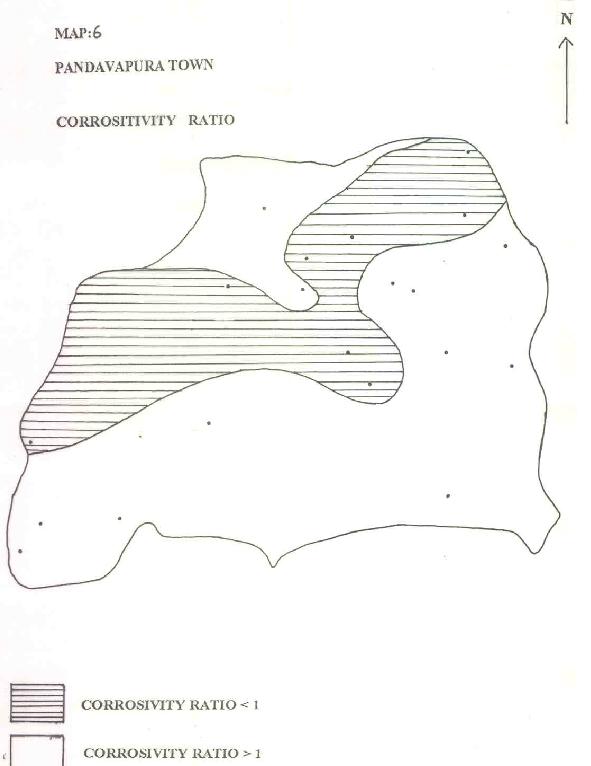
MAP-6: PANDAVAPURA TOWN - CORROSITIVITY RATIO
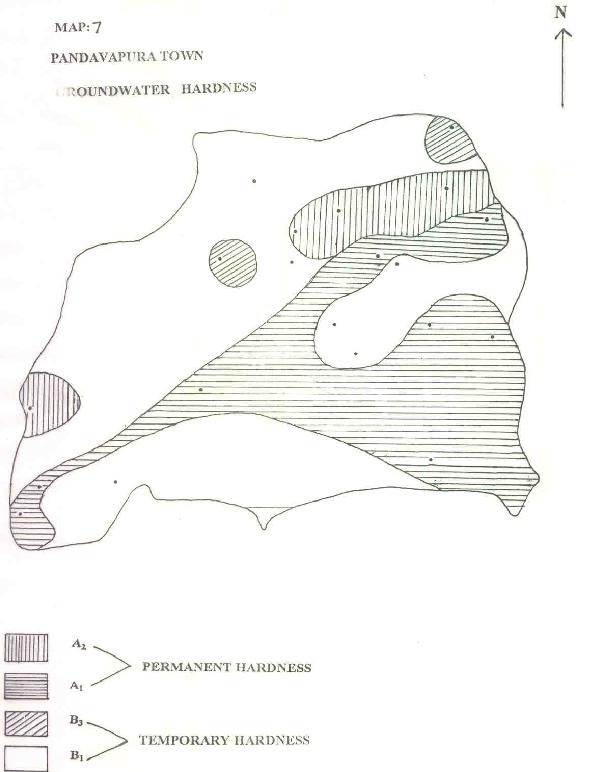
MAP-7: PANDAVAPURA TOWN - GROUNDWATER HARDNESS
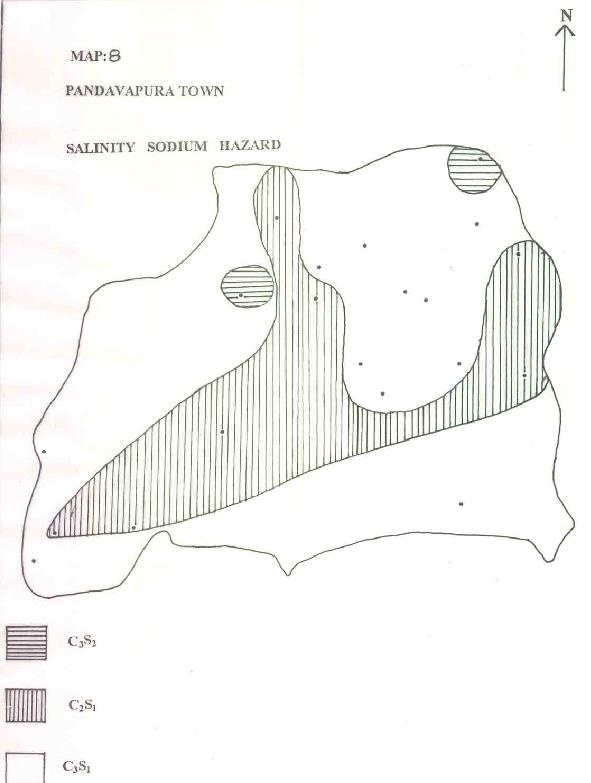
MAP-8: PANDAVAPURA TOWN - SALINITY SODIUM HAZARD
MAP-9: PANDAVAPURA TOWN - STUYFZAND`S GROUNDWATER TYPES
MAP-10: PANDAVAPURA TOWN - STUYFZAND`S GROUNDWATER FACIES
MAP-11: PANDAVAPURA TOWN - PIPES SIGNIFICANT ENVIRONMENT
MAP-12: PANDAVAPURA TOWN - STUYFZAND`S SIGNIFICANT ENVIRONMENT
MAP-13: PANDAVAPURA TOWN - DONEEN`S PERMEABILITY INDEX
ABSTRACT
INTRODUCTION
STUDY AREA
METHODS OF STUDY
RESULTS
TOTAL DISSOLVED SOLIDS
ELECTRICAL CONDUCTIVITY (Micro mhos/cm at 25oC)
SODIUM ADSORPTION RATIO
CORROSIVITY RATIO
HARDNESS
SALINITY SODIUM HAZARD
STUYFZAND'S GROUNDWATER TYPES
STUYFZAND'S GROUNDWATER FACIES
PIPERS SIGNIFICANT ENVIRONMENT
STUYFZAND'S SIGNIFICANT ENVIRONMENT
DONEEN'S PERMEABILITY INDEX
REFERENCES
TABLE 1: CHEMICAL CONSTITUENCY OF GROUNDWATER IN PANDAVAPURA TOWN
MAP-1: LOCATION MAP OF STUDY AREA
MAP-2: PANDAVAPURA TOWN - SAMPLE LOCATIONS FOR CHEMISTRY
MAP-3: PANDAVAPURA TOWN - T.D.S MAP OF PANDAVAPURA TOWN
MAP-4: PANDAVAPURA TOWN - ELECTRICAL CONDUCTIVITY(Ec)
MAP-5: PANDAVAPURA TOWN - SODIUM ABSORPTION RATIO (SAR)
MAP-6: PANDAVAPURA TOWN - CORROSITIVITY RATIO
MAP-7: PANDAVAPURA TOWN - GROUNDWATER HARDNESS
MAP-8: PANDAVAPURA TOWN - SALINITY SODIUM HAZARD
MAP-9: PANDAVAPURA TOWN - STUYFZAND`S GROUNDWATER TYPES
MAP-10: PANDAVAPURA TOWN - STUYFZAND`S GROUNDWATER FACIES
MAP-11: PANDAVAPURA TOWN - PIPES SIGNIFICANT ENVIRONMENT
MAP-12: PANDAVAPURA TOWN - STUYFZAND`S SIGNIFICANT ENVIRONMENT
MAP-13: PANDAVAPURA TOWN - DONEEN`S PERMEABILITY INDEX
| ABSTRACT: |


|
Twenty groundwater samples of Pandavapura town, were analyzed and processed using the HYCH program (developed in the hydrogeology laboratory of the department of geology, Mysore University), and 16 different thematic maps (directly useful for various consumer demands - TDS, Ec, SAR, CR, groundwater hardness, groundwater salinity, sodium hazard, RSC and NO3 and IBE, groundwater types, Stuyfzand's water types and subtypes, Gibbs paleoenvironment, saturation index and environmental characters for academic and research utility) were prepared.
| INTRODUCTION: |
|
Quantity of water without quality has no significance in terms of usage and hence chemical quality of water has gained equal importance with quantity. Groundwater due to its movement in the water bearing formations contains chemical ions and hence never occurs in a pure form. The concentration of chemical ions in groundwater depends on the environment, and surface as well as subsurface rate of percolation.
Hydrogeochemical study involves:
Utilizing the chemical parameters, hydrogeologists can successfully and effectively discuss the suitability of groundwater for domestic, irrigation or industries, its residence time within the water bearing formations, and its corrosive action on the pipelines used for its transport to different consumer points.
| STUDY AREA: |
|
Pandavapura town extending over an area of 534 sq. km is situated towards the western part of Mandya district (Latitude 12o24'40" & 12o24'40" N and Longitude 76o30'0" & 76o47'40" E) [Map.1]. The rock formations here belong to the most ancient age and are classified into two groups - Dharwar Schist (as narrow linear on belts) and peninsular gneisses/granites. The town has semi-arid climate.
|
MONTHS |
SEASONS |
|
December-February |
Dry with clean bright weather |
|
March-May |
Hot |
|
June-October |
Southwest monsoon |
|
November |
Retreating/Post Monsoon |
Average annual rainfall in Mandya district is 691.2mm. It is mostly confined to the period from April to November. The highest rainfall occurs in October. Thundershowers are experienced in the latter half of the hot season. There are on an average, 45 rainy days in the basin. During March-May there is a continuous rise in temperature. April is the hottest month with daily average maximum of 35oC and minimum of 21oC. Relative humidity is high during S-W Monsoon, moderate in the post S-W monsoon and driest during December-May with <50%. The wind condition is generally moderate, southwesterly or westerly from May-September and northeast in October. During March and April winds blow southwest or westerly in the mornings and northeasterly or easterly in the afternoon. From the IMD published data it has been interpolated that the AET, PET and WD in this basin are 80, 160 and 80cm respectively.
| METHODS OF STUDY: |
|
Twenty ground water samples were systematically collected and have been subjected to chemical analysis following the ISI (1964) methods (Map.2).
The ppm ionic concentration data has been fed to the HYCH programme (Balasubramanian et al., 1986) and a thematic map for direct consumer advice is prepared. The salient features are tabulated in Table 1 and the maps are prepared for detailed applications.
| RESULTS: |
|
The samples were analyzed and processed for various parameters and the following thematic maps for direct consumer advice were generated.
| a) TOTAL DISSOLVED SOLIDS: |
|
Based on this premise, water quality could be split in to <500, 500 to 1000, >1000ppm. TDS <500ppm is ideal for any type water usage, 500 to 1000ppm could be used after simple purification processes where as >1000ppm will be difficult to use without costly treatment (Map.3). Higher TDS concentration is due to the stay of water in the subsurface and rock water interaction (Freeze and Cherry 1979).
| b) ELECTRICAL CONDUCTIVITY (Micro mhos/cm at 25oC): |
|
Based on this parameter, groundwater is divided into two zones (Map.4) following the classification of Wilcox L.V. (1948). Ec is a measure of the degree of the mineralization of the water, which is dependent on rock water interaction, and thereby the residence time of the water in the rocks (Eaton, 1950). From Map.4, area of permissible water quality is minimum, followed by the area of doubtful water quality which is large downstream.
|
RANGE |
NO. OF SAMPLES |
|
750-2000 |
16 |
|
2000-3000 |
04 |
|
TOTAL |
20 |
| c) SODIUM ADSORPTION RATIO: |
|
Richards (1954) defined Adsorption Ratio as [(Na/Ca)+(Mg/2)] where all the ionic concentrations are expressed in epm. This has a direct relation to the adsorption of Na by soil. From Table 1 as well as Map.5 it can be seen that almost 98% of the groundwater belongs to excellent quality for irrigation.
|
SAR |
WATER CLASS |
NO. OF SAMPLES |
|
<10 |
Excellent |
19 |
|
10-15 |
Good |
1 |
| d) CORROSIVITY RATIO: |
|
Ryzner (1944) and Badrinath et al (1994) have used an index to evolve the corrosive tendency of groundwater pipes.
Corrosivity Index = 0.028Cl+0.021 S04
0.02(HC03+C03)
where all the ionic values are expressed in ppm. Water with a CR<1 could be transported by metallic pipes and for other waters with an index >1 metallic pipes should be replaced by non-corrosive PVC pipes. It can be noticed in Map. 6 that the upper reaches use metallic pipes for transport of water to consumer ends. Whereas at lower reaches, groundwater has an index >1 and is transported by PVC pipes.
| e) HARDNESS: |
|
Based on Handa (1964) water has been classified with reference to hardness. Both permanent and temporary hard water is present in the ground water samples. From Table 1, it could be visualized that 52% of the samples belong to temporary hard water and 48% belong to permanent hard water (Map.7).
| f) SALINITY SODIUM HAZARD: |
|
This part of Handa's classification refers to the utility of groundwater for irrigation needs. Based on this, water quality could be split in to 3 varieties of salinity sodium hazard units. From C3S2 to C3S1 from Table 1 as well as Map.8 it could be seen that 70% of the water belongs to C3S1 type, followed by C2S1 type (25% of water). Water of this quality is suitable for highly permeable soils, otherwise the crops will be highly affected.
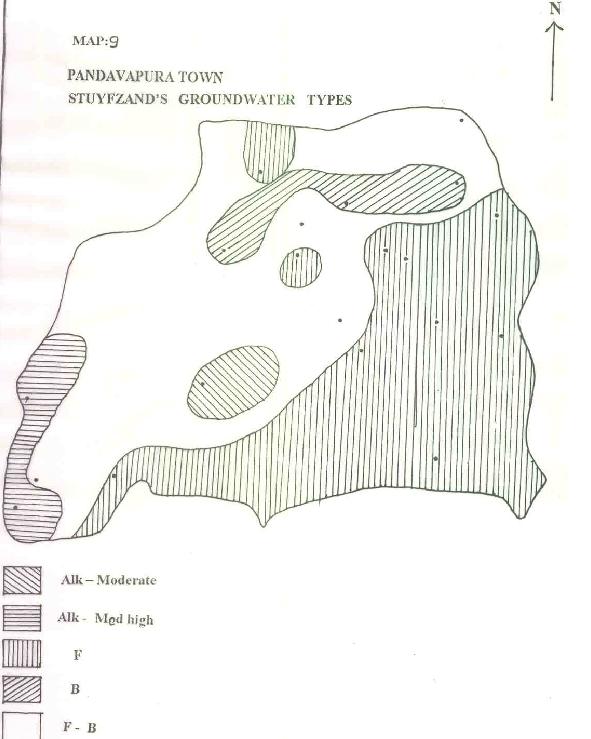
| g) STUYFZAND'S GROUNDWATER TYPES: |
|
Based on this classification, the groundwater of the area is found to be dominated by fresh brackish followed by fresh oligohaline, brackish, medium alkaline and highly alkaline water (Map.9).
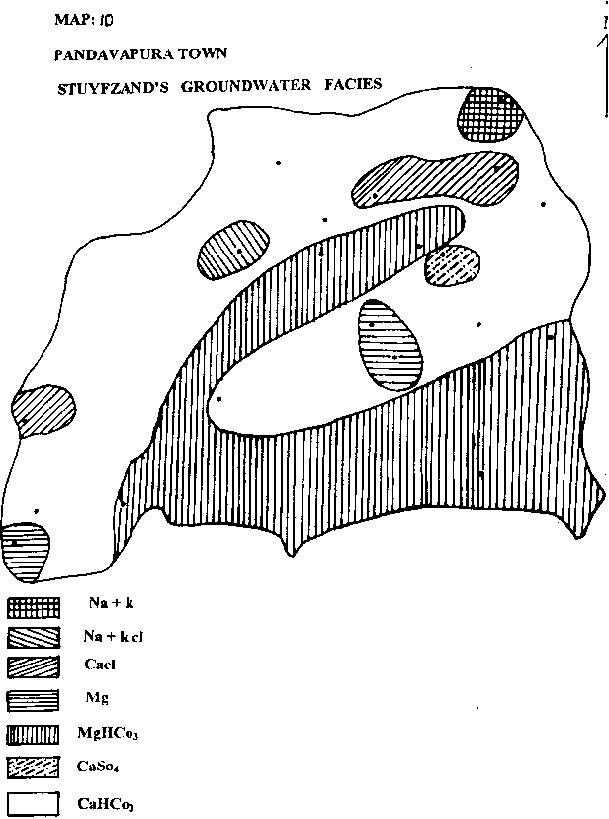
| h) STUYFZAND'S GROUNDWATER FACIES: |
|
Using data for the Stuyfzand's groundwater facies, the area can be classified into area dominated by 40% CaHCo3 and 30% MgHCo3 (Map.10).
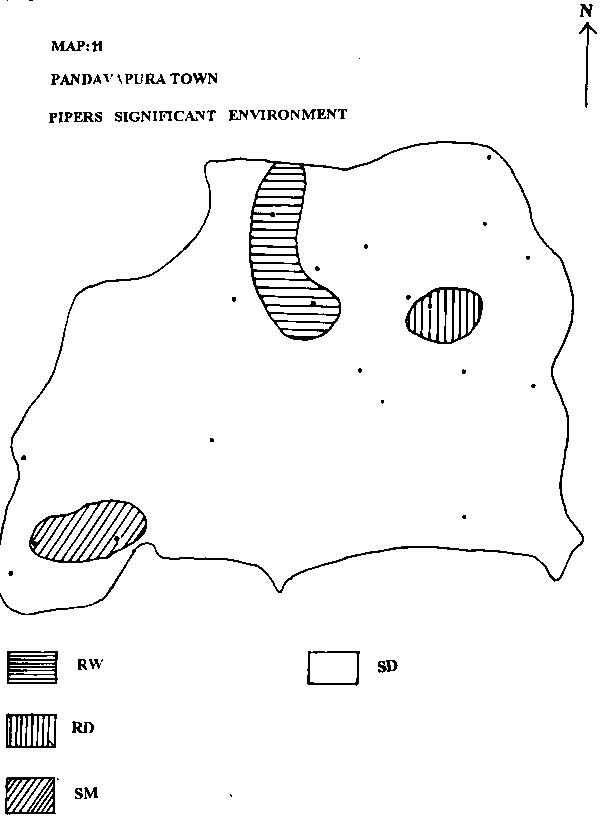
| i) PIPERS SIGNIFICANT ENVIRONMENT: |
|
Based on this classification, the groundwater quality of the area has been dominated by static and disco-ordinate regimes, followed by dissolution and mixing (Map.11).
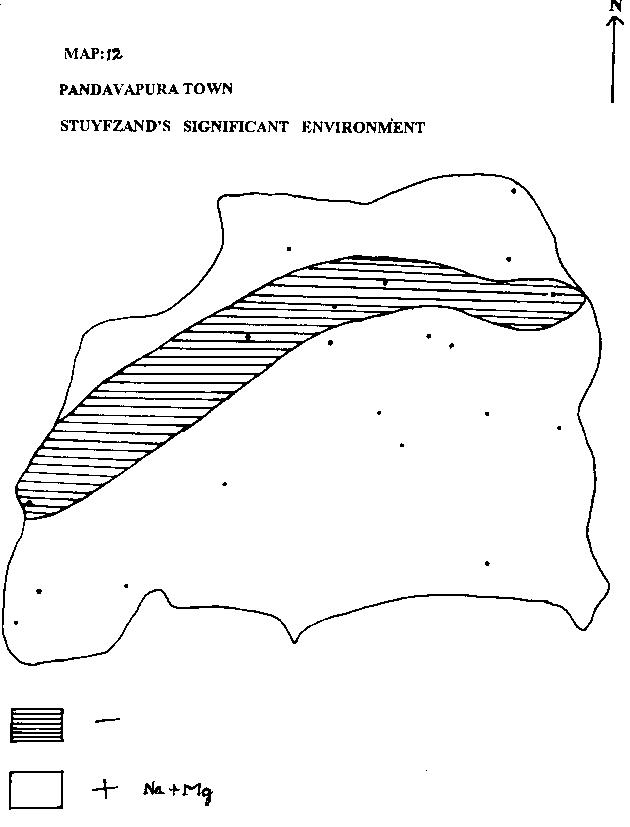
| j) STUYFZAND'S SIGNIFICANT ENVIRONMENT: |
|
From Map.12, it is clear that majority of the water samples collected belong to (+)Na+Mg surplus indicating fresh water intrusion.
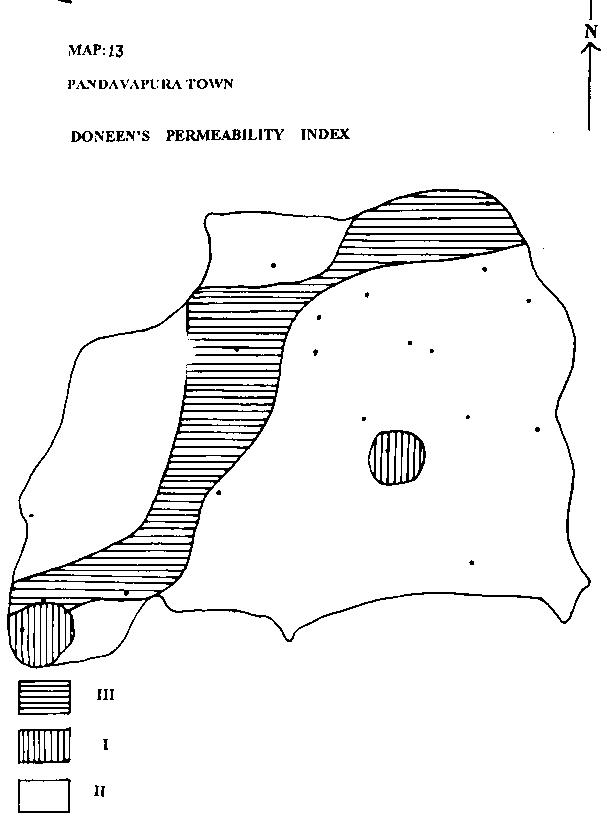
| k) DONEEN'S PERMEABILITY INDEX: |
|
Water is of good quality if permeability index falls into class I, II, III of Doneen's diagram. Majority of water samples falls in class II indicating high permeability horizons.
| REFERENCES: |
|
| TABLE 1: CHEMICAL CONSTITUENCY OF GROUNDWATER IN PANDAVAPURA TOWN |
|
|
SL NO |
LOCATION NAMES |
Ec |
PH |
Ca |
Mg |
Na+K |
HC03 |
C03 |
Cl |
N03 |
S04 |
TDS |
|
1 |
Petrol bunk |
1250 |
7.90 |
105 |
65 |
77 |
377 |
53 |
148 |
71 |
38 |
750 |
|
2 |
Govt. Hospital |
980 |
7.30 |
64 |
38 |
49 |
301 |
7 |
81 |
21 |
33 |
480 |
|
3 |
Bovi colony |
1000 |
8.85 |
36 |
39 |
52 |
191 |
24 |
98 |
31 |
8 |
430 |
|
4 |
Lakshmi theatre |
990 |
8.56 |
51 |
17 |
20 |
137 |
19 |
48 |
31 |
4 |
226 |
|
5 |
Nagamangala road |
2200 |
8.64 |
78 |
15 |
261 |
225 |
48 |
277 |
71 |
110 |
1070 |
|
6 |
Beer Setthalli |
1000 |
8.85 |
136 |
82 |
146 |
328 |
82 |
350 |
40 |
25 |
1019 |
|
7 |
Bus stand |
1200 |
7.20 |
77 |
28 |
63 |
95 |
2 |
87 |
35 |
210 |
730 |
|
8 |
B.D Office |
1098 |
8.21 |
36 |
68 |
21 |
157 |
10 |
148 |
79 |
26 |
525 |
|
9 |
A.C.office |
1700 |
7.40 |
73 |
69 |
114 |
294 |
14 |
168 |
35 |
156 |
800 |
|
10 |
Subramanian temple |
2500 |
8.20 |
190 |
47 |
119 |
416 |
1 |
333 |
88 |
30 |
1076 |
|
11 |
Ganapathi temple |
2200 |
8.30 |
177 |
43 |
106 |
403 |
1.0 |
300 |
76 |
37 |
1116 |
|
12 |
Ragavendra theater |
800 |
8.40 |
59 |
32 |
40 |
294 |
29 |
39 |
26 |
4 |
395 |
|
13 |
Water tank |
2300 |
7.92 |
85 |
21 |
253 |
179 |
48 |
353 |
50 |
6 |
1110 |
|
14 |
Vijaya college |
980 |
7.30 |
35 |
24 |
20 |
203 |
12 |
11 |
7 |
18 |
260 |
|
15 |
Pump house |
1150 |
7.30 |
64 |
17 |
23 |
220 |
1 |
28 |
42 |
11 |
410 |
|
16 |
Harohalli school |
1200 |
7.90 |
26 |
30 |
67 |
232 |
8 |
50 |
40 |
17 |
505 |
|
17 |
Garadimane street |
850 |
7.40 |
25 |
7 |
39 |
140 |
6 |
25 |
12 |
10 |
274 |
|
18 |
Marigudi temple |
1155 |
8.02 |
50 |
59 |
24 |
240 |
8 |
109 |
40 |
26 |
625 |
|
19 |
Harohalli kere |
2200 |
8.20 |
190 |
47 |
121 |
410 |
6 |
03 |
49 |
98 |
60 |
|
20 |
Pandavapura town |
1000 |
7.70 |
180 |
43 |
119 |
320 |
8 |
8 |
210 |
100 |
30 |
| MAP-1: LOCATION MAP OF STUDY AREA |
|
| MAP-2: PANDAVAPURA TOWN - SAMPLE LOCATIONS FOR CHEMISTRY |
|
| MAP-3: PANDAVAPURA TOWN - T.D.S MAP OF PANDAVAPURA TOWN |
|
| MAP-4: PANDAVAPURA TOWN - ELECTRICAL CONDUCTIVITY(Ec) |
|
| MAP-5: PANDAVAPURA TOWN - SODIUM ABSORPTION RATIO (SAR) |
|
| MAP-6: PANDAVAPURA TOWN - CORROSITIVITY RATIO |
|
| MAP-7: PANDAVAPURA TOWN - GROUNDWATER HARDNESS |
|
| MAP-8: PANDAVAPURA TOWN - SALINITY SODIUM HAZARD |
|
| MAP-9: PANDAVAPURA TOWN - STUYFZAND`S GROUNDWATER TYPES |
|
| MAP-10: PANDAVAPURA TOWN - STUYFZAND`S GROUNDWATER FACIES |
|
| MAP-11: PANDAVAPURA TOWN - PIPES SIGNIFICANT ENVIRONMENT |
|
| MAP-12: PANDAVAPURA TOWN - STUYFZAND`S SIGNIFICANT ENVIRONMENT |
|
| MAP-13: PANDAVAPURA TOWN - DONEEN`S PERMEABILITY INDEX |
|
| ADDRESS: |
|
1.) P.E.S College of Engineering,
Mandya-571401
2.) Hydrogeology Laboratory,
Department of Geology,
Manasagangotri,
Mysore-570006
|
|
|