
|

|

|

GEOLOGICAL CONTROL ON GROUND WATER QUALITY IN YELANDUR TALUK IN KARNATAKA
H.S. Mahadeswara1, D. Nagaraju1 and S.A. Sajid1

|
|
|
|
 ABSTRACT
INTRODUCTION
LOCATION AND MORPHOLOGY
HYDROGEOLOGY
METHODOLOGY
RESULTS AND DISCUSSION:-1. GROUNDWATER TYPES
ELECTRICAL CONDUCTIVITY
TOTAL DISSOLVED SOLIDS (TDS)
GROUNDWATER HARDNESS
GROUNDWATER SALINITY - SODIUM HAZARD
PERMEABILITY INDEX (PI)
NITRATES
SUGGESTIONS
REFERENCES
TABLE 1: CHEMICAL CONSTITUENTS OF GROUNDWATER IN YELANDUR TALUK
TABLE 2: CLASSIFICATION OF WELLS ACCORDING TO ELECTRICAL CONDUCTIVITY
MAP-1: LOCATION OF STUDY AREA
MAP-2: YELANDUR TALUK CHAMARAJ NAGAR DISTRICT
MAP-3: ELECTRICAL CONDUCTIVITY
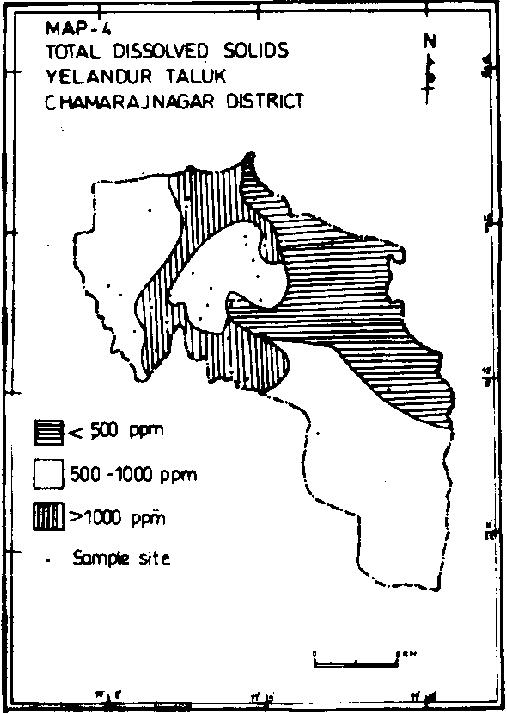
MAP-4: TOTAL DISSOLVED SOLIDS YELANDUR TALUK CHAMARAJNAGAR DISTRICT
MAP-5: GROUNDWATER HARDNESS YELANDUR TALUK CHAMRAJNAGAR DISTRICT
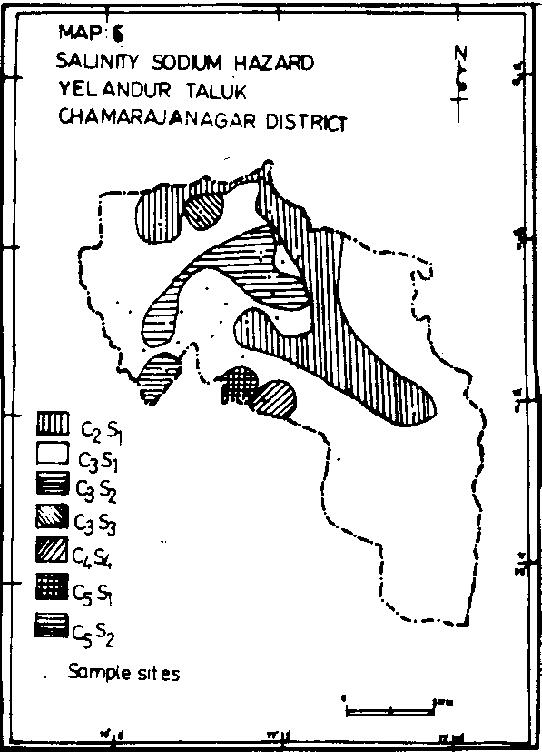
MAP-6: SALINITY SODIUM HAZARD YELANDUR TALUK CHAMRAJNAGAR DISTRICT
MAP-7: PERMEABILITY INDEX (DONEENS 1948) YELANDUR TALUK CHAMRAJNAGAR DISTRICT
ABSTRACT
INTRODUCTION
LOCATION AND MORPHOLOGY
HYDROGEOLOGY
METHODOLOGY
RESULTS AND DISCUSSION:-1. GROUNDWATER TYPES
ELECTRICAL CONDUCTIVITY
TOTAL DISSOLVED SOLIDS (TDS)
GROUNDWATER HARDNESS
GROUNDWATER SALINITY - SODIUM HAZARD
PERMEABILITY INDEX (PI)
NITRATES
SUGGESTIONS
REFERENCES
TABLE 1: CHEMICAL CONSTITUENTS OF GROUNDWATER IN YELANDUR TALUK
TABLE 2: CLASSIFICATION OF WELLS ACCORDING TO ELECTRICAL CONDUCTIVITY
MAP-1: LOCATION OF STUDY AREA
MAP-2: YELANDUR TALUK CHAMARAJ NAGAR DISTRICT
MAP-3: ELECTRICAL CONDUCTIVITY
MAP-4: TOTAL DISSOLVED SOLIDS YELANDUR TALUK CHAMARAJNAGAR DISTRICT
MAP-5: GROUNDWATER HARDNESS YELANDUR TALUK CHAMRAJNAGAR DISTRICT
MAP-6: SALINITY SODIUM HAZARD YELANDUR TALUK CHAMRAJNAGAR DISTRICT
MAP-7: PERMEABILITY INDEX (DONEENS 1948) YELANDUR TALUK CHAMRAJNAGAR DISTRICT
| ABSTRACT: |


|
Groundwater is generally presumed to be good for human consumption and is used as a potential source of drinking water. There is a growing realisation of the importance of protecting groundwater for its beneficial uses such as drinking, irrigation and industrial supply. Agricultural development, urbanisation and industrialization are the major causes for all changes in the quality of water. The chemical quality of groundwater of Yelandur taluk has been studied in detail in order to demonstrate the potable groundwater zones without any deterioration by pollution. The area is mainly composed of metamorphic gneisses. The groundwater occurs in the weathered and fractured zones, under unconfined and semiconfined conditions.
Thirty-one groundwater samples have been collected and analysed to determine the major ions and quality parameters. A simple computer programme HYCH in BASIC language (Balasubramanian et al., 1991) has been used to determine several important quality parameters and ratios. These have been classified into three general categories as 1) desirable, 2) permissible and 3) not permissible, based on ISI (1983) specifications for drinking purpose. The study concludes that in the rapidly growing urban environment, groundwater quality gets completely deteriorated due to human activities and the absence of proper sewage systems. Once the quality of groundwater is modified, it is very difficult and expensive for all urban dwellers to treat the water again before using it.
| INTRODUCTION: |
|
Majority of the urban and rural population in Karnataka State depends mainly on groundwater for drinking and domestic use. Groundwater is expected to be of excellent microbiological quality and generally of adequate chemical quality for drinking and domestic consumption. Groundwater pollution resulting from land disposal of untreated liquid and solid wastes has become a serious problem in India (Bhide, 1990).
In recent years, due to an unpredictable increase in the population and settlements, surface water supply has become very limited and remote. This has resulted in increasing exploitation of groundwater. There are several extension activities that cause concern to the public and will have a detrimental reversible impact, if improperly managed. Complaints to several local bodies regarding the quality of groundwater highlight the necessity for investigation to find its suitability for consumption. In this context, a study was taken up with an objective of examining the chemical quality of groundwater and to determine its suitability for drinking and domestic consumption.
| LOCATION AND MORPHOLOGY: |
|
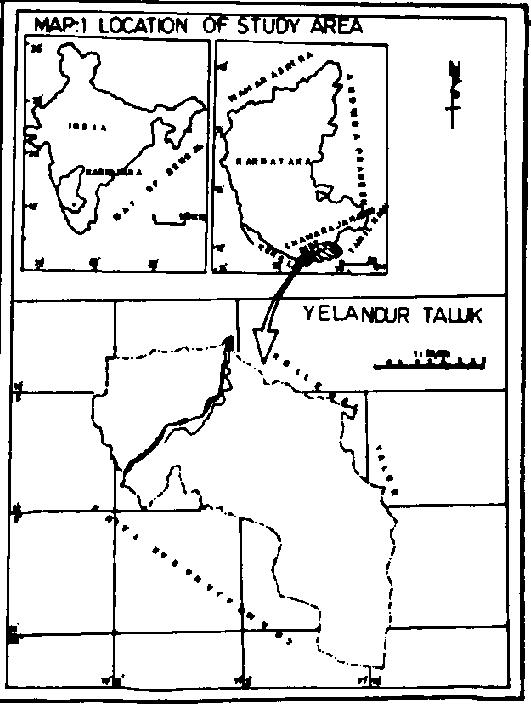
Yelandur taluk is located between 110 42'-1205' North latitude and 76057'-770 09' East longitude with an area of 264.7 sq. km comprising a population of about 70000. The topography is generally undulating with few steep slopes. Southern and Northern parts have comparatively gentle slopes. The normal annual rainfall is between 620-1140 cm (Map.1).
| HYDROGEOLOGY: |
|
The study area comprises metamorphic gneisses, charnockites, pegmatites and dolerite intrusions, overlaid by different soils and aluminum. The area is divided into two equal halves in the NE-SW direction by the contact of the charnockites lying in the eastern part of the area with the gneisses in the western part. The thickness of weathered zone ranges from 3 m to 20 m followed by a deep fracture zone. Groundwater occurs under unconfined and semi-confined conditions. As there are more undulations in the surface topography and severe heterogeneity in aquifer parameters, the groundwater potential zones are very limited (Tamata, 1990).
Rainfall is the main source of replenishment to the groundwater storage. The depth of the groundwater table is from 6 m to 20 m.
| METHODOLOGY: |
|
Thirty one groundwater samples (Map 2) have been collected from the existing borewells located in the area and have been analysed by following the standard methods of water analysis (ISI, 1964).
A basic computer programme - HYCH (Balasubramanian, 1991) developed in the hydrogeology laboratory at Mysore University has been utilised in this study. The computer program can perform the following jobs, once the parts per million concentration data of any groundwater is fed:
The evaluation of the suitability of groundwater for drinking purpose, based on either individual or gross ionic concentration, has been attempted based on the drinking water specification provided by the Bureau of Indian Standards (1983). Table I gives the ppm concentration of individual constituents, groundwater, hardness, electrical conductance and pH of the groundwater. Map 2 gives sampling locations.
Increased emphasis on governmental policies in the environmental protection of natural resources has led to many rigorous investigations of the pollutant levels in soil and groundwater. It could be possible to assess the degree of contamination in dry domain of the environment only, when the natural background values are available for comparison with the threshold values (Bhatia et al., 1999).
It is noticed that in some countries, contamination due to anthropogenic activities has reached such an extent that it is no longer possible to measure the true background concentrations even in hard rock groundwater.
|
RESULTS AND DISCUSSION:
1. GROUNDWATER TYPES: |
|
The chemical classification of the water as determined by Handa (1964 a) has shown that the majority of water samples were hard (non-carbonate), had medium to high salinity and low sodium percentage. The first and foremost waters are those in which
r -CO3 > r SO4 - Type I
As the residence time of the water increases the relation changes to
r SO4 > r Cl - Type II
with increase in residence time the chemistry changes to
r Cl > r SO4 > r CO3 - Type III
and in the final stages the concentration reaches
r Cl > r SO4 > r CO3 and
r Na > r Mg > r Ca - Type IV
(Where r is the epm content of the different ions)
The change of water from I to IV is attributed to the relative residence time in the aquifer and extent of rock interactions.
| 2. ELECTRICAL CONDUCTIVITY: |
|
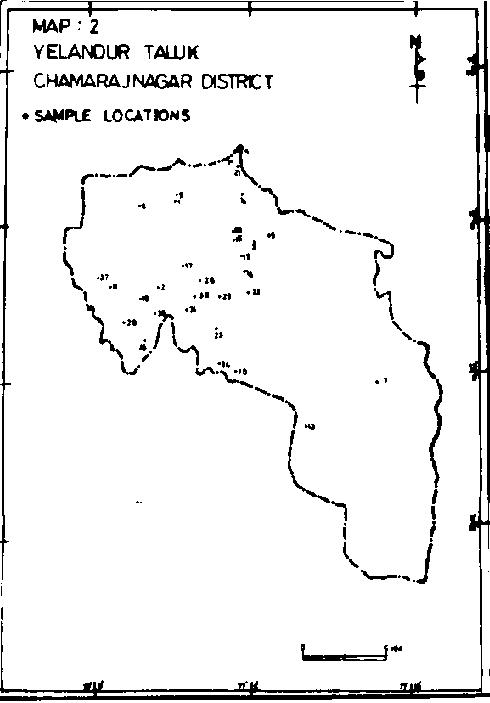
Ec is an index of the amount of minerals present and it varies with temperature (Map 3). Wilcox (1948) classified the utility of groundwater for irrigation purposes based on Ec. The area could be divided into 3 horizons with stray pockets of high values of conductivity (>200). Horizon with an Ec of 750-2000 mhos/cm at 25�C constitute major pocket and the balance has an Ec with 250-750 micro mhos/cm at 25�C (third horizon).
Depending on the conductivity, water can be classified as excellent, good, permissible, brackish and saline. A classification on this basis is given in Table-2. There is only one well, which falls in the excellent class, and 12 wells fall in the permissible category. Nine wells have saline water while the remaining wells are brackish.
| 3. TOTAL DISSOLVED SOLIDS (TDS): |
|
Based on TDS, groundwater has been classified for various uses like general, household, drinking, irrigation and industry using the proposed concentration limits. The area could then be divided into 3 horizons as shown in Map 4 (TDS < 500, 500-1000, and > 1000 ppm). Majority of observed wells has TDS < 500 ppm followed by 500 to 1000. Groundwater during its movement in the subsurface slowly increases in the TDS concentrations. It has been noticed by Freeze and Cherry (1979) that shallow groundwater in the recharge areas has lower TDS than that in discharge areas. Higher concentration of TDS indicates (i) a longer stay of groundwater in the water bearing formation and (ii) the dissolution coefficient of the minerals present in the rock are high and hence gives a higher dissolved solids concentration.
| 4. GROUNDWATER HARDNESS: |
|
Based on this parameter, groundwater in these locations gets classified into two major zones (Map 5): (i) water with temporary hardness (B1, B2 and B3) and (ii) water with permanent hardness (A1 and A2) (Ryzner, 1994). It is found that water belonging to temporary hardness occupies a major part of the taluk and there is a gradual change of hardness from temporary to permanent, depending on the time of residence of groundwater in the subsurface.
| 5. GROUNDWATER SALINITY - SODIUM HAZARD: |
|
Based on the degree of salinity and sodium hazard (Map 6) the groundwater of this taluk is divided into 6 horizons (C2S1, C3S1, C3S2, C3S3, C4S3 and C5S3) with C3S1 occupying the major areal extent. Among these all the waters up to C3 type could be used to some extent for salt tolerant crops and the extreme salinity class C5 is not suitable for any crop cultivation. Similarly, S2 category water is suitable for permeable coarse-grained soils and S3 type is suitable for soils with good drainage.
| 6. PERMEABILITY INDEX (PI): |
|
The permeability index (PI) using epm Ionic values
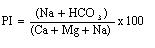
Map. 7 lists permeability index (PI) at various locations. Based on this, the study region could be divided in to three classes. Water is of good quality if PI falls in class I or II. Higher the PI, lower is the permeability of the soil. Majority of the area has PI belonging to class III indicating very low permeability soils.
| 7. NITRATES: |
|
The main sources of nitrate are due to either natural or anthropogenic activities - rainfall and dry fall out, soil nitrogen, nitrate deposit, sewage, septic tank and animal waste, manure or compost, green manure and plant residues, atmospheric nitrogen fixation, fertilizer nitrogen from irrigated overflow water outlets and industrial effluent (Ternamche, 1991).
Nitrate is the end product of oxidation of nitrogen in the environment. Higher level of nitrate concentrations is an indication of pollution from either sewage or agricultural fertilizer waste. It is beyond doubt, an essential plant nutrient, but at the same time a potential threat to human health when present in excess concentrations in the drinking water (Bulusu and Pande, 1990).
The potential sources of nitrate in groundwater are due to decomposition of soil organic matter, leaching of soluble synthetic or chemical fertilizers particularly N-fertilizers, and human and animal excreta. Apart from these, untreated effluents of nitrogenous industries also contribute significantly to an increase in the nitrate concentrations (Kakkar, 1990).
Sample analyses indicate that except in two places (Gangawadi and Changachahalli > 72), majority of the area has nitrate < 40 mg/l.
| SUGGESTIONS: |
|
1. This study emphasises the need for periodical monitoring of borewell water to assess its suitability for drinking purposes.
2. Serious health effects are associated with excess nitrate in water and therefore the water supply authority in association with public departments should create awareness among the people about the importance in maintaining the surrounding localities (to maintain the quality of groundwater) from public health point of view.
3. Periodic maintenance and cleaning of the borewells and the water supply systems should be done to avoid encrustation.
4. Disposal of solid waste in an environmentally sound way to avoid leaching, etc.
5. Leakage from underground and open drain system should be stopped.
| REFERENCES: |
|
| TABLE 1: CHEMICAL CONSTITUENTS OF GROUNDWATER IN YELANDUR TALUK |
|
|
Sampling Site |
Ca |
Mg |
Na/K |
HCO3 |
CO3 |
Cl |
NO3 |
SO4 |
TDS |
Ec |
|
Malligahally |
44.0 |
52.0 |
471.0 |
544.0 |
186.0 |
389.0 |
19.0 |
88.0 |
1375 |
2325.0 |
|
Yeriyur |
63.0 |
50.0 |
150.0 |
400.0 |
60.0 |
150.0 |
20.0 |
60.0 |
780 |
1390.0 |
|
Agara |
40.0 |
21.0 |
144.0 |
392.0 |
24.0 |
56.0 |
0.0 |
32.0 |
570 |
860.0 |
|
Mambally |
60.0 |
20.0 |
60.0 |
350.0 |
0.0 |
30.0 |
5.0 |
10.0 |
400 |
550.0 |
|
Dasanahally |
20.0 |
24.0 |
118.0 |
420.0 |
0.0 |
32.0 |
12.0 |
38.0 |
450 |
703.0 |
|
Kesturu |
29.0 |
25.0 |
119.0 |
421.0 |
0.0 |
30.0 |
11.0 |
36.0 |
480 |
740.0 |
|
B.R.Hills |
46.0 |
43.0 |
48.0 |
372.0 |
10.0 |
20.0 |
8.0 |
14.0 |
389 |
296.0 |
|
Agrahara |
93.0 |
84.0 |
187.0 |
490.0 |
43.0 |
280.0 |
13.0 |
100.0 |
1075 |
1850.0 |
|
Basavapura |
34.0 |
44.0 |
424.0 |
735.0 |
38.0 |
269.0 |
9.0 |
120.0 |
1375 |
2150.0 |
|
Kalanahundi |
0.0 |
61.0 |
600.0 |
784.0 |
43.0 |
440.0 |
9.0 |
215.0 |
8090 |
3000.0 |
|
Duggahatti |
39.0 |
26.0 |
151.0 |
350.0 |
50.0 |
70.0 |
20.0 |
21.0 |
578 |
850.0 |
|
Mayarapalya |
39.0 |
72.0 |
220.0 |
600.0 |
70.0 |
160.0 |
23.0 |
35.0 |
956 |
1400.0 |
|
Devanahally |
40.0 |
29.0 |
161.0 |
382.0 |
58.0 |
73.0 |
22.0 |
24.0 |
590 |
900.0 |
|
Hosur |
26.0 |
18.0 |
125.0 |
279.0 |
86.0 |
17.0 |
5.0 |
10.0 |
390 |
550.0 |
|
Buditittu |
48.0 |
43.0 |
203.0 |
603.0 |
53.0 |
87.0 |
9.0 |
26.0 |
800 |
1100.0 |
|
Gowdahally |
38.0 |
75.0 |
227.0 |
608.0 |
72.0 |
162.0 |
20.0 |
36.0 |
956 |
1500.0 |
|
Chamalapura |
69.0 |
66.0 |
123.0 |
461.0 |
38.0 |
151.0 |
9.0 |
52.0 |
775 |
1150.0 |
|
Avalakandalli |
50.0 |
52.0 |
321.0 |
794.0 |
14.0 |
134.0 |
18.0 |
150.0 |
1.220 |
1625.0 |
|
Maddur |
48.0 |
32.0 |
223.0 |
583.0 |
38.0 |
81.0 |
11.0 |
70.0 |
865 |
1100.0 |
|
Ambale |
117.0 |
27.0 |
180.0 |
603.0 |
19.0 |
95.0 |
0.0 |
120.0 |
930 |
1250.0 |
|
Bannisarge |
18.0 |
19.0 |
143.0 |
270.0 |
53.0 |
31.0 |
19.0 |
50.0 |
500 |
590.0 |
|
Vaddegere |
35.0 |
34.0 |
160.0 |
524.0 |
0.0 |
42.0 |
25.0 |
50.0 |
675 |
870.0 |
|
Yeragamballi |
98.0 |
102.0 |
157.0 |
647.0 |
0.0 |
235.0 |
44.0 |
98.0 |
1150 |
1800.0 |
|
Gangavadi |
715.0 |
152.0 |
325.0 |
676.0 |
0.0 |
1425.0 |
72.0 |
400.0 |
3540 |
6000.0 |
|
Changachahalli |
713.0 |
150.0 |
320.0 |
670.0 |
0.0 |
1420.0 |
70.0 |
390.0 |
3560 |
5090.0 |
|
Yelandur |
120.0 |
76.0 |
196.0 |
559 |
24.0 |
294.0 |
0.0 |
120.0 |
1170 |
1750.0 |
|
Mellahalli |
48.0 |
68.0 |
162.0 |
480.0 |
39.0 |
137.0 |
26.0 |
100.0 |
840 |
1500.0 |
|
Ganiganur |
96.0 |
100.0 |
150.0 |
640.0 |
0.0 |
230.0 |
40.0 |
96.0 |
1140 |
1798.0 |
|
Komaranapura |
65.0 |
20.0 |
68.0 |
360.0 |
0.0 |
30.0 |
6.0 |
18.0 |
400 |
550.0 |
|
Krishnapura |
66.0 |
59.0 |
157.0 |
412.0 |
62.0 |
154.0 |
26.0 |
65.0 |
800 |
1350.0 |
|
Gumballi |
32.0 |
58.0 |
101.0 |
429.0 |
34.0 |
67.0 |
13.0 |
25.0 |
575 |
840.0 |
| TABLE 2: CLASSIFICATION OF WELLS ACCORDING TO ELECTRICAL CONDUCTIVITY |
|
|
Range of electrical conductivity in micro mhos/cm at 250C |
Quality |
Well Numbers |
Total Number of Wells |
|
0-333 |
Excellent |
7 |
01 |
|
333-500 |
Good |
- |
- |
|
500-1000 |
Permissible |
3, 4, 5, 6, 11, 13, 14, 21, 22, 23, 29, 31. |
12 |
|
1000-1500 |
Brackish |
2, 12, 15, 17, 19, 20, 26, 27, 30. |
09 |
|
1500-10,000 |
Saline |
1, 8, 9, 10, 16, 18, 24, 25, 28. |
09 |
| MAP-1: LOCATION OF STUDY AREA |
|
| MAP-2: YELANDUR TALUK CHAMARAJ NAGAR DISTRICT |
|
| MAP-3: ELECTRICAL CONDUCTIVITY |
|
| MAP-4: TOTAL DISSOLVED SOLIDS YELANDUR TALUK CHAMARAJNAGAR DISTRICT |
|
| MAP-5: GROUNDWATER HARDNESS YELANDUR TALUK CHAMRAJNAGAR DISTRICT |
|

| MAP-6: SALINITY SODIUM HAZARD YELANDUR TALUK CHAMRAJNAGAR DISTRICT |
|
| MAP-7: PERMEABILITY INDEX (DONEENS 1948) YELANDUR TALUK CHAMRAJNAGAR DISTRICT |
|

| ADDRESS: |
|
1.) Hydrogeology Laboratory,
Department of Geology,
Manasagangothri,
Mysore-570 006. Karnataka,
India.
|
|
|