
|

|

|

GROUNDWATER POTENTIAL ESTIMATION - A COMPARATIVE ANALYSIS
S. Mohan1 and V. Ramani Bai2

|
|
|
|
 ABSTRACT
INTRODUCTION
EARLIER WORKS:
STUDY AREA
ESTIMATION OF GROUNDWATER RECHARGE
RECHARGE BY FLUCTUATION IN MONSOON SEASON
RECHARGE BY YEARLY WATER LEVEL FLUCTUATION
RECHARGE BY TEN YEAR FLUCTUATION
RECHARGE BY AVERAGE OF TEN YEAR FLUCTUATION
RESULTS AND DISCUSSION
CONCLUSIONS
ACKNOWLEDGEMENT
REFERENCES
TABLE 1: RECHARGE BY FLUCTUATION IN MONSOON SEASON
TABLE 2: RECHARGE BY YEARLY WATER LEVEL FLUCTUATION
TABLE 3: RECHARGE BY WATER LEVEL DIFFERENCE OVER TEN YEARS
TABLE 4: RECHARGE BY AVERAGE W.L DIFFERENCE OVER TEN YEARS
TABLE 5: THE COMPARISON OF RESULTS
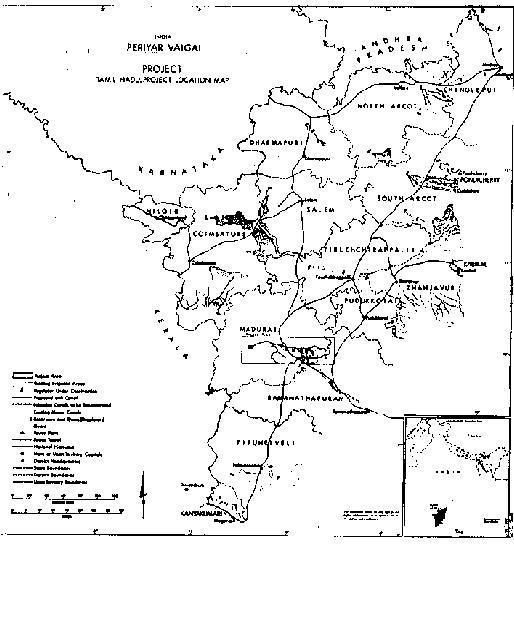
FIGURE-1: TAMIL NADU PROJECT LOCATION MAP
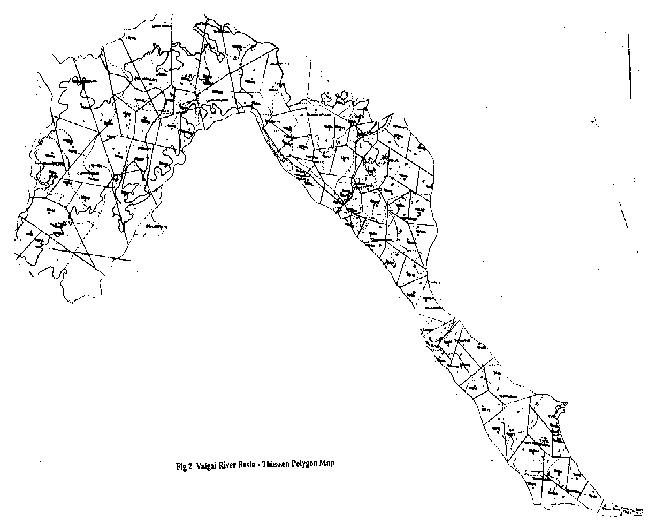
FIGURE-2: VALGAI RIVER BASIN - THIESSEN POLYGON MAP
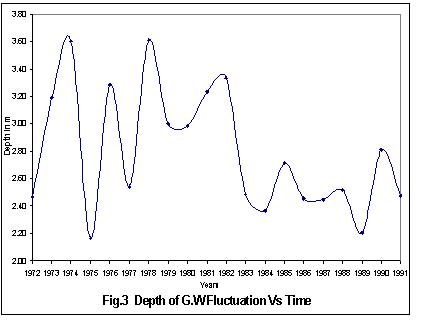
FIGURE-3: DEPTH OF GWFLUCTUATION Vs TIME
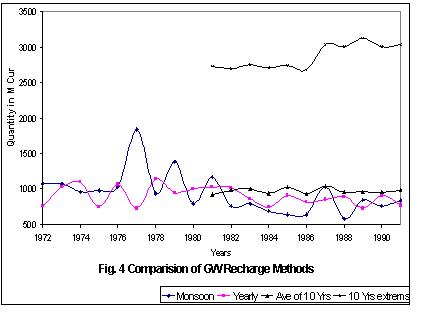
FIGURE-4: COMPARISION OF GW RECHARGE METHODS
FIGURE-5: ZONE WISE RECHARGE POTENTIAL
ABSTRACT
INTRODUCTION
EARLIER WORKS:
STUDY AREA
ESTIMATION OF GROUNDWATER RECHARGE
RECHARGE BY FLUCTUATION IN MONSOON SEASON
RECHARGE BY YEARLY WATER LEVEL FLUCTUATION
RECHARGE BY TEN YEAR FLUCTUATION
RECHARGE BY AVERAGE OF TEN YEAR FLUCTUATION
RESULTS AND DISCUSSION
CONCLUSIONS
ACKNOWLEDGEMENT
REFERENCES
TABLE 1: RECHARGE BY FLUCTUATION IN MONSOON SEASON
TABLE 2: RECHARGE BY YEARLY WATER LEVEL FLUCTUATION
TABLE 3: RECHARGE BY WATER LEVEL DIFFERENCE OVER TEN YEARS
TABLE 4: RECHARGE BY AVERAGE W.L DIFFERENCE OVER TEN YEARS
TABLE 5: THE COMPARISON OF RESULTS
FIGURE-1: TAMIL NADU PROJECT LOCATION MAP
FIGURE-2: VALGAI RIVER BASIN - THIESSEN POLYGON MAP
FIGURE-3: DEPTH OF GWFLUCTUATION Vs TIME
FIGURE-4: COMPARISION OF GW RECHARGE METHODS
FIGURE-5: ZONE WISE RECHARGE POTENTIAL
| ABSTRACT: |


|
With the increase in demand for water for competing uses, it is difficult to meet the entire demand from a single source and it is a challenge to plan and manage the different water resources. Among the two major water resources, surface and ground water, it is the ground water resource, which needs to be managed carefully, especially in drought prone areas. The hydro-geological features such as sub-soil structure, rock formation, lithology and location of water play a crucial role in determining the potential of water storage in groundwater reservoirs. To assess the groundwater potential, a suitable and accurate technique is required for a meaningful and objective analysis. A critical study is carried out on the different methods of estimating the groundwater potential and compared to arrive at the most suitable technique for practical utility. In this work, four methods of estimating groundwater recharge were studied viz., yearly water level fluctuation, ten year average water level fluctuation, fluctuation between the lowest and highest water levels over ten years and fluctuation in monsoon seasons. The results of this study help in accurate prediction of groundwater availability, which in turn may avoid groundwater over exploitation and help restore the aquatic eco-systems.
| INTRODUCTION: |
|
Groundwater was the major source for irrigation prior to the introduction of canal irrigation system. Water contained in the voids of the geologic materials that comprise the crust of the earth is the groundwater. It exists at a pressure greater than or equal to atmospheric pressure. The experimental and mathematical methods required for analyses are distinctly different as it is exploited and used in human affairs in different ways. The important hydrogeological parameters such as porosity and hydraulic conductivity of the geologic stratum determine the performance of the aquifer. Added to this, an important factor is the length of data considered for predicting the groundwater potential. Thus, with adequate length of the database, the prediction of any derived model will reproduce the statistical properties. Otherwise, it is difficult to predict the regional groundwater flow conditions, subject to measurable hydrological, hydrogeological and meteorological variables in nature. As it is largely uncertain in nature, this cannot be left in isolation.
Hence, it prompts the importance of understanding and estimating the regional groundwater flow regime. This article presents the methods of estimation of groundwater recharge on a 250 km long reach of the Vaigai river in southern part of Tamil Nadu. The approach specially accounts for the different time periods for the estimation of recharge potential of the aquifer. A comparative evaluation is made on these methods.
| EARLIER WORKS: |
|
Different methods were proposed and many authors reviewed several applications on this problem. Rushton and Rathod (1985) have determined the velocity components from information about the groundwater-head distribution, groundwater potential, confined and unconfined aquifers; time-variant behaviour of aquifer and hydraulic conductivity. Mathematical models have been developed by Serrano and Unny (1987) as an innovative approach to the solution of groundwater forecasting problems considering the uncertainty generated by the use of data subject to environmental fluctuations and measurement errors. They have described in detail the development, solution and validation of two mathematical models describing groundwater potential at the Twin lake aquifer. Sondhi et.al. (1989) have determined the available additional groundwater potential and its distribution in the project area; estimation of groundwater recharge from the water conveyance and distribution system and the annual water balance of the project; 'recharge distribution coefficients' are done using digital simulation models. Chiew and McMahon (1990) estimated groundwater recharge using surface watershed modeling approach for both irrigated and non-irrigated areas. In all the above cases, they have not seen which time period will give appropriate prediction over the recharge value of a basin area. Uma and Kehinde (1992) described the analysis of the baseflow characteristics of numerous small basins to estimate the groundwater in the basins. Boonstra and Bhutta (1996) have worked on determination of seasonal net recharge considering temporal and areal recharge variations, geometry of aquifer system, historical water table elevations, drainage design and waterlogged areas, and developed numerical models for monsoon estimates, water-balance, and return period. A similar attempt is made here for estimating the ground water recharge potential of a river basin.
| STUDY AREA: |
|
The study area Vaigai (N 9o 15'-- 10o 20' and E 77o 10' - 79o 15') is located in south of Tamil Nadu in India (Fig. 1). The river basin is underlined by a weathered aquifer, phreatic to semi confined aquifer in the alluvium and valley fills in the crystalline rock formation and semi confined to confined aquifer conditions in the sedimentary formations.
The total area of Vaigai river basin is 7031 sq.km. The net area irrigated by canals and system tanks accounts for 1613.23 sq.km. and non-system tanks irrigate 466.5 sq.km. The depth of aquifer varies from 7 to 22 m. The water level fluctuation in this zone varies from 2 to 15 m.
The geology of the site consists of charnockites and khondalites of archaean age, the two main rock types encountered. Charnockites include acid charnockite and related migmatites with bands of basic granulite and magnetite, and quartzite. The khondalite group of rocks consists of crystalline limestone, calc-gneiss, hornblende and biotite gneiss and related migmatites with bands of quartzite. Sedimentary rocks (of upper Gondwana age) consist of micaceous sandstone, limestone alternating shale and grits and river and coastal alluvium. Laterites of sub recent age are in localised pockets. Monthly ground water level data in 99 control wells of the basin, for a period 1971-1992, are used in this study.
| ESTIMATION OF GROUNDWATER RECHARGE: |
|
The commonly used method for estimating groundwater storage available annually is based on
Q = (Area) x (Depth of fluctuation in Groundwater Table) x (Specific Yield) (1)
In the above equation, the depth of fluctuation in groundwater table or the drop in groundwater table has to be calculated by taking the duration over which the fluctuation occurs.
The area in equation (1) is the area of influence of the well in the basin. This is obtained by Thiessen Polygon Method (Fig 2). By this method, the watershed area is subdivided into polygonal sub areas using the wells as nodes. The Thiessen polygon around each well permits the assignment of weights on the basis of the relative areas of the respective polygons. The sub areas are used as weights in estimating the average depth of fluctuation for each well.
The dynamic reserve has been computed by measuring the net change in storage of the phreatic aquifer. The storage of the groundwater in the aquifer is dependent upon the input components such as precipitation; seepage and return flow of irrigated water during various seasons.
The fluctuation of groundwater depth over the study period is analysed and plotted as shown in Fig. 3, to understand the behaviour of the aquifer. High variations in annual recharges to groundwater body are observed between monsoons. To avoid compilation in the estimation and management of these replenishable resources due to variation in the annual recharge, quantification of optimum dynamic part of the groundwater resource is adopted in the dynamic groundwater reserve estimation.
| RECHARGE BY FLUCTUATION IN MONSOON SEASON |
|
The determination of groundwater recharge (in a minimum period of monsoon variations) in the basin was done first. The difference between the highest and lowest water levels is calculated during the monsoon period and the equation (1) is used to estimate the recharge in the basin. This is repeated for all five zones (in the basin) using 20 years of water level data (1972 to 1991). The estimated quantity of recharge is listed in Table 1.
| RECHARGE BY YEARLY WATER LEVEL FLUCTUATION |
|
In this method, the fluctuation of groundwater level is taken as the difference between the highest level (of the second season) and the lowest (of the first season in a year) and the equation (1) is used for estimating the recharge values for 20 years from 1972 to 1991. Zonewise recharge quantity is calculated and is tabulated in Table 2.
| RECHARGE BY TEN YEAR FLUCTUATION |
|
The study is further extended for a long span of water level fluctuations in the aquifer. Here, the depth of fluctuation is taken as difference between the highest level (of second season) and the lowest (of the first season) over ten years. Considering these variations groundwater recharge was estimated by equation (1). This is repeated with 20 years of data. Zonewise quantity of recharge is computed and listed in Table 3.
| RECHARGE BY AVERAGE OF TEN YEAR FLUCTUATION |
|
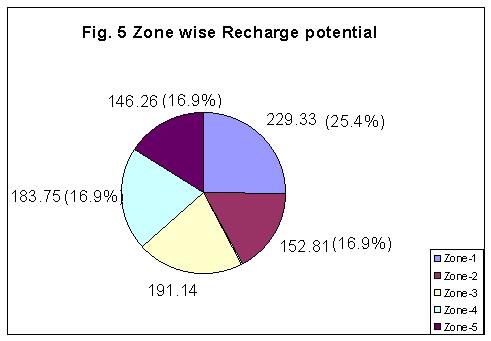
The estimation is worked out for the average fluctuations over ten years in the basin. The difference between the highest level of second season and the lowest of the first season for every year is taken and the average over the ten years is calculated. This is done for all the five zones and the quantity of recharge is calculated. The estimated quantity of recharge is given in Table 4. Thus, the assessment of groundwater potential is done in different time scale. This study is further extended to see the variations spatially. The recharge results are plotted zone wise in Fig 5.
| RESULTS AND DISCUSSION: |
|
The groundwater fluctuation over the entire study period was analysed. It shows a depletion and subsequent recharge of groundwater every year (Fig.3). Especially in 1976, it appears that recharge has occurred largely due to the high storage space available as a result of the lowering of water level in the preceding year. Same effect is seen between the years 1972 to 1974. Besides, the exploitation of groundwater is higher on the upstream side of the basin and decreased towards downstream side and still reduced at the tail end of the basin.
The estimated values of bouncing reserve of groundwater in the basin from the year 1972 to 1991 illustrate the changes in recharge potential, when the time scale for analysis is changed. The comparison plot of four different methods is shown in Fig. 4. and the net recharge values are shown in Table 5.
As per the Groundwater Estimation committee norms, the recharge of 993.07 Mm3 has been computed by the C.E (GW) during 1992. The results obtained by the four methods show that the three methods are close to the results of the assessment made by CE (GW) except the third method. The percentage of deviation is shown in Table 5. Among the four methods, the values obtained by third method of taking the extreme fluctuation over ten years seems to be undesirable. Hence, this method could not be recommended. In other words, the larger time scale in assessment proves to be incorrect. For example, when there is sudden drought in one year and is normal for the remaining nine years the average taken over ten years will give anomalous results which is not the case during that period. On the other hand, the results obtained by the remaining three methods are falling in line with the values of CE (GW), which was used for planning of water resources of Vaigai basin. Hence, they can be recommended for future studies. In particular, the result obtained by the second method is more on a conservative side. The result obtained by the fourth method is best suited for estimation of groundwater recharge.
| CONCLUSIONS: |
|
A more adequate description of the groundwater potential should be given in a statistical sense since they imply the statistical properties of the aquifer. The conclusions derived out of this study will give the hydrologist a more realistic tool to see the high variability and uncertainty associated with the groundwater flow regime. The recommended methods will provide with a quantitative evaluation of the uncertainty inherent to the system and at the same time with the degree of reliability of the methods as a predicting tool at different points in space and time. In this work, the optimum average yearly recoverable groundwater reserve that can be exploited from the aquifer in the basin is found out using different time scale for the depth of fluctuation. Among the four methods, the recharge obtained by second method is more conservative. The results obtained by third method have not been recommended. The result obtained by the fourth method is best suited for estimation of groundwater recharge. Further it shows that the groundwater storage receives bulk of the recharge from monsoon precipitation in the basin.
| ACKNOWLEDGEMENT: |
|
This work is part of a project on "Application of system models for planning and management of water allocation" funded by Institute for Water Studies. Public Works Department, Govt. of Tamil Nadu through M/s Krishnan Associates provided necessary data for this study.
| REFERENCES: |
|
| TABLE 1: RECHARGE BY FLUCTUATION IN MONSOON SEASON |
|
|
Year |
1972 |
1973 |
1974 |
1975 |
1976 |
1977 |
1978 |
1979 |
1980 |
1981 |
|
Zone-1 |
338.5 |
334.5 |
366.03 |
242.8 |
401.19 |
616.6 |
252.83 |
431.5 |
194.87 |
217.19 |
|
Zone-2 |
195 |
187.1 |
137.15 |
181.4 |
159.11 |
309.1 |
140.95 |
259 |
169.36 |
186.78 |
|
Zone-3 |
195 |
189.8 |
166.26 |
206.3 |
171.48 |
310.1 |
182.92 |
278.5 |
138.88 |
300.25 |
|
Zone-4 |
196.8 |
201.5 |
180.93 |
236 |
179.91 |
315.2 |
233.61 |
245.1 |
195.55 |
269.68 |
|
Zone-5 |
146.5 |
155.4 |
115.66 |
111.8 |
120.9 |
290.3 |
128.2 |
172 |
102.73 |
190.75 |
|
Annual |
1072 |
1068 |
966.03 |
978.4 |
1032.59 |
1841 |
938.51 |
1386 |
801.39 |
1164.7 |
|
Year |
1982 |
1983 |
1984 |
1985 |
1986 |
1987 |
1988 |
1989 |
1990 |
1991 |
|
Zone-1 |
219 |
159.3 |
242.28 |
157.2 |
130.6 |
275.8 |
145.8 |
246 |
188 |
191.1 |
|
Zone-2 |
119.5 |
138.2 |
90.5 |
84.15 |
125.5 |
189.3 |
112 |
121 |
157.4 |
128.7 |
|
Zone-3 |
154.2 |
196.1 |
96.06 |
167.5 |
158.5 |
210 |
113.5 |
194 |
139.2 |
244.8 |
|
Zone-4 |
115.3 |
208.4 |
147.1 |
135.2 |
141.4 |
169.5 |
102.4 |
178 |
139.7 |
173.5 |
|
Zone-5 |
150.6 |
90.79 |
114.22 |
97.9 |
88.39 |
190.1 |
107.8 |
104 |
130.7 |
95.99 |
|
Annual |
758.5 |
792.7 |
690.16 |
641.9 |
644.3 |
1035 |
581.5 |
843 |
755 |
834.1 |
| TABLE 2: RECHARGE BY YEARLY WATER LEVEL FLUCTUATION |
|
|
Year |
1972 |
1973 |
1974 |
1975 |
1976 |
1977 |
1978 |
1979 |
1980 |
1981 |
|
Zone-1 |
185.1 |
330.8 |
270.23 |
184.8 |
303.87 |
168.4 |
357.35 |
231.1 |
214.35 |
270.28 |
|
Zone-2 |
156.63 |
174.82 |
221.33 |
109.20 |
197.87 |
141.91 |
179.70 |
188.12 |
160.79 |
153.61 |
|
Zone-3 |
121.42 |
172.49 |
203.56 |
205.14 |
191.73 |
127.24 |
196.03 |
179.36 |
176.04 |
225.22 |
|
Zone-4 |
154.32 |
198.79 |
231.81 |
165.21 |
214.46 |
139.24 |
229.66 |
226.03 |
233.65 |
227.44 |
|
Zone-5 |
157.47 |
162.93 |
169.45 |
87.84 |
154.29 |
152.70 |
181.05 |
153.12 |
151.74 |
151.58 |
|
Annual |
758.6 |
1023 |
1095.8 |
747.8 |
1064.42 |
725.1 |
1143.79 |
947.1 |
1001.7 |
1028.13 |
|
Year |
1982 |
1983 |
1984 |
1985 |
1986 |
1987 |
1988 |
1989 |
1990 |
1991 |
|
Zone-1 |
263.5 |
234.1 |
169.79 |
212.7 |
169.4 |
181.2 |
255.4 |
206 |
212.5 |
165.6 |
|
Zone-2 |
182.06 |
125.71 |
138.56 |
139.1 |
126.8 |
111.9 |
127 |
122 |
170.3 |
128.4 |
|
Zone-3 |
215.67 |
207.41 |
130.09 |
202.2 |
233.7 |
280.3 |
175.4 |
141 |
233.7 |
205.6 |
|
Zone-4 |
222.13 |
137.40 |
168.14 |
200.8 |
154.2 |
163.4 |
182.4 |
121 |
151.6 |
153.5 |
|
Zone-5 |
179.09 |
172.42 |
114.42 |
155.5 |
127.7 |
112 |
150.6 |
138 |
139.1 |
113.7 |
|
Annual |
1018 |
861.1 |
743.74 |
910.2 |
811.8 |
848.8 |
890.8 |
729 |
907.3 |
766.9 |
| TABLE 3: RECHARGE BY WATER LEVEL DIFFERENCE OVER TEN YEARS |
|
|
Year |
1972-81 |
1973-82 |
1974-83 |
1975-84 |
1976-85 |
1977-86 |
1978-87 |
1979-88 |
1980-89 |
1981-90 |
1982-91 |
|
Zone-1 |
543.7 |
566 |
582.78 |
577 |
584.792 |
547.4 |
616.973 |
619.8 |
668.52 |
642.05 |
692 |
|
Zone-2 |
522.4 |
563.6 |
560.7 |
562.5 |
574.38 |
583.9 |
606.23 |
605.4 |
619.14 |
558 |
578.1 |
|
Zone-3 |
397.8 |
373 |
398.66 |
430 |
432.55 |
429.9 |
494.45 |
493.8 |
484.91 |
475.77 |
503.4 |
|
Zone-4 |
687.8 |
651.3 |
663.02 |
622 |
621.68 |
639.1 |
652.52 |
667.2 |
669.61 |
652.57 |
652.6 |
|
Zone-5 |
475.8 |
475.1 |
473.88 |
443.6 |
455.55 |
488.3 |
569.8 |
520.7 |
549.59 |
531.65 |
533.4 |
|
Annual |
2627 |
2629 |
2679.1 |
2635 |
2668.95 |
2689 |
2939.96 |
2907 |
2991.8 |
2860 |
2959 |
| TABLE 4: RECHARGE BY AVERAGE W.L DIFFERENCE OVER TEN YEARS |
|
|
Year |
1972 |
1973 |
1974 |
1975 |
1976 |
1977 |
1978 |
1979 |
1980 |
1981 |
1982 |
|
Zone-1 |
264.4 |
265.3 |
261.8 |
257.2 |
302.9 |
253.4 |
276.73 |
221.1 |
219.65 |
188.79 |
198.3 |
|
Zone-2 |
168.40 |
170.94 |
171.08 |
164.53 |
170.72 |
165.49 |
168.90 |
167.00 |
159.47 |
157.25 |
166.82 |
|
Zone-3 |
134.17 |
187.45 |
206.38 |
162.01 |
178.47 |
136.27 |
206.01 |
180.10 |
195.79 |
216.01 |
215.67 |
|
Zone-4 |
201.58 |
208.41 |
209.59 |
207.13 |
213.10 |
212.88 |
227.58 |
227.08 |
227.57 |
224.62 |
221.99 |
|
Zone-5 |
152.22 |
154.38 |
153.43 |
151.43 |
160.51 |
161.55 |
163.32 |
158.89 |
160.81 |
165.34 |
179.09 |
|
Annual |
920.75 |
986.49 |
1002.28 |
942.31 |
1025.70 |
929.55 |
1042.54 |
954.21 |
963.29 |
952.01 |
981.86 |
| TABLE 5: THE COMPARISON OF RESULTS |
|
|
Sl. No. |
Methodology |
Qty of G.W in Mm3 in a year |
% Deviation from CE (GW) |
|
1. |
By water level fluctuation in monsoon season |
941.26 |
5 |
|
2. |
By yearly water level fluctuation |
901.03 |
9 |
|
3. |
By the lowest & highest water levels over 10 years |
2865.32 |
|
|
4. |
By 10 years average water level fluctuation |
972.82 |
3 |
| FIGURE-1: TAMIL NADU PROJECT LOCATION MAP |
|
| FIGURE-2: VALGAI RIVER BASIN - THIESSEN POLYGON MAP |
|
| FIGURE-3: DEPTH OF GWFLUCTUATION Vs TIME |
|
| FIGURE-4: COMPARISION OF GW RECHARGE METHODS |
|
| FIGURE-5: ZONE WISE RECHARGE POTENTIAL |
|
| ADDRESS: |
|
1.) Professor,
Environmental and Water Resources Engineering Division,
Department of Civil Engineering,
Indian Institute of Technology,
Chennai 600 036,
Tamilnadu,
India.
2.) Research Scholar,
Environmental and Water Resources Engineering Division,
Department of Civil Engineering,
Indian Institute of Technology,
Chennai 600 036,
Tamilnadu,
India.
|
|
|