
|

|

|

STATUS OF ULSOOR LAKE WATER QUALITY BETWEEN 1996-97
K. C. Rathore1 and V. Pattusamy2

|
|
|
|
 ABSTRACT
INTRODUCTION
STUDY AREA
EXPERIMENTAL WORK AND RESULTS
FIRST PHASE STUDY
SECOND PHASE STUDY
THIRD PHASE STUDY
FOURTH PHASE STUDY
FIFTH PHASE STUDY
MAJOR FINDINGS
RECOMMENDATIONS
ACKNOWLEDGEMENT
Annexure Ia
Annexure Ib
Annexure II
Annexure III
ABSTRACT
INTRODUCTION
STUDY AREA
EXPERIMENTAL WORK AND RESULTS
FIRST PHASE STUDY
SECOND PHASE STUDY
THIRD PHASE STUDY
FOURTH PHASE STUDY
FIFTH PHASE STUDY
MAJOR FINDINGS
RECOMMENDATIONS
ACKNOWLEDGEMENT
Annexure Ia
Annexure Ib
Annexure II
Annexure III
| ABSTRACT: |


|
The lakes in Bangalore are disappearing fast and the ones that are remaining are also on the verge of extinction. Ulsoor lake, one of the centrally located tanks in Bangalore City was monitored for various physico-chemical parameters during 1996 - 1997. The results indicate that the lake is highly eutrophic with low DO values and high nitrate, phosphate and heavy metal concentrations.
| INTRODUCTION: |
|
There were about 262 lakes in Bangalore 30 years ago of which 81 exist today. These lakes form a chain of streams, which finally join either river Arkavathi or river Dakshina Pinakini. Bangalore is located 930 meter above mean sea level. Rainwater is stored in lakes and ground water aquifers get recharged eventually. Man made lakes of Bangalore were constructed for drinking, agriculture, recreation and fishing purposes. The health of lake ecosystems is dependent on light, temperature, oxygen, nutrients and the type of aquatic plants that grow in the lake. Zooplankton, insect and fish are primary consumers, while birds are secondary consumers in lake ecosystems.
| STUDY AREA |
|
The present study area, Ulsoor lake is situated in Bangalore city, located at latitude 12� 8' N and longitude 77� 37' E. The mean temperature in the warmest month, April is 27o C and coldest month, January is 20� C, and seldom falls below 15� C (December, January, and February are winter months). The mean value of the relative humidity is 63%. Bangalore benefits from both the Southwest and Northeast monsoons. The average annual rainfall is 87 centimeters. Monsoon is from October to November and dry months are from December to March.
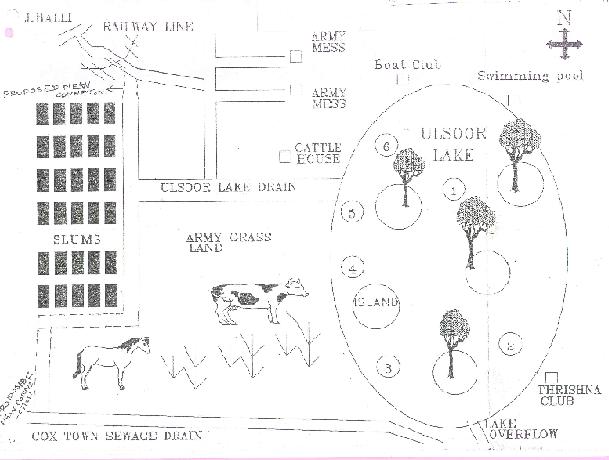
The water quality of Ulsoor lake was monitored between 1996-1997. This waterbody of 50 hectares was built by the family of Kempegowda II in 17th and 18th centuries, for drinking and irrigation, and is located in the middle of the city. In early 19th century, the lake was the major source of drinking water for the cantonment area and troops. The Ulsoor lake drain enters the lake in the north and excess water overflows from the southeast canal. It is estimated that around 4 to 6 feet of sediment has accumulated over a period in the lake. The current depth ranges from approximately 6 to 7 feet in the middle and 3 to 4 feet in the periphery. The catchment area of Ulsoor lake is 1.5 km2. Karnataka State Tourism Development Corporation is operating mechanised boat service for tourists. Army also operates boats for its routine exercise and training. The excess water flowing out reaches Bellandur lake and is used for agriculture. The pollution potential is quite high although pesticides and fertilisers have not been used in the lake's catchment, but sewage gets mixed with the storm water flowing into the lake during monsoon.
| EXPERIMENTAL WORK AND RESULTS: |
|
The study on water quality of the lake was conducted in 5 phases during 1996-1997.
| FIRST PHASE STUDY: |
|
Six monitoring points were identified in the lake. One station was in the centre of the lake while the other stations were in the periphery of the lake (monitoring points and locations are shown in annexure-Ia). These monitoring stations are:
The preliminary study was conducted for temperature and dissolved oxygen (DO), which were monitored for three days at regular intervals of one hour. DO was measured using Orion DO meter. The samples for analysis were taken at the surface, middle and bottom of the lake. DO was found to be very high during the day and low at night (range 0.1 mg/L to 4.4 mg/L).
| SECOND PHASE STUDY: |
|
Productivity/respiration (P/R) ratio study conducted shows the lake to be saprobic.
| THIRD PHASE STUDY: |
|
This phase of study was conducted by taking monthly samples for three months (October, November and December, 1996), at six locations and analysed for pH, DO, COD, BOD, TDS, conductivity, calcium hardness, magnesium hardness, alkalinity, chloride, sulphate, phosphate, sodium, boron, chlorophyll, TKN, and nitrate, nitrite and ammoniacal nitrogen. The samples were collected monthly again in 1997 from the centre of Ulsoor lake and analysed. Phosphate and nitrogen content was higher and chlorophyll content was unusually high. The minimum and maximum content of phosphate was 2.02 mg/L and 2.49 mg/L respectively, while nitrogen was 2.41mg/L and 3.7mg/L and chlorophyll 583 mg/m3 and 1026 mg/m3 (annexure II).
| FOURTH PHASE STUDY: |
|
This phase of study was conducted (on 20.2.97) for analysing the presence of heavy metals in the lake water. Water and sludge samples were collected at all the six locations and analysed for mercury, zinc, cadmium, chromium, lead and copper. The concentrations of zinc, cadmium, chromium, lead and copper were found to be very high in sludge samples. The concentration of heavy metals ranged from 130 mg/kg to 95300mg/kg (annexure III).
| FIFTH PHASE STUDY: |
|
This phase of study was conducted to prepare an inventory of sources of pollution in Ulsoor lake. There are three drains joining Ulsoor lake at different points, the first drain starting from the Madras Engineering Group (MEG) Centre (of the Army), a kilometre from the lake. The second drain starts from Jeevanahalli, around two kms from the lake. The third starts from Doddigunta and traverses through Kattariyamma garden, Godhandappa garden, Munivenkattappa garden, Muthamma garden and New Corporation colony. All these areas are slums, which are within a kilometre from the lake.
The MEG Centre located near the lake has forty buffaloes, fifteen cows and three horses for milk procurement and other needs. Around 100 acres of grazing land is available for the cattle. The cattle-house wash is drained into the lake, which should be normally disposed off into the adjoining grassland, but is not done due to a broken pipe. There are two messes operating here, the Chokkalingam company mess and N.C.O. mess which daily cook around 70 kg and 35 kg of rice respectively. Water used in these messes for rinsing the rice and to wash the mess area is drained into the lake. The second drain from Jeevanahalli carries wastewater from residential areas and M/s. I.T.C. into the lake. During rainy season the storm water and sewage water flows into the Ulsoor lake. The third drain coming from Doddigunta and traversing through Kattariyamma garden, Godhandappa garden, Munivenkattappa garden, Muthamma garden and New Corporation colony, carry waste from around 2000 houses in the slums into the lake.
| MAJOR FINDINGS: |
|
The study shows the daytime DO to be very high. It varies between 0.2 and 4.5 mg/L. P/R ratio is less than one, indicating the entire lake to be saprobic. Third phase of the study shows phosphate, nitrogen and chlorophyll to be high causing eutrophication of the lake. Blue green algae - microcystis was observed to spread from surface to bottom of the lake. This algae is toxic and utilises DO in the night, while releasing oxygen during the day. Aquatic plants and fish are highly affected with only a few fish varieties remaining. The fourth phase of study shows the presence of high concentrations of zinc and the metal content in water samples was very high. In sludge samples, concentration of Zn, Cd, Cr, Pb and Cu content was very high. The depth of the sludge was observed to be about 5 feet.
| RECOMMENDATIONS: |
|
1. Desilting is required to remove contaminants.
2. The lake should be surrounded by fence on all sides and encroachments should be strictly prohibited.
3. Only storm water should be allowed into the lake (annexure Ib).
4. Army cattle house wash, cowdung wash and army mess wash should be stopped. The army can install a gobar gas plant.
5. Plastic bags should be avoided from draining into the lake.
6. Sewage/manhole under railway bridge in Jeevanahalli should be closed.
7. Slum (Doddigunta, Kattariyamma garden, Godhandappa garden, Munivenkatappa garden, Mutharmma garden and New Corporation colony) drain water and Jeevanahalli drain water should be subjected to treatment before being let into the lake. This slum storm water and wastewater drain should be connected and sent to Cox town sewage drain as it is very near to the above slum.
8. Submerging of idols during the festival season should be proscribed. To deplete the nitrogen and phosphate content fishes and aquatic plants may be cultivated and harvested periodically.
| ACKNOWLEDGEMENT: |
|
The authors express their gratitude to the monitoring team comprising Mr. S.K.Singh, AEE, Mr. T.K.Radheshyam Balaji, SSA, Dr. P. Mani, SSA, Mr. K. M. Udayakumar, SSA, Mr. S. Jeyapaul, JSA. Mr. I.A. Kadar, SLA. and Mr. S. Iqbal, SLA.
| Annexure Ia |
|

| Annexure Ib |
|
| Annexure II |
|
ANALYSIS REPORT
|
Sl.No |
Parameters |
Method |
U1 to U6 6 monitoring points average |
|||
|
Oct '96 |
Nov '96 |
Dec '96 |
Average |
|||
|
1 |
PH |
METER |
8.78 |
7.18 |
7.13 |
7.7 |
|
2 |
D.O |
METER/ AZIDE MODIFIED |
12.75 |
13.9 |
10.4 |
12.3 |
|
3 |
COD |
REFLUXION |
159.5 |
248.5 |
242 |
216.6 |
|
4 |
BOD |
DILUTION |
29.1 |
19.8 |
29.3 |
26 |
|
5 |
T.SS |
TURBIDITRY (NTU) |
55.3 |
- |
- |
55.3 |
|
6 |
TDS |
GRAVIMETRY |
- |
580 |
376 |
478 |
|
7 |
CONDUCTIVITY |
METER u mhos/cm |
620 |
624 |
624 |
622 |
|
8 |
T.HARDNESS |
TITRIMETRIC |
203 |
213 |
1884 |
200 |
|
9 |
Ca.HARDNESS |
TITRIMETRIC |
73 |
72 |
57.88 |
67.6 |
|
10 |
Mg HARDNESS |
CALCULATION |
7.1 |
8.2 |
9.8 |
8.3 |
|
11 |
ALKALINITY |
TITRIMETRIC |
352 |
600 |
435 |
462 |
|
12 |
CHLORIDES |
ION METER / TITRIMETRIC |
77.5 |
80.3 |
81.6 |
79.8 |
|
13 |
SULPHATE |
TURB. (SPECTROPHOTOMETRIC) |
46.3 |
30.2 |
36.4 |
37.6 |
|
14 |
PHOSPHATE |
SnCl2 |
2.49 |
2.43 |
2.02 |
2.31 |
|
15 |
SODIUM |
FLAME PHOTOMETER |
67.1 |
67.8 |
78.1 |
71 |
|
16 |
BORON |
CURCUMIN |
0.07 |
0.24 |
0.17 |
0.16 |
|
17 |
NO2 + NO3 |
Cd REDUCTION |
2.41 |
2.92 |
3.51 |
2.94 |
|
18 |
NH3. N |
PHENATE |
- |
0.22 |
0.29 |
0.255 |
|
19 |
CHLOROPHYLL |
SPECTROPHOTOMETER mg/m3 |
- |
583 |
1026 |
804.5 |
|
20 |
TKN |
- |
- |
11.8 |
9.7 |
10.75 |
| Annexure III |
|
ULSOOR LAKE WATER SAMPLE - HEAVY METAL ANALYSIS RESULTS
|
(m g/L) |
U1 |
U2 |
U3 |
U4 |
U5 |
U6 |
Average |
|
|
1 |
Mercury |
- |
- |
- |
- |
- |
- |
|
|
2 |
Zinc |
60 |
15 |
5 |
51 |
29 |
17 |
29.5 |
|
3 |
Cadmium |
- |
- |
- |
- |
- |
- |
|
|
4 |
Chromium |
- |
- |
- |
- |
- |
- |
|
|
5 |
Lead |
- |
- |
- |
- |
20 |
16 |
|
|
6 |
Copper |
16 |
- |
- |
6 |
16 |
7 |
|
|
*U1- Basina Ganj, U2 - Thrishna Club, U3 - Rose Garden, U4 - Near Mosque, U5 - Near Tamil Sangam and U6 - Military Pumphouse |
||||||||
ULSOOR LAKE SEDIMENT SAMPLE - HEAVY METAL ANALYSIS RESULTS
|
Sl.No. |
Heavy Metals |
Sample Locations |
||||||
|
(m g/kg) |
U1 |
U2 |
U3 |
U4 |
U5 |
U6 |
Average |
|
|
1 |
Mercury |
- |
- |
- |
- |
- |
- |
|
|
2 |
Zinc |
30160 |
34870 |
26380 |
35580 |
37200 |
73070 |
39543 |
|
3 |
Cadmium |
167 |
160 |
130 |
163 |
163 |
230 |
168 |
|
4 |
Chromium |
97000 |
95300 |
66800 |
85800 |
83400 |
89900 |
86316 |
|
5 |
Lead |
11280 |
15690 |
10550 |
13550 |
11840 |
14460 |
12895 |
|
6 |
Copper |
10300 |
22900 |
16400 |
22320 |
19500 |
27760 |
19863 |
| ADDRESS: |
|
1.) Zonal Officer,
Central Pollution Control Board,
South Zonal Office,
Bangalore
2.) Scientist C,
Central Pollution Control Board,
South Zonal Office,
Bangalore
|
|
|