
|

|

|

AIR QUALITY MONITORING AND MODELING FOR COIMBATORE CITY
P.Meenakshi1 and R.Elangovan2

|
|
|
|
 ABSTRACT
INTRODUCTION
MONITORING METHODOLOGY FOR SAMPLE COLLECTION
TABLE 1: AMBIENT AIR QUALITY STANDARDS BY CENTRAL POLLUTION CONTROL BOARD, INDIA
MODELING METHODOLOGY FOR THE ANALYSIS OF MONITORED DATA - IDEAL MODEL
CLASSIFICATION OF AIR QUALITY MODELS
REGRESSION ANALYSIS
CONCLUSION
ACKNOWLEDGEMENT
FIGURE-1: COIMBATORE CITY MAP
TABLE 2: AMBIENT AIR QUALITY DATA MEASURED DURING JANUARY 2000 TO MARCH 2000
TABLE 3: PREDICTED AMBIENT AIR QUALITY FOR THE PERIOD OF MONITORING BY BACK FORECASTING
FIGURE2.VALIDATION OF THE EVOLVED MODELS
ABSTRACT
INTRODUCTION
MONITORING METHODOLOGY FOR SAMPLE COLLECTION
TABLE 1: AMBIENT AIR QUALITY STANDARDS BY CENTRAL POLLUTION CONTROL BOARD, INDIA
MODELING METHODOLOGY FOR THE ANALYSIS OF MONITORED DATA - IDEAL MODEL
CLASSIFICATION OF AIR QUALITY MODELS
REGRESSION ANALYSIS
CONCLUSION
ACKNOWLEDGEMENT
FIGURE-1: COIMBATORE CITY MAP
TABLE 2: AMBIENT AIR QUALITY DATA MEASURED DURING JANUARY 2000 TO MARCH 2000
TABLE 3: PREDICTED AMBIENT AIR QUALITY FOR THE PERIOD OF MONITORING BY BACK FORECASTING
FIGURE2.VALIDATION OF THE EVOLVED MODELS
| ABSTRACT: |


|
Based on the questionnaire survey on the population of Coimbatore City, the entire area is divided into five zones and assumed to be of residential and mixed use as there is no particular pattern of development observed in the city. The survey stations chosen in each of these five zones are Ganapathy, Gandhipuram, Peelamedu, Gandhi Park and Ukkadam. The major air pollutants selected for monitoring are SPM, SO2 and NOx. The meteorological parameters chosen are wind temperature, pressure, predominant direction and velocity. The monitoring is done once a week on a particular day at each of the selected stations. The data obtained during January to March 2000 are collectively analyzed by multi regression to evolve the models. The models developed for each of the major pollutants are functions of observed meteorological parameters. Back forecasting is done for the observed concentrations and graphs are drawn between the observed and predicted concentrations to validate the evolved models.
| INTRODUCTION: |
|
Man is making rapid strides in science and technology. His eagerness to increase his comforts by utilising the natural resources leads to rapid industrialisation and abnormal urbanisation, which consequently witness excessive air pollution. To impose proper control measures, regular air quality monitoring is essential, which is a time consuming and tedious procedure involving heavy utilisation of money and manpower. The current concern on environmental pollution and sustainable development makes it imperative to have air quality models which serve as a tool for providing objective answers to many questions regularly faced by decision makers in the fields of air pollution control, transportation planning and land use planning.
| MONITORING METHODOLOGY FOR SAMPLE COLLECTION: |
|
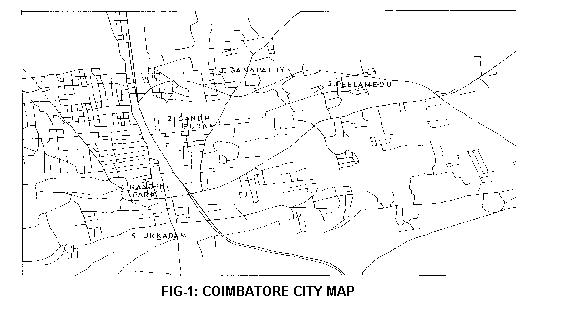
The entire area of the city is divided into five zones as shown in Figure 1., and a survey station was selected in each of these areas. The growth pattern of Coimbatore city does not follow any zonal pattern. Hence, all the survey areas chosen are categorised as industrial and mixed. Based on a questionnaire survey on ambient air quality from the general public, it was understood that the main source of air pollution was the dust arising from roads and vehicular emissions. Hence, the major air pollutants considered were SPM, SO2 and NOx, which were observed using High Volume Samplers (ENVIROTECH APM 410-411 MODEL). The analytical procedures for determination of pollutants were as per Bureau of Indian standards given by Methods for measurement of air quality. The concentrations of the air pollutants were measured once a week on a particular day in each of these stations. The ambient air quality standards prescribed by Central Pollution Control Board, India for the major air pollutants are given in Table 1. The daily 8 hours concentrations observed during January to March 2000 in each of these stations are given in Table 2.
| TABLE 1: AMBIENT AIR QUALITY STANDARDS BY CENTRAL POLLUTION CONTROL BOARD, INDIA |
|
|
Zone |
Exposure hrs |
Standard concentration m g/Cu.m SPM SO2 NOx |
||
|
Industrial and mixed |
8 |
500 |
120 |
120 |
|
Residential |
8 |
200 |
80 |
80 |
|
Sensitive |
8 |
100 |
30 |
30 |
|
MODELING METHODOLOGY FOR THE ANALYSIS OF MONITORED DATA
IDEAL MODEL |
|
Strictly speaking, an ideal model should have the following qualities:
1. Physically realistic and accurate.
2. Universally applicable with respect to spatial and temporal scale, meteorology and topography.
3. Supported by easily available input data.
4. User friendly.
5. Properly validated against observations.
6. Verified against real database.
However, ideal models rarely exist. A compromise should be made between simplicity and sophistication, accuracy and practicality. The accuracy of the model depends on its input data. Depending on the availability of input data, decisions on the model type, its degree of sophistication, range of applicability and other important features can be decided.
| CLASSIFICATION OF AIR QUALITY MODELS: |
|
Air quality models can be categorised into four generic classes. Analytical models are based on the analytical explicit solutions of diffusion equations, which require a large database. Numerical models basically deal with different types of numerical approximations in the solutions of partial differential equations representing the physics of atmospheric dispersion phenomena. Physical models are small-scale representations of atmospheric dispersion. They include wind tunnels, smog chambers, etc. Statistical models are based on the time series (or any other trend) analysis of meteorological and air quality data. These models are useful for real time analysis and short term forecasting. Among these modelling techniques, statistical modelling is adopted for analysis of the monitored data since the observed data are only for a short period.
| REGRESSION ANALYSIS: |
|
This analytical tool performs linear regression analysis by using the "least squares" method to fit a line through a set of observations. Using this, one can analyze how a single dependent variable is affected by the values of one or more independent variables. In this case study, regression analysis is done to know how a pollutant concentration in this city is affected by such factors as wind temperature, pressure, direction and speed. One can apportion shares in the concentration measure to each of these three factors based on a set of monitored data, and then use the results to predict the pollutant concentration in the future. The monitored data at the five selected stations in Coimbatore City are analyzed by multi regression and the evolved models for prediction of each of the pollutants as a function of the chosen meteorological parameter are given below with respective regression coefficients.
SPM= -82.0703 T -80.5704 P -0.76381 WD -2.03456 WV +64531.68; R = 0.5
SO2= 2.397 T -1.1481 P +0.016 WD +1.173 WV +831.5413; R = 0.2
NOx=5.728 T +3.2582 P -0.0636 WD +2.1923 WD +2.192 WV -2601.85; R=0.36
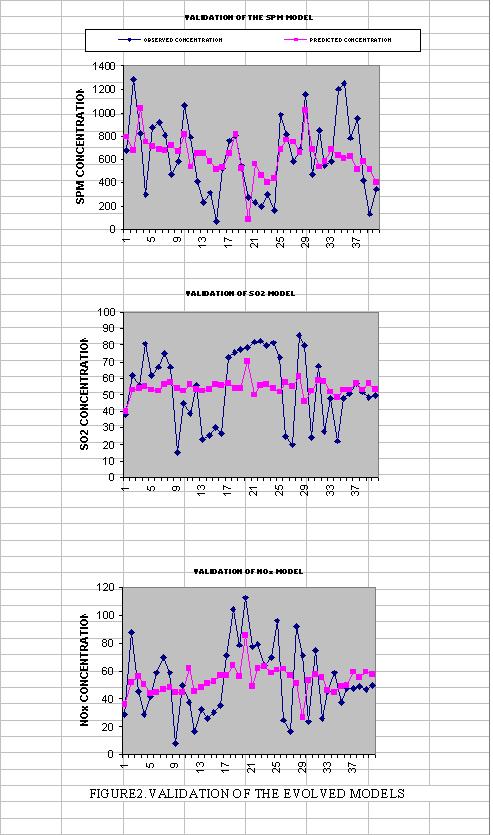
Where T- temperature, P - pressure, WD - wind direction and WV - wind velocity. Back forecasting is done with the evolved models and the validation is done with the plot between the observed and predicted pollutant concentration, which is given in Fig 2 (Table 3).
| CONCLUSION: |
|
The comprehensive survey of air quality at five selected stations is compared with ambient air quality standards of Central Pollution Control Board.
1. The SPM concentration in the ambient air in Coimbatore is extremely high than the threshold limit.
2. The NOx and SO2 concentrations are within the prescribed limits but show-increasing trend.
3. The wind condition is observed to be calm in Gandhi Park and Gandhipuram resulting in high level of SPM in these localities.
4. Traffic congestion and high rise buildings are the main cause for increase in pollutant concentrations.
5. The wind direction, in all the survey stations is predominantly in the western direction during the sampling periods.
6. The evolved models can be used for any city having similar meteorological conditions.
7. The lower regression coefficients are due to less number of observations, which can be increased by having more number of observations.
| ACKNOWLEDGEMENT: |
|
The first author expresses her sincere thanks to All India Council for Technical Education for providing funds to carry out this project.
| FIGURE-1: COIMBATOTE CITY MAP |
|
| TABLE 2: AMBIENT AIR QUALITY DATA MEASURED DURING JANUARY 2000 TO MARCH 2000 |
|
|
SPM |
SO2 |
NOx |
T |
P |
WD |
WV |
|
676.57 |
38.64 |
29.2 |
27.8 |
760 |
270 |
8.8 |
|
1284.7 |
61.45 |
87.5 |
33.1 |
756.5 |
225 |
6.15 |
|
822.01 |
55.86 |
45.83 |
32.88 |
754 |
45 |
7.15 |
|
297.51 |
80.99 |
29.2 |
32.5 |
756 |
245 |
8.41 |
|
871.1 |
61.45 |
41.7 |
32.87 |
756 |
270 |
5.45 |
|
913.1 |
66.7 |
58.6 |
32.64 |
756.5 |
270 |
5.6 |
|
803.6 |
75.25 |
69.45 |
34.26 |
755 |
270 |
4.46 |
|
471.86 |
66.8 |
58.5 |
33.7 |
755 |
270 |
6.39 |
|
584.98 |
15.36 |
8.32 |
30.4 |
758 |
360 |
11.8 |
|
1063.17 |
44.74 |
50 |
30.38 |
757 |
270 |
10.78 |
|
791.34 |
39.1 |
37.5 |
34.31 |
757 |
225 |
6.95 |
|
410.38 |
55.87 |
16.66 |
33.56 |
756 |
270 |
4.25 |
|
231.6 |
23.47 |
32.15 |
32.52 |
757 |
270 |
6.56 |
|
311.79 |
25.6 |
26.1 |
33.35 |
757 |
270 |
5.76 |
|
68.82 |
30.2 |
30.55 |
33.81 |
757 |
315 |
6.59 |
|
520.98 |
26.88 |
35.1 |
34.03 |
757 |
270 |
6.34 |
|
761 |
72.6 |
70.8 |
32.45 |
757 |
270 |
10.48 |
|
808.3 |
75.41 |
104.1 |
33.17 |
756 |
90 |
8.37 |
|
545 |
77.37 |
78.57 |
31.6 |
759 |
315 |
10.95 |
|
270.01 |
78.2 |
112.5 |
39.03 |
757 |
315 |
7.92 |
|
230 |
81.75 |
77.55 |
31.17 |
759 |
315 |
8.69 |
|
198.9 |
82.65 |
79.35 |
33.84 |
758 |
270 |
7.89 |
|
298.1 |
79.4 |
64.2 |
34.6 |
758 |
270 |
6.69 |
|
164.5 |
81.3 |
70 |
34.14 |
758 |
270 |
5.65 |
|
983.18 |
72.6 |
95.9 |
33.37 |
757 |
135 |
6.02 |
|
819.24 |
25.1 |
25 |
34.32 |
755 |
135 |
7.03 |
|
586.16 |
19.56 |
16.66 |
33.1 |
756 |
180 |
7.87 |
|
681.71 |
85.79 |
91.7 |
33.9 |
755 |
315 |
8.44 |
|
1149.04 |
79.83 |
71.1 |
30.5 |
755 |
225 |
3.94 |
|
468.36 |
24.49 |
23.6 |
33.98 |
756 |
180 |
3.92 |
|
846.96 |
67.7 |
74.65 |
34.94 |
756 |
270 |
6 |
|
540.88 |
28 |
26.3 |
34.33 |
756 |
270 |
6.53 |
|
587.1 |
47.5 |
45.83 |
30.68 |
758 |
315 |
10.2 |
|
1204 |
22.35 |
58.3 |
31.8 |
758 |
270 |
5.5 |
|
1248 |
47.5 |
37.53 |
31.6 |
758 |
315 |
9.2 |
|
780.2 |
50.82 |
47.85 |
32.88 |
757 |
270 |
6.2 |
|
943.1 |
57.1 |
47.8 |
34.2 |
757 |
270 |
7.2 |
|
421.8 |
51.7 |
49.2 |
33.8 |
757 |
225 |
5.1 |
|
132.6 |
48.5 |
46.8 |
34.2 |
757 |
270 |
7.2 |
|
345.5 |
49.3 |
49.9 |
33.13 |
759 |
315 |
7.5 |
| TABLE 3: PREDICTED AMBIENT AIR QUALITY FOR THE PERIOD OF MONITORING BY BACK FORECASTING |
|
|
SPM |
SO2 |
NOx |
|
792.2148 |
40.30383 |
35.75872 |
|
679.0027 |
53.19073 |
51.76784 |
|
1033.936 |
53.79536 |
56.00047 |
|
748.6561 |
55.3019 |
50.38444 |
|
705.2172 |
53.11992 |
44.42507 |
|
683.5028 |
52.17048 |
45.06546 |
|
673.7244 |
56.43866 |
46.95907 |
|
715.7571 |
57.3609 |
47.98224 |
|
665.1273 |
53.80944 |
44.99014 |
|
818.1573 |
52.25684 |
45.10428 |
|
537.7846 |
56.45623 |
62.08221 |
|
651.0301 |
53.36596 |
45.74696 |
|
651.1127 |
52.43524 |
48.11174 |
|
584.6219 |
53.48629 |
51.11254 |
|
510.8096 |
56.29097 |
52.70571 |
|
527.6341 |
55.7971 |
56.27942 |
|
648.8821 |
56.86734 |
56.30452 |
|
812.1404 |
54.35388 |
63.99119 |
|
522.1728 |
53.81278 |
56.12057 |
|
79.69658 |
70.36588 |
85.52403 |
|
562.0611 |
50.12992 |
48.70276 |
|
459.5031 |
56.01232 |
61.84726 |
|
399.5711 |
56.42617 |
63.57014 |
|
439.4394 |
54.103 |
58.65507 |
|
685.5655 |
51.65555 |
60.38168 |
|
766.6853 |
57.41448 |
61.52153 |
|
750.16 |
55.0552 |
56.771 |
|
660.8009 |
60.97387 |
50.7606 |
|
1017.738 |
46.08646 |
27.14158 |
|
685.9746 |
52.52975 |
53.15251 |
|
534.2126 |
58.72785 |
57.48875 |
|
583.1972 |
57.88739 |
55.1563 |
|
679.7742 |
51.87525 |
45.94797 |
|
631.7892 |
48.31716 |
44.92162 |
|
606.304 |
52.90737 |
49.02587 |
|
622.2998 |
52.87585 |
49.38477 |
|
511.9324 |
57.21381 |
59.13863 |
|
583.4044 |
53.0627 |
55.10496 |
|
511.9324 |
57.21381 |
59.13863 |
|
403.6244 |
53.43234 |
57.32173 |
| FIGURE2.VALIDATION OF THE EVOLVED MODELS |
|
| Address: |
|
1.) Lecturer in Civil Engg.,
Coimbatore Institute of Technology,
Coimbatore -641 014,
Tamilnadu.
2.) Asst.Professor in Civil Engg. Coimbatore Institute of Technology,
Coimbatore -641 014,
Tamilnadu
|
|
|