
|

|

|

IMPACT OF TANK DESILTING ON FLUOROSIS CONTROL - A CASE STUDY IN BAGEPALLI, KOLAR DISTRICT
H. K. Ramaraju1 , Madhava2 , V. Lakhminarayana3 and G. Ranganna4

|
|
|
|
 ABSTRACT
INTRODUCTION
DEFLUORIDATION METHODS
METHODOLOGY
STUDY AREA
CLASSIFICATION OF AIR QUALITY MODELS
RESULTS AND DISCUSSION
HEALTH STATUS
CONCLUSIONS
RECOMMENDATIONS
ACKNOWLEDGEMENTS
REFERENCES
TABLE 1 : RESULTS OF CHEMICAL ANALYSIS OF ROCK SAMPLES OF THE STUDY AREA (ALL VALUES IN PERCENT)
TABLE 2: RESULTS OF CHEMICAL ANALYSIS OF SOIL SAMPLES AND ROCK CUTTINGS THAT WERE COLLECTED FROM THE NEW OBSERVATION WELL SITE
TABLE 3: RESULTS OF CHEMICAL ANALYSIS OF WATER SAMPLES FROM DIFFERENT DEPTHS AT THE NEW OBSERVATION WELL DRILLED ON 25-01-1996
TABLE 4: DISTRIBUTION OF FLUORIDE AND OTHER PARAMETERS IN THE EXISTING BORE WELL WATER IN THE PROJECT AREA BEFORE AND AFTER DESILTING OF THE TANK
TABLE 5: RESULTS OF CHEMICAL ANALYSIS OF THE TANK WATER SAMPLES COLLECTED DURING DIFFERENT MONTHS
TABLE 6: RESULTS OF CHEMICAL ANALYSIS OF WATER SAMPLES COLLECTED FROM THE HAND PUMP (RESIDENCE) IN PATHAPALYA VILLAGE
TABLE 7: RESULTS OF THE CHEMICAL ANALYSIS OF THE TANK WATER SAMPLES COLLECTED FROM THE NEW OBSERVATION WELL SITE AND THE DEPTH TO GROUNDWATER TABLE
FIGURE-1: LOCATION MAP OF PATAPALYA TANK
FIGURE-2: DEPTH AT WHICH SAMPLES WERE COLLECTED AT THE NEW OBSERVATION WELL SITE
FIGURE-3: VARIATION IN FLUORIDE CONCENTRATION AT PATAPALYA
FIGURE-4: DEPTH TO WATERTABLE Vs MONTH AND VARIATION IN FLUORIDE CONCENTRATION
ABSTRACT
INTRODUCTION
DEFLUORIDATION METHODS
METHODOLOGY
STUDY AREA
CLASSIFICATION OF AIR QUALITY MODELS
RESULTS AND DISCUSSION
HEALTH STATUS
CONCLUSIONS
RECOMMENDATIONS
ACKNOWLEDGEMENTS
REFERENCES
TABLE 1 : RESULTS OF CHEMICAL ANALYSIS OF ROCK SAMPLES OF THE STUDY AREA (ALL VALUES IN PERCENT)
TABLE 2: RESULTS OF CHEMICAL ANALYSIS OF SOIL SAMPLES AND ROCK CUTTINGS THAT WERE COLLECTED FROM THE NEW OBSERVATION WELL SITE
TABLE 3: RESULTS OF CHEMICAL ANALYSIS OF WATER SAMPLES FROM DIFFERENT DEPTHS AT THE NEW OBSERVATION WELL DRILLED ON 25-01-1996
TABLE 4: DISTRIBUTION OF FLUORIDE AND OTHER PARAMETERS IN THE EXISTING BORE WELL WATER IN THE PROJECT AREA BEFORE AND AFTER DESILTING OF THE TANK
TABLE 5: RESULTS OF CHEMICAL ANALYSIS OF THE TANK WATER SAMPLES COLLECTED DURING DIFFERENT MONTHS
TABLE 6: RESULTS OF CHEMICAL ANALYSIS OF WATER SAMPLES COLLECTED FROM THE HAND PUMP (RESIDENCE) IN PATHAPALYA VILLAGE
TABLE 7: RESULTS OF THE CHEMICAL ANALYSIS OF THE TANK WATER SAMPLES COLLECTED FROM THE NEW OBSERVATION WELL SITE AND THE DEPTH TO GROUNDWATER TABLE
FIGURE-1: LOCATION MAP OF PATAPALYA TANK
FIGURE-2: DEPTH AT WHICH SAMPLES WERE COLLECTED AT THE NEW OBSERVATION WELL SITE
FIGURE-3: VARIATION IN FLUORIDE CONCENTRATION AT PATAPALYA
FIGURE-4: DEPTH TO WATERTABLE Vs MONTH AND VARIATION IN FLUORIDE CONCENTRATION
| ABSTRACT: |


|
The well being of humans depends on quality of drinking water. Consumption of water containing excess fluoride over a long period results in fluorosis. Currently, fifteen states of India are endemic for fluorosis. As there is no treatment available in rural India, prevention is the best way to fight this disease, which could be achieved by defluoridating drinking water (having more than 1.5 mgl-1 fluoride). Desilting of tanks might help in bringing down the fluoride levels. The fluoride concentration in ground water of Kolar district is heterogeneously distributed. The tank near Pathapalya village has been desilted and the study has been undertaken in the village to check the variation of fluoride concentration. The study reveals a sharp rise in ground water table in the nearby wells and a fall in fluoride concentration in water samples.
| INTRODUCTION: |
|
Rivers and lakes are the primary sources of fresh water for day-to-day needs and constitute less than 1% of the available water on the earth. In recent years, floods and droughts have become more rampant with the growth of population and deforestation (Dikshit et al., 1993). One way of mitigating these problems is by harvesting rainwater and through conservation measures.
Fluoride when consumed in excess (>1.5 mg/l) can cause several health problems such as skeletal and non-skeletal fluorosis, dental fluorosis, and or combination of the above. Fluoride is also known to induce aging and no amount of medicine can cure or improve the damage (RGNDWM, 1994). Twelve districts of Karnataka are endemic for fluorosis including Kolar district. It is observed that fluoride in ground water is heterogeneously distributed, ranging from 0.3 to 4.3 mg/l. The degree of manifestation of fluorosis in Kolar district is very high and this is directly related to the excessive concentration of fluoride in drinking water.
Survey findings from Kolar District (Source: ZPED/PHC, 1992)
|
Population enumerated |
112328 |
|
Total number of people with skeletal fluorosis |
251 |
|
Total number of people with dental fluorosis |
10404 |
|
Total number of girls and boys in age group of 6 to 16 years |
35152 |
|
Number of girls and boys with dental fluorosis |
15015 |
|
Number of pregnant women |
1125 |
|
Number of lactating mothers |
2275 |
| DEFLUORIDATION METHODS: |
|
Excess fluoride concentration can be removed by using chemicals like lime; magnesium and aluminum sulphate and adsorption methods like activated carbon, strong base anion exchange resins, tricalcium phosphate and activated alumina. The following methods can be used to remove excess fluorides in drinking water.
| METHODOLOGY: |
|
Dilution method has been chosen for the present study. There are several tanks in Kolar district, i.e., one tank per sq. kilometer and most tanks are silted reducing the storage capacity. Desilting of these tanks has been undertaken by the Govt. of Karnataka with the assistance of World Bank in a phased manner to increase storage and recharge to ground water. An attempt is made to know the extent of ground water recharge and the decrease in fluoride level due to dilution as a result of desilting of tanks. An observation well was drilled in the vicinity of the desilted tank (downstream side) and water samples were collected at regular intervals during different months. Samples were also collected from a borewell near the tank. Soil and rock samples from different strata were collected while the observation well was drilled.
| STUDY AREA: |
|
The study area is Pathapalya village in Bagepalli Taluk of Kolar District, Karnataka State. The chronically drought-prone district (North latitude 12�461-13�581 and east longitude 77�211-78�351) covers an area of 8240 sq. km with a population of 2.3 million as per 1991 census and normal rainfall of 744 mm. Bagepalli Taluk covers an area of 933 sq. km with annual rainfall of 677 mm. It is observed that many of the tanks have not received sufficient inflow during the previous years.
Peninsular gneiss covers a large portion of the district followed by older granite and schist. The fluctuation of water level in the wells of the district varied from 0.72 m to 9.53 m below ground level (Reddy et al., 1993). Kolar district accounts for 4,481 tanks, the highest in the state, all the tanks found in the Palar-Pennar-Pinakini river basins.
The tanks were constructed during the pre-independence days. Since the construction, the removal of silt, repairs and maintenance of channels has not been undertaken when required due to financial constraints. Many tanks are silted and some are visually dead. As a result the storage capacity and percolation of water has reduced. The situation has worsened due to indiscriminate digging of borewells for tapping groundwater resulting in its over exploitation. Ten tanks were desilted in the district during 1994.
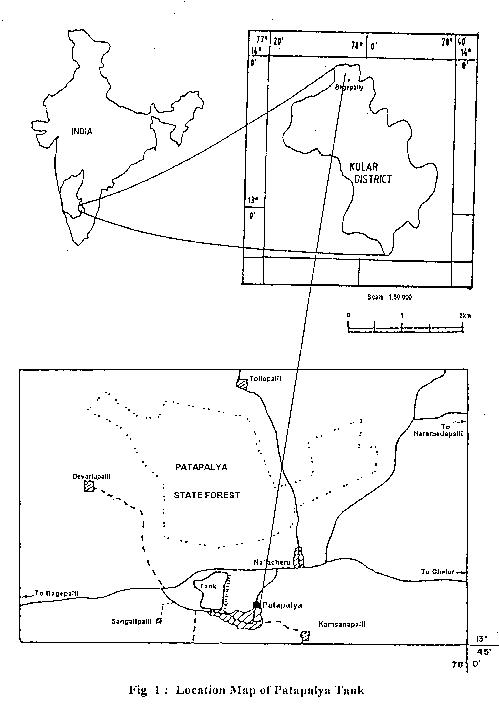
Ammanakere tank is situated near Pathapalya village and was constructed in the year 1889. It has a spread of 92.8 hectares and a catchment area of 14.5 sq. km. Pathapalya and Gujjehally are the two important villages benefited by this tank. The tank has been silted up due to poor maintenance and reduced to two-thirds of its original capacity, which has been restored by desilting. Fig 1 shows the location map of Pathapalya tank.
| RESULTS AND DISCUSSION: |
|
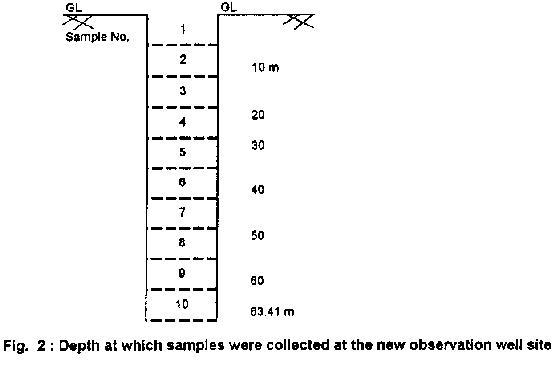
Water samples were collected (from October 1995 onwards) from different sampling points at the study site and analysed for various chemical parameters, namely pH, alkalinity, fluoride and hardness. Table 1 presents the chemical composition of rock samples (R1, R2 and R3) collected from the study area. The results reveal the fluoride content to vary from 0.08% to 0.16%. A new observation borewell was drilled in the study area in January 1996 to a depth of 63.50 m. The water table was at a depth of 18.30 m from the surface. The diameter of the borewell drilled was 15 cm. During drilling, soil samples, rock cuttings as well as water samples were collected and subjected for chemical analysis. Fig 2 and Table 2 show the soil strata observed at different depths from the ground level in which fluoride content varied from 0.02% to 0.32%.
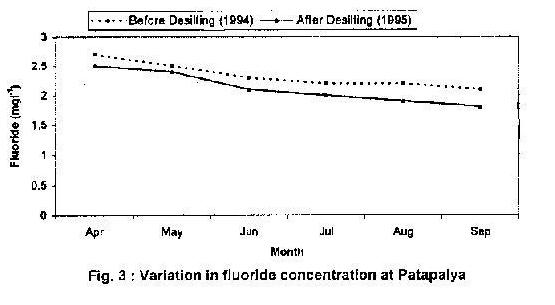
Table 3 presents the results of the chemical analysis of water samples collected from the observation well. The average fluoride content ranged from 1.1 to 1.7 mg/l. Water samples were collected from an existing borewell near the tank before and after desilting of tank. Table 4 shows the distribution of fluoride and other parameters in the existing borewell before and after desilting of tank and percentage decrease in fluoride concentration. It is seen from Fig 3 that the fluoride content, which was 2.7 mg/l during April 1994, reduced to 2.1 mg/l during September 1994 after desilting. In 1995 the fluoride content was 2.5 mg/l in April, and 1.8 mg/l in September after desilting.
Table 5 gives chemical parameters of water samples collected from the tank during different months from 1995 to 1997. It revealed that the minimum and maximum fluoride content was 0.2 and 1mg/l in June and April 1996 respectively. During May and June there was no runoff from the catchment area. Table 6 presents the results of the analysis of water samples collected from the hand pump close to the tank.
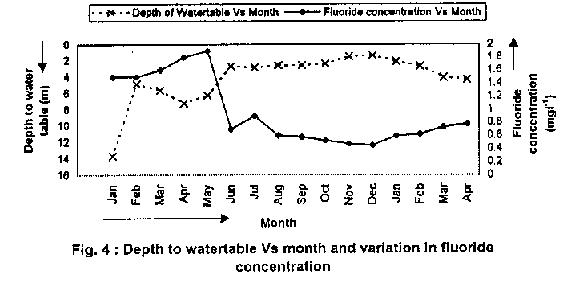
Table 7 and Fig 4 show the fluoride concentration of the water samples collected from the new observation well at various depths during different months. It shows the ground water table at a depth of 13.71m in January 1996 and 1.37m in December 1996. Maximum fluoride content of 1.9 mg/l was observed in June 1996, and the minimum of 0.45 mg/l was observed in December 1996. A rise in the ground water table was seen due to the recharge as a result of desilting the tank. It is also observed that the fluoride concentration reduced from 1.9 mg/l to 0.45 mg/l due to the increased recharge. It can be concluded that the desilting of tank is effective in reducing the fluoride content and controlling fluorosis.
| HEALTH STATUS: |
|
Dental fluorosis was observed in school going children and it declined after desilting of the tank. It was observed in the children even when water had fluoride content well within the permissible limits. Contrary to this, Coaster (1968) has reported a family in northern Tanzania that had been using groundwater containing fluoride of 10-14 mg/l for several generations without any harmful effects. Hence, revision of fluoride standard is necessary in India. A rigorous epidemiological/medical investigation is necessary to know the extent of fluorosis.
| CONCLUSION: |
|
The following conclusions can be drawn based on the above study:
| RECOMMENDATIONS: |
|
Any number of discussions on water, water quality, defluoridation of water, will not make sense to the masses, unless the information is closely linked with health aspects. Awareness should be created to use defluoridated water where there is a problem. Policy makers, Doctors, Public Health Engineers and NGO's can be involved in finding suitable methods to control fluorosis.
| ACKNOWLEDGEMENTS: |
|
Rajiv Gandhi National Drinking Water Mission, Govt. of India, and New Delhi funded the research project. The authors are thankful to Dr. H.S. Ningappa, Principal, SJCIT, Chikballapur for his help.
| REFERENCES: |
|
| TABLE 1 : RESULTS OF CHEMICAL ANALYSIS OF ROCK SAMPLES OF THE STUDY AREA (ALL VALUES IN PERCENT) |
|
|
Sl. No. |
Parameters |
R1 |
R2 |
R3 |
|
01. |
H2O |
0.49 |
0.30 |
0.24 |
|
02. |
SiO2 |
70.56 |
73.13 |
74.25 |
|
03. |
Al2O3 |
10.42 |
9.72 |
11.52 |
|
04. |
TiO2 |
0.52 |
1.04 |
0.78 |
|
05. |
Fe2O3 (total) |
3.50 |
2.26 |
4.43 |
|
06. |
FeO |
2.88 |
1.44 |
3.60 |
|
07. |
CaO |
4.20 |
2.80 |
1.40 |
|
08. |
MgO |
1.12 |
1.05 |
0.95 |
|
09. |
MnO |
0.03 |
0.04 |
0.04 |
|
10. |
P2O5 |
0.13 |
0.05 |
0.08 |
|
11. |
Na2O |
6.19 |
4.94 |
5.86 |
|
12. |
K2O |
2.04 |
6.48 |
3.17 |
|
13. |
LOI |
0.80 |
0.62 |
1.62 |
|
14. |
F |
0.80 |
0.15 |
0.16 |
|
15. |
Cl |
0.56 |
0.78 |
0.01 |
|
16. |
SrO |
0.01 |
0.01 |
0.01 |
| TABLE 2: RESULTS OF CHEMICAL ANALYSIS OF SOIL SAMPLES AND ROCK CUTTINGS THAT WERE COLLECTED FROM THE NEW OBSERVATION WELL SITE |
|
|
S No. |
Chemical parameters in % |
|||||||||||||
|
H2O |
SiO2 |
AL2O3 |
TiO2 |
Fe2O3 |
FeO |
CaO |
MgO |
MnO |
P2O5 |
Na2O |
K2O |
LOI |
F |
|
|
1 |
2.07 |
62.87 |
10.56 |
2.00 |
3.80 |
ND |
3.46 |
2.98 |
ND |
0.20 |
2.44 |
0.46 |
10.16 |
0.20 |
|
2 |
0.38 |
78.61 |
11.44 |
0.50 |
2.05 |
ND |
1.38 |
ND |
0.50 |
0.15 |
1.88 |
1.01 |
2.60 |
0.18 |
|
3 |
1.24 |
70.27 |
13.20 |
ND |
2.60 |
ND |
2.77 |
0.99 |
0.49 |
0.32 |
1.94 |
3.00 |
4.01 |
0.12 |
|
4 |
0.42 |
72.50 |
14.52 |
0.10 |
1.20 |
ND |
1.38 |
ND |
0.47 |
0.12 |
1.96 |
6.56 |
1.05 |
0.05 |
|
5 |
0.20 |
71.83 |
14.08 |
1.12 |
2.05 |
0.36 |
2.08 |
0.99 |
0.48 |
0.28 |
1.77 |
4.31 |
0.69 |
0.32 |
|
6 |
0.21 |
72.57 |
14.68 |
0.50 |
1.75 |
ND |
1.38 |
0.88 |
ND |
0.05 |
1.96 |
5.62 |
0.75 |
0.02 |
|
7 |
0.21 |
72.85 |
15.10 |
0.12 |
2.80 |
0.42 |
2.08 |
ND |
ND |
0.13 |
2.15 |
4.12 |
0.84 |
0.10 |
|
8 |
0.12 |
68.10 |
16.06 |
0.50 |
1.50 |
ND |
2.18 |
0.50 |
0.46 |
0.22 |
2.26 |
7.31 |
0.80 |
0.10 |
|
9 |
0.18 |
68.79 |
15.40 |
0.48 |
1.54 |
ND |
2.28 |
0.48 |
0.49 |
0.08 |
2.15 |
7.50 |
0.75 |
0.13 |
|
10 |
0.09 |
60.72 |
16.72 |
ND |
3.90 |
1.08 |
7.63 |
2.48 |
0.35 |
0.20 |
1.88 |
5.06 |
1.30 |
0.18 |
|
NOTE: - ND - Not Detected; Sample No. are as shown in Figure .2 |
||||||||||||||
| TABLE 3: RESULTS OF CHEMICAL ANALYSIS OF WATER SAMPLES FROM DIFFERENT DEPTHS AT THE NEW OBSERVATION WELL DRILLED ON 25-01-1996 |
|
|
Depth below ground level (m) |
pH |
Alkalinity |
Hardness (mgl-1) |
Fluoride (mgl-1) |
|
19.10 23.80 28.65 33.43 38.21 42.98 47.76 49.49 54.26 59.04 63.50 |
8.30 8.50 10.70 9.50 10.60 9.30 10.40 10.50 10.60 10.50 10.60 |
240.00 250.00 232.00 230.00 210.00 230.00 210.00 186.00 226.00 194.00 210.00 |
138.00 142.00 118.00 116.00 12.00 112.00 110.00 104.00 112.00 108.00 122.00 |
1.50 1.40 1.60 1.50 1.40 1.60 1.50 1.70 1.40 1.10 1.30 |
|
Total 17.00 |
||||
| TABLE 4: DISTRIBUTION OF FLUORIDE AND OTHER PARAMETERS IN THE EXISTING BORE WELL WATER IN THE PROJECT AREA BEFORE AND AFTER DESILTING OF THE TANK |
|
|
Before desilting (1994) |
After desilting (1995) |
||||||||
|
Month |
% reduction in Fluoride |
||||||||
|
pH |
Alkalinity |
Hardness |
Fluoride |
pH |
Alkalinity |
Hardness |
Fluoride |
||
|
(mgl-1) |
(mgl-1) |
(mgl-1) |
(mgl-1) |
(mgl-1) |
(mgl-1) |
||||
|
April |
7.90 |
278 |
266 |
2.70 |
7.70 |
288 |
325 |
2.50 |
7.41 |
|
May |
8.00 |
274 |
222 |
2.50 |
7.20 |
324 |
396 |
2.40 |
4.00 |
|
June |
7.30 |
280 |
232 |
2.30 |
7.80 |
335 |
320 |
2.10 |
8.70 |
|
July |
7.63 |
320 |
244 |
2.20 |
7.70 |
332 |
300 |
2.00 |
9.10 |
|
August |
7.60 |
310 |
262 |
2.20 |
7.60 |
340 |
304 |
1.90 |
13.64 |
|
September |
7.60 |
325 |
270 |
2.10 |
7.50 |
280 |
310 |
1.80 |
14.30 |
| TABLE 5: RESULTS OF CHEMICAL ANALYSIS OF THE TANK WATER SAMPLES COLLECTED DURING DIFFERENT MONTHS |
|
|
DATE |
pH |
Alkalinity (mgl-1) |
Fluoride (mgl-1) |
Hardness (mgl-1) |
|
10.10.1995 |
7.60 |
152 |
0.50 |
126 |
|
25.01.1996 |
7.80 |
156 |
0.60 |
120 |
|
14.03.1996 |
8.30 |
190 |
0.30 |
118 |
|
15.04.1996 |
7.40 |
148 |
1.00 |
122 |
|
24.05.1996 |
Tank Dry |
|||
|
11.06.1996 |
Tank Dry |
|||
|
25.06.1996 |
7.40 |
106 |
0.20 |
114 |
|
16.07.1996 |
7.40 |
110 |
0.30 |
80 |
|
10.08.1996 |
7.40 |
116 |
0.30 |
110 |
|
13.09.1996 |
7.50 |
120 |
0.30 |
120 |
|
16.10.1996 |
7.52 |
159 |
0.35 |
124 |
|
17.11.1996 |
7.60 |
190 |
0.42 |
132 |
|
05.12.1996 |
7.75 |
158 |
0.41 |
135 |
|
18.01.1996 |
7.90 |
162 |
0.56 |
128 |
|
10.02.1996 |
8.00 |
165 |
0.58 |
145 |
|
13.03.1996 |
8.05 |
169 |
0.60 |
133 |
|
18.04.1996 |
0.12 |
172 |
0.60 |
143 |
| TABLE 6: RESULTS OF CHEMICAL ANALYSIS OF WATER SAMPLES COLLECTED FROM THE HAND PUMP (RESIDENCE) IN PATHAPALYA VILLAGE |
|
|
Samples collected on |
Ph |
Alkalinity (mgl-1) |
Hardness (mgl-1) |
Fluoride (mgl-1) |
|
28.01.1996 |
8.59 |
257 |
152 |
1.55 |
|
14.03.1996 |
8.01 |
250 |
98 |
0.90 |
|
15.04.1996 |
7.50 |
156 |
86 |
1.68 |
|
24.05.1996 |
7.50 |
190 |
174 |
1.87 |
|
11.06.1996 |
7.50 |
226 |
250 |
1.95 |
|
25.06.1996 |
7.40 |
232 |
144 |
1.02 |
|
16.07.1996 |
7.57 |
135 |
156 |
0.98 |
|
10.08.1996 |
7.60 |
170 |
126 |
0.77 |
|
13.09.1996 |
7.70 |
175 |
112 |
0.72 |
|
16.10.1996 |
7.70 |
169 |
124 |
0.76 |
|
17.11.1996 |
7.82 |
182 |
139 |
0.67 |
|
05.12.1996 |
7.65 |
165 |
105 |
0.60 |
|
18.01.1996 |
7.87 |
170 |
132 |
0.72 |
|
10.02.1996 |
8.02 |
187 |
140 |
0.84 |
|
13.031996 |
8.25 |
220 |
136 |
0.98 |
|
18.04.1996 |
7.95 |
223 |
148 |
1.07 |
| TABLE 7: RESULTS OF THE CHEMICAL ANALYSIS OF THE TANK WATER SAMPLES COLLECTED FROM THE NEW OBSERVATION WELL SITE AND THE DEPTH TO GROUNDWATER TABLE |
|
|
Sample collected on |
Depth of GWT from |
pH |
Alkalinity (mg/L) |
Hardness (mg/L) |
Flouride (mg/L) |
|
28.01.1996 |
13.71 |
8.50 |
250 |
142 |
1.50 |
|
14.03.1996 |
4.87 |
7.90 |
160 |
86 |
1.50 |
|
15.04.1996 |
5.64 |
7.50 |
132 |
98 |
1.60 |
|
29.05.1996 |
7.24 |
7.50 |
140 |
100 |
1.80 |
|
11.06.1996 |
6.25 |
7.50 |
140 |
110 |
1.90 |
|
25.06.1996 |
2.74 |
7.50 |
162 |
96 |
0.70 |
|
16.07.1996 |
2.87 |
7.30 |
120 |
116 |
0.90 |
|
10.08.1996 |
2.63 |
7.50 |
165 |
99 |
0.60 |
|
13.09.1996 |
2.60 |
7.50 |
160 |
100 |
0.58 |
|
16.10.1996 |
2.42 |
7.45 |
155 |
95 |
0.52 |
|
17.11.1996 |
1.50 |
7.40 |
150 |
90 |
0.47 |
|
05.12.1996 |
1.37 |
7.40 |
145 |
86 |
0.45 |
|
18.01.1997 |
2.15 |
7.50 |
158 |
95 |
0.59 |
|
10.02.1997 |
2.70 |
7.90 |
170 |
112 |
0.62 |
|
13.03.1997 |
4.10 |
8.20 |
198 |
125 |
0.73 |
|
08.04.1997 |
4.39 |
8.25 |
212 |
135 |
0.78 |
| FIGURE-1: LOCATION MAP OF PATAPALYA TANK |
|
| FIGURE-2: DEPTH AT WHICH SAMPLES WERE COLLECTED AT THE NEW OBSERVATION WELL SITE |
|
| FIGURE-3: VARIATION IN FLUORIDE CONCENTRATION AT PATAPALYA |
|
| FIGURE-4: DEPTH TO WATERTABLE Vs MONTH AND VARIATION IN FLUORIDE CONCENTRATION |
|
| Address: |
|
1.) #40, Bellary Main Road,
Ganganagar,
Bangalore-32
2.) Assistant Executive Engineer,
RDPR,
Govt. of Karnataka
3.) Professor of Civil Engineering,
SJCIT,
Chikballapur
4.) Professor,
UGC-DSA Centre,
Central College Campus,
Bangalore University,
Bangalore
|
|
|