
|
|
|
| STUDY AREA |
Bangalore (77°37’19.54’’ E and 12°59’09.76’’ N), is the principal administrative, cultural, commercial, industrial, and knowledge capital of the state of Karnataka. With an area of 741 sq. km., Bangalore's city administrative jurisdiction was widened in 2006 (Greater Bangalore) by merging the existing area of Bangalore city spatial limits with 8 neighbouring Urban Local Bodies (ULBs), and 111 Villages of Bangalore Urban District (Ramachandra and Kumar, 2008; Ramachandra et al., 2012). Thus, Bangalore has grown spatially more than ten times since 1949 (69 square kilometres) and is a part of both the Bangalore urban and rural districts (figure 1). The mean annual total rainfall is about 880 mm with about 60 rainy days a year over the last ten years. The summer temperature ranges from 18° C – 38° C, while the winter temperature ranges from 12° C – 25° C. Bangalore is located at an altitude of 920 meters above mean sea level, delineating three watersheds, viz. Hebbal, Koramangala-Challaghatta and Vrishabhavathi watersheds (Figure 2). The undulating terrain in the region has facilitated creation of a large number of tanks providing for the traditional uses of irrigation, drinking, fishing, and washing. Bangalore had the distinction of having hundreds of water bodies through the centuries. Even in early second half of 20th century, in 1961, the number of lakes and tanks in the city stood at 262 (and spatial extent of Bangalore was 112 sq. km). However, number of lakes and tanks in 1985 was 81 (and spatial extent of Bangalore was 161 sq. km). This forms important drainage courses for the interconnected lake system (Figure 2), which carries storm water beyond the city limits. Bangalore, being a part of peninsular India, had the tradition of harvesting water through surface water bodies to meet the domestic water requirements in a decentralised way. After independence, the source of water for domestic and industrial purpose in Bangalore is mainly from the Cauvery River and ground water. Untreated sewage is let into the storm water drains, which progressively converge at the water bodies. Now, Bangalore is the fifth largest metropolis in India currently with a population of about 8.72 million as per the latest population census. Spatial extent of the city has increased from 69 (1941) to 161 (1981), 226 (2001) and 745 (2011) sq.km. Due to the changes in the spatial extent of the city, the population density varies from 5956 (1941) to 18147 (1981), 25653 (1991), 25025 (2001) and 11704 (2011) persons per sq.km.
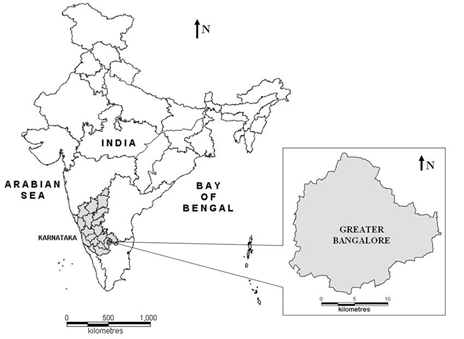
Figure 1: Study area –Bangalore
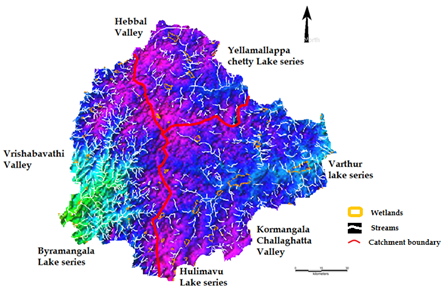
Figure 2: Watersheds (drainage with water bodies) of Bangalore
Land use analyses were carried out using supervised pattern classifier - Gaussian maximum likelihood classifier (GMLC) for Landsat and IRS data, and Bayesian Classifier (MODIS data). The method involved (Ramachandra et al., 2012): i) generation of False Colour Composite (FCC) of remote sensing data (bands – green, red and NIR). This helped in locating heterogeneous patches in the landscape ii) selection of training polygons (these correspond to heterogeneous patches in FCC) covering 15% of the study area and uniformly distributed over the entire study area, iii) loading these training polygons co-ordinates into pre-calibrated GPS, vi) collection of the corresponding attribute data (land use types) for these polygons from the field. GPS helped in locating respective training polygons in the field, iv) supplementing this information with Google Earth (latest as well as archived data), v) 60% of the training data has been used for classification, while the balance is used for validation or accuracy assessment.
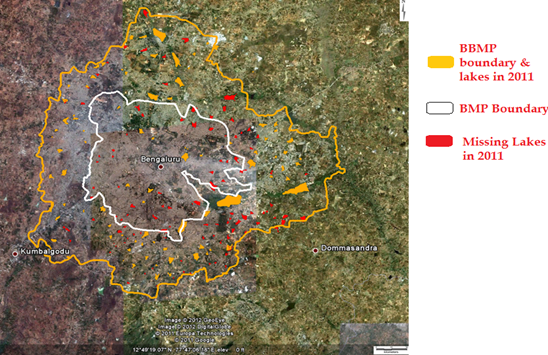
Land use analysis carried out using GRASS - Geographic Resources Analysis Support System (http://wgbis.ces.iisc.ac.in/ grass) for the period 1973 to 2010 and details are in table 1 and urban dynamics is illustrated in Figure 3. There has been a 632% increase in built up area from 1973 to 2010 leading to a sharp decline of 79% area in water bodies in Bangalore mostly attributing to intense urbanisation process. Analyses of the temporal data reveals an increase in urban built up area of 342.83% (during 1973 to 1992), 129.56% (during 1992 to 1999), 106.7% (1999 to 2002), 114.51% (2002 to 2006) and 126.19% (2006 to 2010). Figure 4 shows Bangalore with 207 water bodies (in 1973), which declined to 93 (in 2010). The rapid development of urban sprawl has many potentially detrimental effects including the loss of valuable agricultural and eco-sensitive (e.g. wetlands, forests) lands, enhanced energy consumption and greenhouse gas emissions from increasing private vehicle use (Ramachandra and Shwetmala, 2009). Vegetation has decreased by 32% (during 1973 to 1992), 38% (1992 to 2002) and 63% (2002 to 2010.
Disappearance of water bodies or sharp decline in the number of water bodies in Bangalore is mainly due to intense urbanisation and urban sprawl. Many lakes (54%) were encroached for illegal buildings. Field survey of all lakes (in 2007) shows that nearly 66% of lakes are sewage fed, 14% surrounded by slums and 72% showed loss of catchment area. In addition, lake catchments were used as dumping yards for either municipal solid waste or building debris (Ramachandra, 2009a). The surrounding of these lakes have illegal constructions of buildings and most of the times, slum dwellers occupy the adjoining areas. At many sites, water is used for washing and household activities and even fishing was observed at one of these sites. Multi-storied buildings have come up on some lake beds that have totally intervene the natural catchment flow leading to sharp decline and deteriorating quality of water bodies. This is correlated with the increase in built up area from the concentrated growth model focusing on Bangalore, adopted by the state machinery, affecting severely open spaces and in particular water bodies. Some of the lakes have been restored by the city corporation and the concerned authorities in recent times.
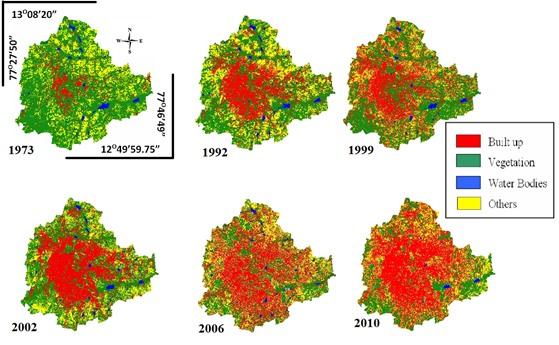
Figure 3: Bangalore in 1973, 1992, 1999, 2002, 2006, and 2010
Note -BMP: Bangalore Mahanagara Palike, BBMP: Bruhat Bangalore Mahanagara Palike
Figure 4: Bangalore with 207 water bodies (1973), 93 water bodies (2010)
Erstwhile Bangalore city 58 water bodies (1973), 10 water bodies (2010)
Table 1: Bangalore LC statistics
Class à |
Urban |
Vegetation |
Water |
Others |
||||
Year â |
Ha |
% |
Ha |
% |
Ha |
% |
Ha |
% |
1973 |
5448 |
7.97 |
46639 |
68.27 |
2324 |
3.40 |
13903 |
20.35 |
1992 |
18650 |
27.30 |
31579 |
46.22 |
1790 |
2.60 |
16303 |
23.86 |
1999 |
24163 |
35.37 |
31272 |
45.77 |
1542 |
2.26 |
11346 |
16.61 |
2002 |
25782 |
37.75 |
26453 |
38.72 |
1263 |
1.84 |
14825 |
21.69 |
2006 |
29535 |
43.23 |
19696 |
28.83 |
1073 |
1.57 |
18017 |
26.37 |
2010 |
37266 |
54.42 |
16031 |
23.41 |
617 |
0.90 |
14565 |
21.27 |
The temperature profile plot fell below the mean when a vegetation patch or water body was encountered on the transact beginning from the centre of the city and moving outwards eight directions along the transact as in figure 5. It is evident that major natural green area and water bodies act as microclimate moderators responsible for lower temperature (marked with circle in Figure 5). The spatial location of these green areas and water bodies are marked in figure 6.