|
RESULTS
Temporal change assessment done by overlaying Figure 2.2 (wetland map - 1996) over Figure 2.1 (wetland map-1973), showed a decrease of about 35% in the number of waterbodies over a period of two decades (23 years) assummarised in the table below. Region-wise spatial and temporal analyses is summarised in Table 2.
Table 2: Region-wise spatial and temporal analyses
| Region |
Area in sq. km |
No. tanks (1973) |
No. tanks(1996) |
Percentage loss, (no. of tanks) |
| North |
506.87 |
138 |
96 |
30.43 |
| South |
594.96 |
241 |
150 |
37.75 |
| Total |
1101. 8 |
379 |
246 |
34.09 |
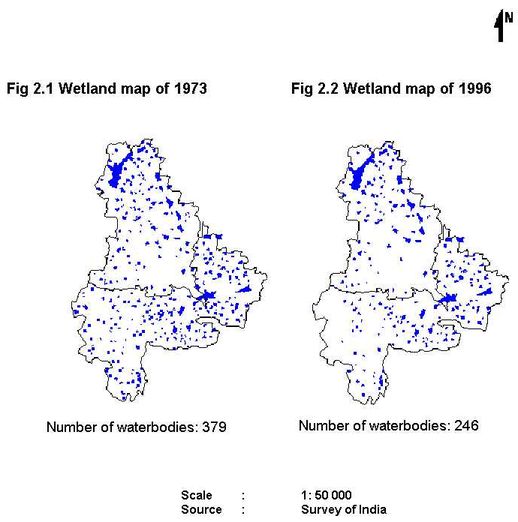
The results showed about 4.5% (49.56 sq. km.) of the total area studied (1102 sq. km.) was covered by the waterbodies. Further analysis showed a decrease of 133 waterbodies (North - 42, South - 91) over a period of twenty three years, owing to pressures from public spirited endeavors, projects/undertakings such as the public utility bus stand (e.g., Kampamudhi, Doddamudhi tanks), residential layouts, commercial establishments, stadium, recreation, etc.
These human induced stresses, mainly urbanization and unplanned growth, have led to the physical alterations some beyond redemption leading to decrease in both the spread area and water quality, and loss in drainage interconnectivity. A detailed drainage analyses was undertaken in Bangalore rural and urban districts, to assess the implications of urbanisation. Talukwise drainage network for urban district is given in Figure 3 while Figure 4 provides for Bangalore rural district.
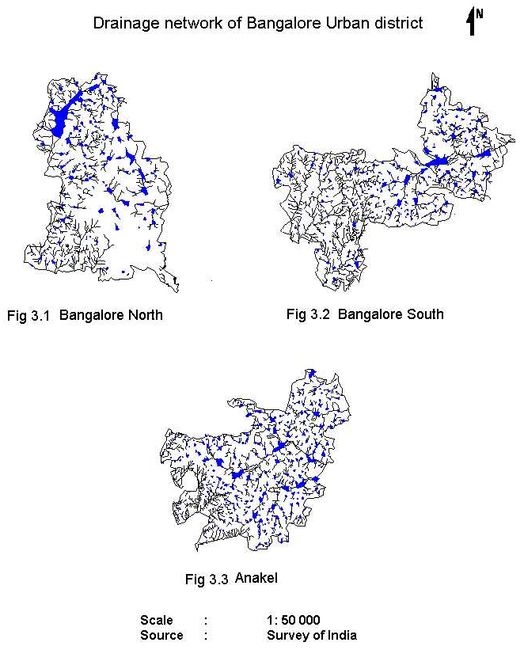
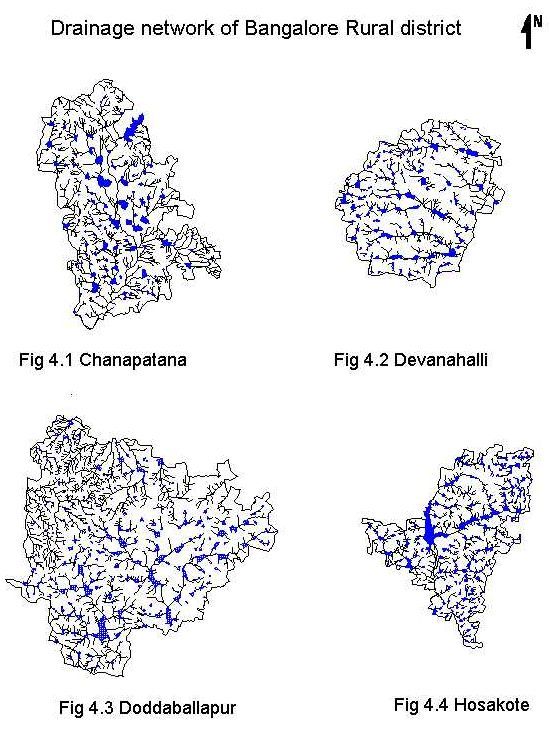
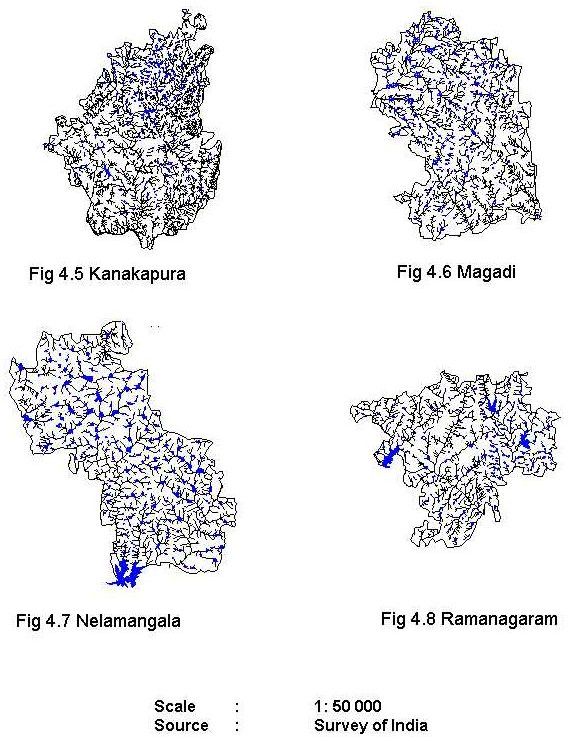
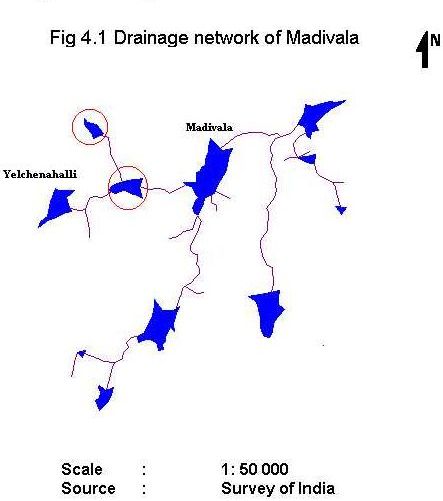
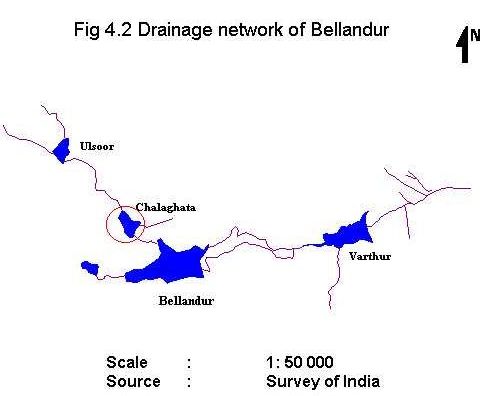
The comparative analysis of drainage network between Bangalore urban and rural showed that wetlands in Bangalore urban district were subjected to intense pressure due to the process of urbanisation and increasing population, resulting in loss of interconnectivity, in contrast to waterbodies in Bangalore rural where less pressures from direct human activities were noticed as shown in Figure 3. In order to identify the type of anthropogenic activities that has resulted in the loss in interconnectivity, Belandur and Madivala lake drainage network was studied in detail to assess the extent of loss and its implications.
In order to assess the impact of developmental activities, the wetland map of 1996 (generated with the help of IRS-1C data) was overlaid on the base map. This brings out the loss in connectivity between wetlands. Figures 5.1 and 5.2 shows the interconnectivity of lakes at Madivala and Bellandur with the adjacent lakes respectively. Due to conversion and encroachment of two water bodies, connectivity between Yelchenahalli kere and Madivala is lost as in the case of Bellandur and Ulsoor lakes with the conversion of Challegatta tank into a golf course. The GIS analyses revealed that due to developmental activities in the catchment area the drainage connectivity between the wetlands have been lost. This has resulted in the loss of wetlands, decreases in catchment yield, loss of water storage capacity (due to sedimentation etc.), and shrinkage in the wetland area, which has further led to depletion in the ground water table.
One of the significant functions of water bodies are, they act as recharge zones for groundwater. Reduction in water bodies has a serious impact on ground water level (bore wells) as is evident from the recent study that due to disappearance of lakes the ground water table has decreased from 35-40 feet to 250-300 feet in 20 years [Deepa et al, 1997]. The results from various studies support that decrease in the wetlands has also led to decrease in the habitat flora, fauna and migratory birds. This clearly indicates that apart from the decline in number and quality, there is a loss in terms of functions and values, to the ecosystem.
Status of water bodies: Physico, Chemical and Biological characterisation
The colour of the polluted waterbodies were mostly greenish, due to algal blooms and effluents from domestic and industrial sources. Turbidity in the waterbodies ranged from 1.0-25.0 NTU (Nephlometeric Turbidity Units) in cleaner waterbodies and 70.0-362.0 NTU in polluted waterbodies, mainly due to silt, organic matter and autochthonous sources (mainly planktons) from both point source (industries and domestic) and non-point source pollution (stormwater runoff), directly influencing the light penetration and affecting the production efficiencies in lakes.
The pH values of most water samples analysed showed to range from alkaline 7.6 - 9.3 to acidic. Kamakshipalya recorded 6.0 - 6.6 during the entire study period. Higher alkaline values were noticed at Yediur and Ulsoor tanks. At a given temperature, pH is controlled by the dissolved chemical compounds and the biological processes in the solution [Chapman, 1996]. The dissolved solids mainly consist of carbonates, sulphates, chlorides, nitrates and possibly phosphates of calcium, magnesium, sodium and potassium. High dissolved solids were noticed in all the studied lakes except Bannergatta and Sankey lakes ranging from 30.0-301.0 mg/L and 430.0-1024.0 mg/L in the polluted lakes such as Kamakshipalya and Yediur respectively. The suspended solids ranged from 52.2 mg/L to a high of 288.3 mg/L as a result of silt and matter in suspension.
The dissolved oxygen levels of the analysed waterbodies ranged from 1.2 mg/L in Kamakshipalya lake to 11.1 mg/L in Ulsoor and Yediur lakes largely due to photosynthetic activity. The recommended dissolved oxygen concentration for a healthy and ideally productive lake waterbody is 8 mg/L [Wetzel, 1973].
The contents of phosphates were found to be low, ranging from 0.06 mg/L to a high of 4.2 mg/L in Kamakshipalya lake. The standard is 0.2 mg/L for surface inland water [Chakarapani et al, 1996]. This parameter is very crucial and ecologically elusive, as it has the tendency to be precipitated by the many cations and accumulates at the bottom of the lake. The nitrate values ranged from 0.1mg/L to 2.7 mg/L. The standard for inland surface water is 0.1 mg/L [NEERI, 1988]. This parameter is very significant from the point of view of productivity in lakes.
The Chemical Oxygen Demand (COD), measures the oxygen equivalent of the organic and inorganic matter in a water sample that is susceptible to oxidation. COD as a result of pollution is largely determined by the various organic and inorganic materials (calcium, magnesium, potassium, sodium etc). The COD values ranged from 27mg/L in unpolluted waters to a high of 621 mg/L in Kamakshipalya.
Among the analysed heavy metals Iron and lead were shown to be present in greater concentrations than zinc and chromium.
Results of the present study showed that for most of the analysed parameters for five lakes (Ulsoor, Hebbal, Yediur, Kamakshipalya and Madivala) of the seven analysed exceeded the limits set by Indian Standard for Industrial and sewage effluents discharge [IS: 2490 -1982].
|


 Top
Top