 |
INFLUENCE OF PLANNING AND GOVERNANCE ON THE LEVEL OF URBAN SERVICES |
1 Energy & wetlands Research Group, Centre for Ecological Sciences, 2 Centre for Sustainable Technologies,
3 Centre for infrastructure, Sustainable Transportation and Urban Planning, Indian Institute of Science, Bangalore – 560 012, INDIA
Email: cestvr@ces.iisc.ac.in, cestvr@cistup.iisc.ac.in
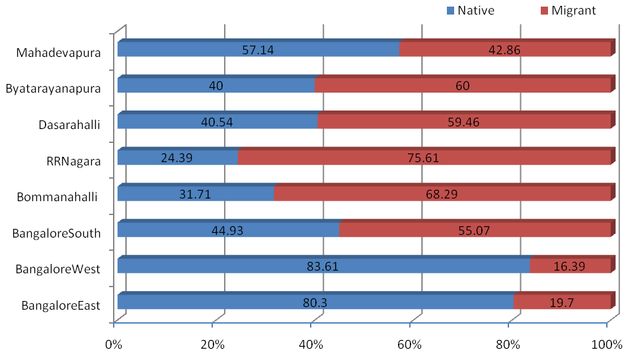
RESULTS AND DISCUSSIONS 1. Demography and Economy NativityAmong the first set of indicators that were enumerated based on the samples was the nativity of respondents (Figure 3) in different zones of BBMP. This indicates that Bangalore West and East zones had more than 80 percent natives while Bangalore South zone had only about 45 percent natives similar to most of the zones in the periphery. It appeared that most migrants were in Raja Rajeshwari Nagara zone followed by Bommanahalli, Byatarayanapura, and Dasarahalli zones.
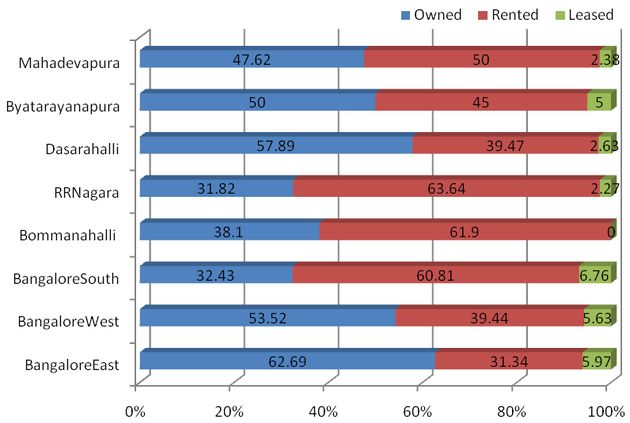
House Ownership, Type and Criteria for HousingThe next set of indicators addressed house ownership, housing type and criteria for housing. They appeared to be positively correlated but the correlation was not statistically significant (r= 0.68; p=0.065) with the houses owned and nativity. The percentage of residents living in rented houses appeared to be higher than those living in their own houses in Mahadevapura, Raja Rajeshwari Nagara, Bommanahalli and Bangalore South zones (Figure 4).
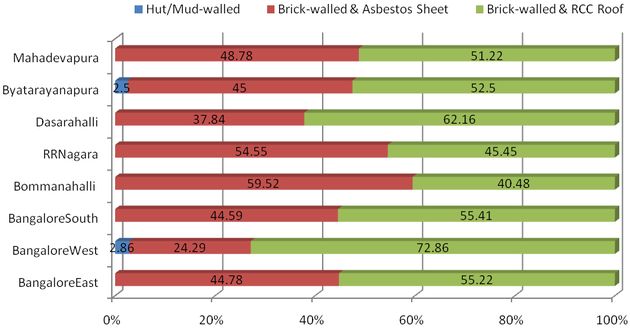
Further, majority of the houses were brick-walled with RCC roofing except fewer instances in Raja Rajeshwari Nagara and Bommanahalli, where majority of the houses were brick-walled with asbestos sheet roofing (Figure 5). The hut/mud walled type of houses mostly belonging to urban poor settlements was observed from Bangalore West and Byatarayanapura zones.
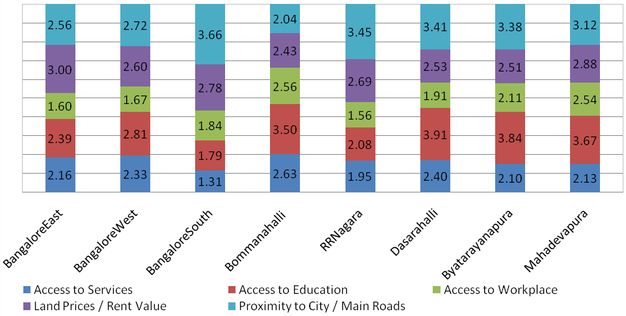
The criteria for choosing the new residence were ranked on a scale of 1 to 5, where 1 was the most preferred and 5 the less preferred. Among the choices provided were: access to services, access to education, access to workplace, land prices or rent value and proximity to city centre or main roads. Accordingly, the mean rankings for all the criteria are shown in Table 1: Mean ranking for housing criteria and Figure 6 with respect to each zone. It showed that ‘access to workplace’ emerged as the top criteria with a mean ranking of 1.97 followed by access to services (2.13), land prices or rent value (2.68), access to education (3.00) and proximity to city centre or main roads (3.04). The criteria of proximity to city centre or main road getting the least rank amongst the rest of the ranks suggests that residents may actually prefer to stay away from the city (even in the outskirts) as long as it is closer to their workplace and they have access to services. Table 1 : Mean ranking for housing criteria
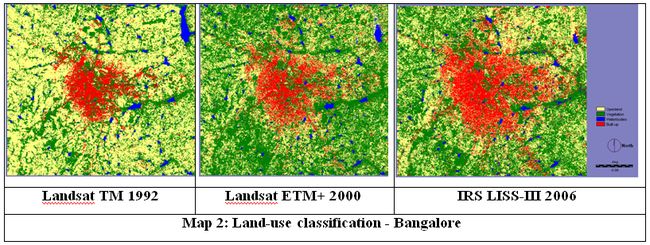
2. Environment and Resources 2.1. Land-useTypically the degree of urban growth or sprawl is attempted by quantifying the amount of paved surface or built-up area in a given region obtained from the classification of remotely sensed data or other geospatial data (Torrens and Alberti, 2000; Barnes et al., 2001; Galster et al., 2001; Epstein et al., 2002). Characterising the pattern of urban sprawl would then rest on noting the extent of built-up areas and its associated measures that depict sprawl based on the notion of built-up or paved area. A key aspect in the expansion of built-up area is its engulfing of surrounding open spaces within the landscape. i. Land-use Change DetectionThe spatial analysis was performed at the landscape level extending beyond the Greater Bangalore’s administrative boundary. The classified images for land-use in 1992, 2000 and 2006 are shown in Map 2. The extent of land-use during 1992, 2000 and 2006 comprised built-up with 142.54 sq. km, 186.42 sq. km and 301.27 sq. km respectively. Similarly, the extent of non-built-up area comprising open land, vegetation and water bodies were 1449.35 sq. km, 1405.42 sq. km and 1291.58 sq. km during 1992, 2000 and 2006 respectively. The land-use change analysis was carried out based on the differences in temporal land-uses. During 1992 to 2000, it is observed that the extent of built-up area has increased by 30.8 percent, while the built-up area increased by 61.61 percent during 2000 to 2006 (Table 2). The extent of increase in built-up area depicts only the magnitude of change and does not suggest the pattern of this transition. Analysing the probable land-use change from various non-built-up classes to built-up the cross-tabulation for the classified images were performed. It was noted that during 1992 to 2000, the land-use change from open land into vegetation was significant as the data corresponded to different seasons. The major land-use that contributed to the increase of built-up area was by the open land-use class. Similarly, during 2000 to 2006, the vegetation was the major land-use that was lost (by almost 180 sq. km) due to conversions into built-up areas. Table 2: Extent of Land-use change among Built-up and Non-built-up
ii. Land-use changes in Bruhat BangaloreThe proportion of land-use changes especially the percentage built-up area, which is a key metric to measure sprawl, were estimated across all the zones of Bruhat Bangalore Mahanagara Palike. The corresponding land-use changes within the BBMP region are shown in Table 3. It was clearly evident that on an average the increase in built-up area in the central zones was from 47.8 %, to 64.2 %, while in outer zones built-up area shot from a mere 6.8 % in 1992 to 25.6 %. This implies that the change in built-up areas in the central zones being about 35 % while the change in built-up areas in the outer zones was nearly 300 %. Perhaps the relatively higher percentage of built-up areas during 1992 in Dasarahalli zone and Mahadevapura zones with 10.04 % and 8.03 % respectively, may be due to the industrial estates in these locations while by 2006 this has increased to 30.32 % and 26.89 %. Further, while the change in built-up areas in central zones increased modestly, this indicated these zones were getting denser. However, it was noted that there was a slight reduction in the percentage built-up area in Bangalore West zone for 2000. Perhaps this should be viewed in the light of classification accuracies for the respective time data. Among the outer zones, Bommanahalli has witnessed the highest relative change in percentage built-up areas from 5.05 to 27.90 indicating the magnitude of growth in the region. Indeed this change in land-use here may be attributed to the IT based companies located in the region and the proximity to the Electronic city along the Hosur Road. Table 3: Percentage Built-up areas across zones
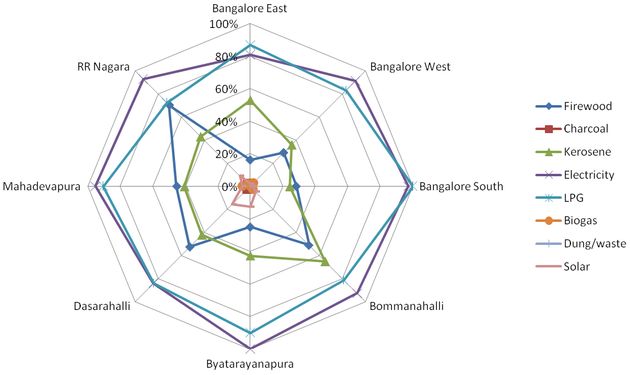
ii. Energy sourcesThe assessment of access to energy sources reveal that electricity and LPG were among the most widely accessed source (Figure 7). Firewood is still used mostly in the new zones especially Raja Rajeshwari Nagara, Bommanahalli, Dasarahalli and Mahadevapura zones followed by kerosene in Bommanahalli and Bangalore East zones. Perhaps, the availability of firewood being more accessible in the periphery of the city explains the larger number of residents accessing this source. It was further interesting to note that solar energy was being tapped mostly in the newly constructed houses in the new zones. The other energy sources that were accessed though not in large numbers were: charcoal, biogas and dung/waste. Electricity was the most accessed source for lighting and minimally for water heating and cooking, while LPG was the source accessed most for cooking. Firewood was used mostly for water heating followed by cooking.
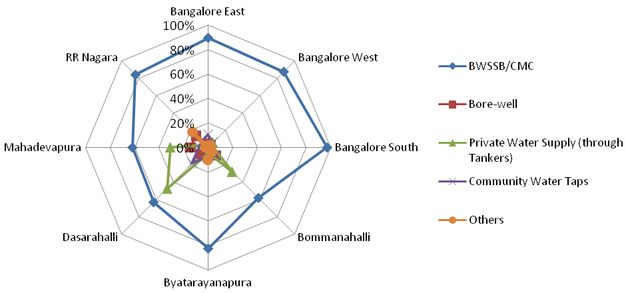
iii. Water, mode of disposal of wastewater and solid wasteWater is one of the key resources and therefore is accessed from different sources. In the central zones of Bangalore, viz. East, West and South, the source of supply was mainly from Bangalore Water Supply and Sewerage Board (BWSSB) for nearly 90 % of the residents (Figure 8). The erstwhile City Municipal Council (CMC) administered water supply with as much as 80 % to the outer zones of Byatarayanapura and Raja Rajeshwari Nagar. However, in the Bommanahalli, Dasarahalli and Mahadevapura zones 60 % of the respondents were serviced by CMC sources. This has resulted in residents sourcing water from private water supply (through tankers), followed by bore-wells, community taps and other sources in Bommanahalli, Dasarahalli and Byatarayanapura zones.
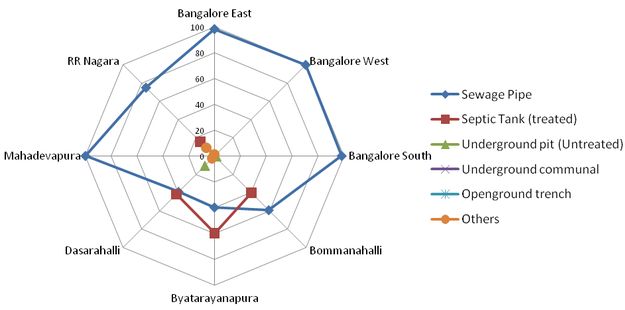
In spite of shortfalls in supplying water to all zones by the BWSSB and respective municipal councils, the sewage collection in the zones appeared to be well serviced through higher sewer connections (Figure 9). It was revealed that the central zones of Bangalore: East, West and South followed by Mahadevapura zone was serviced with sewer connections to almost 100 %. However, the outer zones of Bommanahalli, Byatarayanapura, Dasarahalli and Raja Rajeshawari Nagar zones were serviced between 60 to 80 %. Sewage disposal by way of septic tank was more prevalent in Dasarahalli, Byatarayanapura and Bommanahalli zones.
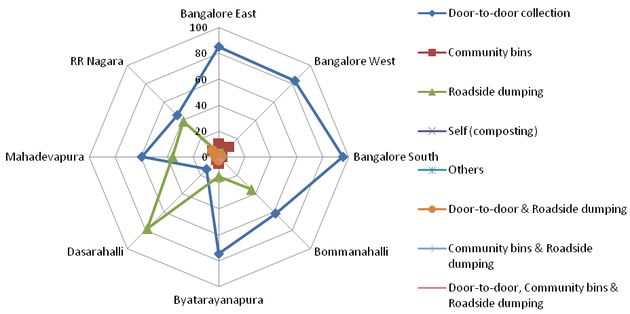
Similar to the water supply and sewage collection, the solid waste collection too indicated that the central zones of Bangalore: East, West and South were better serviced with more than 85 % of solid waste collected through door-to-door collection (Figure 10). Among the outer zones, only Byatarayanpura had a better coverage for the door-to-door collection with about 75 %, while Mahadevapura and Bommanahalli zones had coverage of about 60 %. The Raja Rajeshwari Nagara zone had coverage of about 50 % while Dasarahalli zone was the least covered with less than 20 % for door-to-door collection. In the zones where the door-to-door collection was poor, road-side dumping was more prevalent (Dasarahalli, Raja Rajeshwari Nagara and Bommanahalli zones) followed by disposal in community bins and a combination of all the above three methods of disposal.
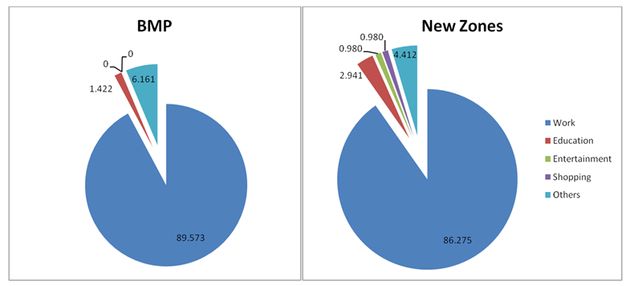
These indicators clearly depict that the central zones were well serviced in comparison to the outer zones in terms of water supply, wastewater collection and solid waste collection. This also brings out how different zones fare in delivery of these services. 3. Mobility One of the key city functions, that is regarded as a metric, is mobility, which determines why and how citizens are commuting within the city. This throws some light on the composition of people commuting for different purposes and modes employed for their commuting. This revealed that among the respondents in the central zones (East, West and South), almost 90 % commuted for their work, while few commuted for education and other purposes. However, in the outer zones, 86 % commuted for work, about 3 % for education, 1 % each for entertainment and shopping, followed by 4.4 % for other purposes (Figure 11).
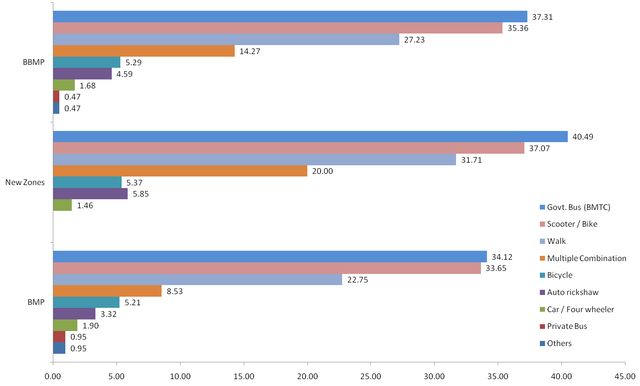
Addressing the modes employed for commuting (Figure 12), it was revealed that in all, 37 % used the bus-based public transport service (BMTC), followed by individual motor transport (2-wheelers with 35 %). It was startling to note that 27 % ‘walk’, while 14 % used a combination of different modes. About 5.3 % used bicycles, 4.6 % used auto-rickshaws and only 1.7 % four-wheelers. The rise in number of two-wheeler traffic in the city (around 1.8 million) explains the large percentage of people plying on the roads (35 %). However, the significant percentages who ‘walk’ strongly suggest adequate measures for facilitating safer pedestrian commuting. The percentage of respondents commuting by multiple combinations (14 %) includes different modes of bus, walk, two-wheelers, auto-rickshaws and four-wheelers, while this also masks the percentage of respondents exclusively commuting by four-wheelers (1.7 %).
4. Planning and Governance 4.1. PlanningPlanning and governance are imperative for ensuring effective service delivery and management of resources. As noted earlier, this set of indicators includes both quantitative and qualitative variables. The presence/absence of elected local body and their participation in planning are also considered. The indicators under planning and governance included: nature of urban local governance that prevailed until the formation of Greater Bangalore (BBMP), preparation and publication of master plans, public participation, and per capita expenditure in the budget of the local body (Table 4). The data to these were collected mainly from secondary sources. It can be seen that per capita expenditure is clearly more in case of the central zones (as it was under erstwhile BMP limits) while the neighbouring municipal councils have much lesser expenditure. Planning function is completely taken over by the parastatal agency, Bangalore Development Authority (BDA) and thus the local bodies have to abide by the policies formulated by the parastatal body. However, the effectiveness of solid waste collection in all the zones when compared with the per capita expenditure is positively correlated (r = 0.79, p = 0.018). Table 4: Indicators of planning and governance
# Based on Census of India (2001) 4.2. AccessibilitiesThe level of accessibilities to different amenities, services and healthcare were estimated based on the sample survey in all the zones. The level of access of services is meant as a proxy to assess the effectiveness of governance in different zones. The respondents were asked to rate according to the distances for accessing the different amenities (Table 5). The different amenities that were assessed are given in Table 6. Table 5 : Ranking criteria for level of access
Table 6: Amenities, services and healthcare assessed
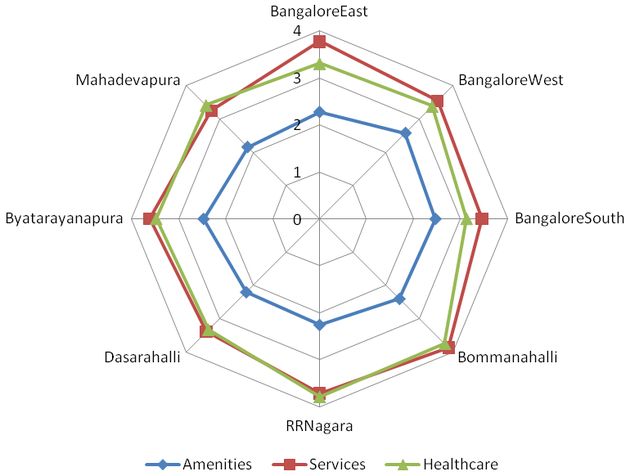
The ranking based on distances were useful in enumerating the proximity of the different services as accessed by the respondents. The mean ranking was considered for determining the overall level of access in different zones. In all, it was observed that the level of access scores (ranking) was almost similar in all the zones irrespective of the administrative differences (town and city municipals and city corporation limits) (Figure 13). This perhaps suggests that irrespective of the administrative jurisdictions, the level of services ranged almost similarly across the entire urban agglomeration. It was found that irrespective of governance and their level of services (mean rank of 3.57), the accessibilities to basic amenities (mean ranking of 2.34) were better and same in both central and outer zones. Further, there were no significant differences between services and healthcare (p=0.27) while they were significantly different from amenities (p=0.00093).
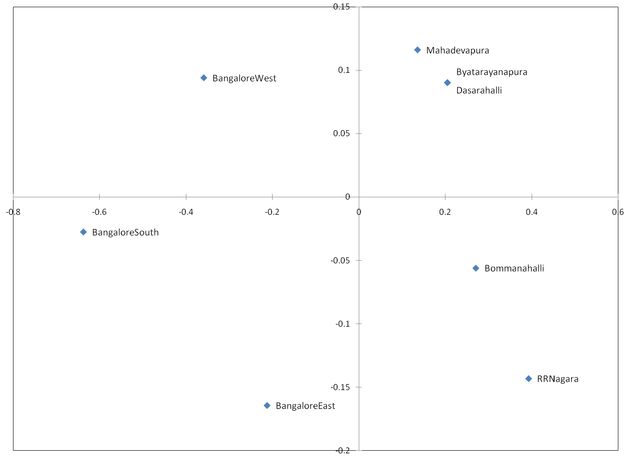
5. Implications of Planning and Governance on Sprawl & Level of Services In order to first explore any underlying structure within the zones of Greater Bangalore using the above set of indicators, non-metric multidimensional scaling (MDS) analysis was carried out. The variables so considered were population, per capita expenditure, amenities score, services score, healthcare score, nativity, house ownership, house-type: brick-walled and asbestos sheet, and brick-walled and RCC roof, access to energy sources: electricity, LPG, kerosene, firewood, solar and biogas, access to water: BWSSB/CMC, borewell, private water supply (tankers), community water taps, wastewater disposal by sewage pipe and solid waste disposal: door-to-door collection, community bins and roadside dumping.
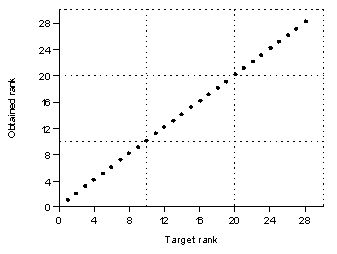
The statistical package PAST was used to perform the MDS. The resultant ordination plot is shown in Figure 14. Judging the goodness of the fit is normally through the interpretation of the stress value. In this case, the stress was found to be 0 indicating a perfect fit. An additional technique commonly used in judging the adequacy of an MDS solution is by the Shepard diagram. The corresponding Shepard diagram (Figure 15) reveals a monotonically increasing line implying that the MDS solution fits well.
The plot (Figure 14) reveals that the central zones of Bangalore: East, South and West are distinctively away from the outer zones. The outer zones - Mahadevapura, Byatarayanapura and Dasarahalli have positioned very close to each other, while Bommanahalli and Raja Rajeshwari Nagara zones are slightly away. In any case, the analysis brings out the distinctions with respect to each of the zones especially from those in the central and outer zones. This brings out the clear distinctions depicting the structural similarities (or dissimilarities) with respect to the different indicators considered for characterising sprawl. From the above analysis (through MDS) and enumeration of various indicators across the different zones of Greater Bangalore, it was evident that central areas and the outer areas were clearly different in several aspects. It is observed that the outer zones are considered the sprawl areas though they have been only recently merged with Greater Bangalore. Although the level of access to different services and amenities were the same across the different zones, the access to resources (water supply, energy, wastewater and solid waste disposal) was different across the central and outer zones. Further, with the effectiveness of planning and governance on the overall level of services (including that of resources), the outer zones had poor delivery of services while the central zones had better delivery of these services. Further, it was also found that the per capita expenditure was positively correlated with the solid waste collection (the solid waste management is the onus of the urban local body and hence this resource was compared with the per capita expenditure of the respective local bodies). This conforms to the theoretical framework proposed in Section 2.4, on the effect of planning and governance on services and extent of outgrowth (sprawl). Perhaps, with this outcome, this would suggest more effective governance in the outer zones to ensure better delivery of services through greater allocation of funds for the same. This can be further possible when planning and governance is proactive in forecasting the respective amenities, services along with necessary infrastructure in the these zones.  |
Citation : H. S. Sudhira and T. V. Ramachandra, 2011. Influence of planning and governance on the level of urban services. The IUP Journal of Governance and Public Policy, Vol. 6 no. 1 (March 2011).
| * Corresponding Author : | |||
Dr. T.V. Ramachandra |
|||