 |
INFLUENCE OF PLANNING AND GOVERNANCE ON THE LEVEL OF URBAN SERVICES |
1 Energy & wetlands Research Group, Centre for Ecological Sciences, 2 Centre for Sustainable Technologies,
3 Centre for infrastructure, Sustainable Transportation and Urban Planning, Indian Institute of Science, Bangalore – 560 012, INDIA
Email: cestvr@ces.iisc.ac.in, cestvr@cistup.iisc.ac.in
DATA, METHODS AND TOOLS The planning of resources and provision of amenities are interrelated and requires an understanding of the current consumption patterns and level of access to various services across different socio-economic classes. In the planning perspective, it is important to consider the effect of mobility on sprawl. It is in this context that it attempts to characterise the level of access to services, mobility patterns and consumption patterns of resources across Greater Bangalore. 1. Data Sources The data for the current study comprises both primary and secondary sources. In order to characterise the level of accession to services across Bruhat Bangalore Mahanagara Palike (BBMP) jurisdiction, a questionnaire-based household survey was conducted. Further to augment this with the spatial patterns of urban growth, remote sensing data was used. The following sections describe the strategy, size and mode of sampling for household survey and discuss on the satellite remote sensing data collection. The data were analysed by employing several analytical techniques discussed in the subsequent sections. 1.1. Questionnaire-based Household SurveyIn Bangalore, there are numerous agencies concerned with delivery of various services. Accordingly, most of their jurisdiction does not overlap and hence collecting and collating data from these agencies to analyse and interpret are impossible. Thus, it required a questionnaire-based household survey across different zones of Greater Bangalore to determine the level of access to different services from healthcare to amenities and infrastructure. i. Method of Sampling: Questionnaire-based Survey:The sampling was carried out based on a structured questionnaire aimed at capturing the dimensions of:
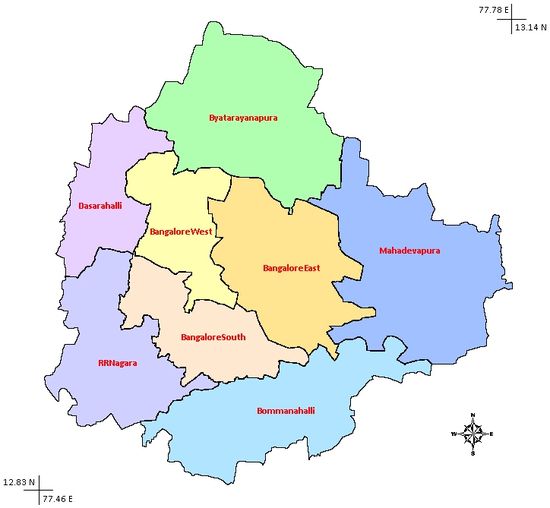
The questionnaire was initially piloted for a sample size of 20 households and then modified (tuned) appropriately based on the initial feedback. ii. Sampling Strategy and Sample SizeThe entire study area was stratified into two groups: one, the erstwhile city corporation limits-BMP area and two, the newly added regions of BBMP area. Map 1 depicts the regions accordingly. S = Z2 * N * E(1 – E) / [(A2 * N) + (Z2 * E(1 – E) )] where, Eight zones of Bruhat Bangalore comprises: 3 Zones of erstwhile BMP (with population of 4.5 millions) and 5 New Zones from CMCs and TMC (with population of 2.5 millions). For a sample size of 7 millions, with an error rate of 5%, precision range of 3% at 95% confidence level, the requisite sample size is 203. Further, distinguishing the earlier BMP (3 zones) region of 226 sq km and 5 new zones as two separate clusters, the total sample size for the survey were 421 (greater than approx. 203 x 2).
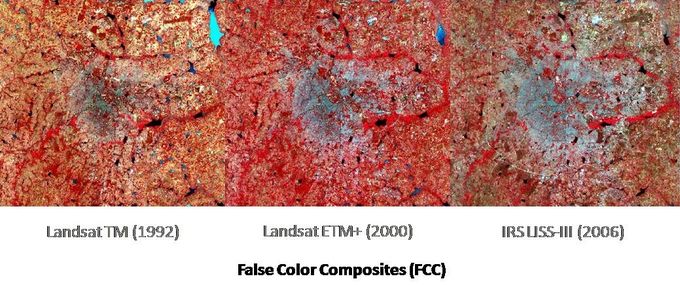
iii. Data Collection Stratified random sampling was undertaken capturing all the socio-economic classes in each zone based on house type. The number of samples in each zone was divided according to the low-income housing, middle-income housing and high income housing as different starting points. Accordingly, in the Bangalore East, Bangalore West and Bangalore South Zones the sample size were 75 each with about 7 starting points and 11 samples per starting point. In the five new zones, the sample size was about 42 each with about 7 starting points and 6 samples per starting point. 1.2. Satellite Remote Sensing DataThe remote sensing data for land cover by NASA’s Landsat TM for 1992 and Landsat ETM+ for 2000 was obtained from the Global Land Cover Facility (GLCF – http://www.landcover.org/), Institute for Advanced Computer Studies, University of Maryland, United States of America. The land cover data, IRS LISS-III for 2006 was obtained from the National Remote Sensing Agency, Hyderabad, India. 1.3. Secondary DataThe secondary data collected included the demographic details from the primary census abstracts for 1971, 1981, 1991 and 2001 from the Directorate of Census Operations, Census of India. Several other relevant data were obtained from various government departments including the Bruhat Bangalore Mahanagara Palike, Bangalore Development Authority, Bangalore Water Supply and Sewerage Board, Bangalore Metropolitan Transport Corporation, Bangalore City Police, Directorate of Economics and Statistics (Govt. of Karnataka), Karnataka State Pollution Control Board, Planning Commission of India, and Ministry of Urban Development (Govt. of India). 2. Research Method and Tools 2.1 Analysis of Survey DataThe analysis of the survey data began with their tabulation, sorting and exploratory data analysis. Exploratory data analysis restricted to estimation of averages and percentages for each of the parameter. The section on results presents these findings. The corresponding results were later tabulated according to the respective zones for undertaking further statistical analysis. i. Multidimensional ScalingIn order to explore any structural underlying patterns: similarities or dissimilarities in the data, the multivariate statistical analysis using multidimensional scaling (MDS) were employed. MDS is non-parametric version of the principal coordinate analysis (PCOA). Given an association matrix between the units under comparison, the method attempts to find a representation of the units in a given number of dimensions while preserving the pattern/ordering in the association matrix. MDS pictures the structure of a set of objects from data that approximate the distances between pairs of the objects. The data, which are called similarities, dissimilarities, distances, or proximities, reflect the amount of dissimilarity (between pairs of the objects). MDS programs attempts to minimise stress in order to obtain the MDS solution, while there exist, many versions of stress. The amount of stress may also be used for judging the goodness of fit of an MDS solution: a small stress value indicates a good fitting solution, whereas a high value indicates a bad fit. 2.2 Remote Sensing Data AnalysisThe remote sensing data are initially processed to quantify the land-use of Bangalore city broadly into four classes – built-up, agriculture and vegetation, open land, and water bodies. The multi-spectral data of Landsat TM and Landsat ETM+ with a spatial resolution of 30 m each and IRS LISS-III with a spatial resolution of 23.5 m were analysed using IDRISI Andes (Eastman, 2006; http://www.clarklabs.org). The image analyses included image registration, false colour composite (FCC) generation, enhancement and classification. The image geo-registration was rectified with respect to the ground control points collected from the geo-referenced Survey of India toposheets. The images were rectified using a linear mapping function for the ground control points and the nearest neighbourhood resampling type. After image geo-registration, the false colour composites were generated using the bands: green, red and near-infrared (Figure 2). The next step involved classification of the multi-spectral remote sensing data, which was carried through a two-stage classification process: unsupervised and supervised. The ISOCLUST module, which is an iterative self-organising unsupervised classifier based on a concept similar to the well-known ISODATA routine (Ball and Hall, 1965; In: Eastman, 2006) and cluster routines such as the H-means and K-means procedures was used for performing the unsupervised classification. In the unsupervised classification the number of clusters for classification was identified through the number of distinct peaks obtained from the histogram. For the supervised classification the signatures were derived from the training data obtained in the field using global positioning system (GPS) for distinctive land-uses and some of the land-use features obtained from unsupervised classification. The signatures were generated for each of the land-uses and were verified with the composite image. Based on these signatures, corresponding to various land features, supervised image classification was done using Gaussian Maximum Likelihood Classifier (Figure 2). The Maximum Likelihood classification is based on the probability density function associated with a particular training site signature. Pixels are assigned to the most likely class based on a comparison of the posterior probability that it belongs to each of the signatures being considered. This is also known as a Bayesian classifier since it has the ability to incorporate prior knowledge using Bayes' Theorem. Prior knowledge is expressed as a prior probability that each class exists. It can be specified as a single value applicable to all pixels, or as an image expressing different prior probabilities for each pixel (Eastman, 2006). Post classification from the IRS LISS-III data for 2006 was resampled to 30 m so as to enable comparison with the Landsat data outputs. The classification accuracy was tested for the classified images using some of the training data collected and generated during the classification process. These were compared with the classified land-uses with the actual land-use. For the recent (2006) IRS LISS-III data, there were ground control points obtained from the field that were used in comparison. However, for the earlier time data (1992 and 2000), some of the control points with known land-use classes were used as reference along with the false colour composite image to ascertain the accuracy of classified land-use classes. The classification accuracies of Landsat TM (1992), Landsat ETM+ and IRS LISS-III were 76.9 %, 84.6 % and 71.8 % respectively.
 |
Citation : H. S. Sudhira and T. V. Ramachandra, 2011. Influence of planning and governance on the level of urban services. The IUP Journal of Governance and Public Policy, Vol. 6 no. 1 (March 2011).
| * Corresponding Author : | |||
Dr. T.V. Ramachandra |
|||