RESULTS
Floristics
Data analysis showed a total of 93 tree species, 20 climber species, 33 shrubs, 2 orchids, 13 herb species, and 3 fern species (excluding those unidentified) distributed in 64 families and 136 genera (Table 1). Herb layer (inclusive of trees and shrub seedlings) had the highest number of families, genera and species of 52, 107, and 129 respectively followed by shrub (inclusive of tree saplings) and tree layer. The generic richness is highest in tree and shrub layers with genus Diospyros having 6 species, while herb layer has 5 species of Diospyros. However, when all the layers are considered Diospyros genus has 7 species. Terminalia follows this with 4 species in tree layer, Holigarna with 3 species in shrub layer and 3 species of Canthium in herb layer (includes tree and shrub seedlings). The highest percentage frequency of important tree families under all localities and vegetation types are Anacardiaceae (9.11), followed by Combretaceae (6.83), Lauraceae (6.6), Rubiaceae (6.6), Euphorbiaceae (5.4), Ebenaceae (5.2), Moraceae (5.0), Fabaceae (4.5), Meliaceae (4.5), Flacourtiaceae (4.3), Oleaceae (4.1), Cluseaceae (3.8), Lythraceae (3.18), Myristicaceae (3.18), Apocyanaceae (2.27), and all other families range below 1.82. In terms of the number of species the best represented families are Anacardiaceae, Fabaceae, Lauraceae, Rubiaceae with 7 species each, Ebenaceae (6), Combretaceae (5), Euphorbiaceae, Moraceae, Rutaceae, Sapindaceae and Myrtaceae with 4 species each, Flacourtiaceae, Clusiaceae and Meliaceae with 3 each, Palmae, Verbenaceae, Myristicaceae and Apocyanaceae with 2 each and other tree families have one species each.
Table 1. Total number of Families, Genera, and Species in entire study area.
| Vegetation Layers |
Families |
Genera |
Species |
| Tree layer |
39 |
72 |
93 |
| Shrub layer (Also Includes tree juveniles) |
45 |
86 |
109 |
| Herb layer (Also Includes tree and shrub seedlings) |
52 |
107 |
129 |
| Total (Trees, Shrubs and Herb layers) |
64 |
136 |
166 |
Tree layer
Hongod had high individuals of 520 trees per hectare. The lowest tree per hectare was found in Jamburmane with only 188 trees per hectare. But this did not assure higher basal area for Hongod as seen from the Table 2 with Adur having the highest basal area of 50.4 with a medium of 370 individuals per hectare. Kalmetlu and Munglimane follow this. Varamballi has a very low basal area of 15.6 inspite of having a higher total individual per hectare than Jambehalli and Jamburmane. Other localities like, Bellene-2, and Maithe have a lower basal area compared to their higher total individuals than Adur.
Table 2. Locality-wise basal area
| Sl |
Locality |
Tot ind/(ha) |
Basal area(ha) |
| 1 |
Adur |
370 |
50.47 |
| 2 |
Kalmetlu-1 |
413 |
45.14 |
| 3 |
Munglimane-1 |
394 |
44.57 |
| 4 |
Manjagalale |
313 |
40.42 |
| 5 |
Choudimane |
395 |
39.90 |
| 6 |
Kudurur |
388 |
39.68 |
| 7 |
Kelaginamane |
356 |
38.46 |
| 8 |
Bellenne-1 |
400 |
38.19 |
| 9 |
Hongod |
520 |
38.19 |
| 10 |
Mugimane |
458 |
37.70 |
| 11 |
Bellenne-2 |
500 |
37.65 |
| 12 |
Kalmetlu-2 |
413 |
34.41 |
| 13 |
H.kallukoppa |
283 |
32.68 |
| 14 |
Kanmane |
305 |
31.61 |
| 15 |
Hugadi |
305 |
31.34 |
| 16 |
Kadakod |
425 |
29.80 |
| 17 |
Jambehallli |
206 |
26.25 |
| 18 |
Munglimane-2 |
338 |
25.75 |
| 19 |
Maithe |
488 |
25.47 |
| 20 |
Thekale |
394 |
24.50 |
| 21 |
Jamburmane |
188 |
16.10 |
| 22 |
Varamballi |
255 |
15.60 |
A total of 26 endemic species is found with 25 % endemism. Percentage evergreen (PEv) is as high as 92.06 in Thekale and 90.9 in Kalmetlu-2 but with a lower percentage endemics (PEn). PEv occurs in varying degrees in other localities, obviously lowest in most of the moist deciduous forests as shown in Figure 2. High PEn is seen in Bellene-1 (semievergreen forest) of Bellene state forest and Majagalale (evergreen forest) with 62.5 and 64 respectively. Again most of the moist deciduous forests have lower PEn as low as 3.7 in Munglimane-2 and 5.3 in Kelaginamane.
Figure 2: Percentage Evergreen (Evg) and Western Ghats Endemism (WG) in the study localities
 and Western Ghats Endemism (WG) in the study localities.jpg)
Diversity, dominance, evenness and Important Value Index (IVI)
Thekale has the highest species richness of 6.82 with 34 tree species of in the entire transect. The Shannon diversity is high (3.13) in Kadagod with species richness of 6.75 and lowest dominance of 0.05. This is corroborated by High Simpson diversity and Pielou’s evenness. 6 localities (27%) have a Shannon value of less than 2.5 indicating a lesser diversity compared to the other localities. However, the two moist deciduous patches Jambehalli and Kelaginamane have lower Shannon value of 1.5 (Table 3). 11 localities (50%) have a better diversity of more than 2.5 but less than 3. Five localities (22%) have a fairly high diversity of more than 3 but less than 3.13 (Kalmetlu, Choudimane, Kadagod, Munglimane-1, and Varamballi). Localities having the highest diversity (e.g. Kadagod) are also having the lowest dominance of 0.05 as shown by Simpson dominance. Kelaginamane a moist deciduous patch having the lowest diversity (1.5) has the highest dominance (0.32) with lowest evenness of 0.67 (Pielou’s evenness value). Except Jambehalli showing low evenness of 0.71 other localities show evenness value of more than 0.8.
Table 3. Diversity in different localities-Tree layer
| Sl |
Locality |
Sps.richness |
H’ |
sim-dom |
D |
Pielou |
| 1 |
Varamballi |
6.358 |
3.045 |
0.059 |
0.941 |
0.934 |
| 2 |
Kalmetlu-1 |
6.206 |
3.079 |
0.058 |
0.942 |
0.934 |
| 3 |
Munglimane-1 |
6.517 |
3.079 |
0.058 |
0.942 |
0.924 |
| 4 |
Mugimane |
5.989 |
2.961 |
0.066 |
0.934 |
0.920 |
| 5 |
Kadakod |
6.753 |
3.134 |
0.054 |
0.946 |
0.913 |
| 6 |
Bellenne-2 |
4.066 |
2.518 |
0.105 |
0.895 |
0.908 |
| 7 |
Choudimane |
6.408 |
3.052 |
0.060 |
0.940 |
0.906 |
| 8 |
Adur |
5.808 |
2.943 |
0.067 |
0.933 |
0.903 |
| 9 |
Maithe |
4.591 |
2.746 |
0.082 |
0.918 |
0.902 |
| 10 |
Bellenne-1 |
5.530 |
2.863 |
0.072 |
0.928 |
0.901 |
| 11 |
H.kallukoppa |
4.821 |
2.604 |
0.099 |
0.901 |
0.901 |
| 12 |
Kalmetlu-2 |
4.290 |
2.481 |
0.113 |
0.887 |
0.895 |
| 13 |
Manjagalale |
4.601 |
2.603 |
0.098 |
0.902 |
0.884 |
| 14 |
Munglimane-2 |
3.034 |
2.082 |
0.169 |
0.831 |
0.868 |
| 15 |
Hugadi |
4.865 |
2.604 |
0.112 |
0.888 |
0.855 |
| 16 |
Kudurur |
4.846 |
2.603 |
0.107 |
0.893 |
0.855 |
| 17 |
Jamburmane |
3.152 |
2.125 |
0.157 |
0.843 |
0.828 |
| 18 |
Kanmane |
3.649 |
2.274 |
0.145 |
0.855 |
0.820 |
| 19 |
Hongod |
6.029 |
2.749 |
0.108 |
0.892 |
0.817 |
| 20 |
Thekale |
6.823 |
2.852 |
0.098 |
0.902 |
0.809 |
| 21 |
Jambehallli |
2.288 |
1.569 |
0.315 |
0.685 |
0.714 |
| 22 |
Kelaginamane |
2.226 |
1.556 |
0.321 |
0.679 |
0.676 |
Note: H’ = Shanon Weiner diversity index, D: Simpson diversity index
The Important Value Index (IVI) of 140.4 in Jambehalli and 114.2 in Kelaginamane show Xylia xylocarpa species dominating these localities (Table 4). Hence, they have lowest evenness values. Terminalia paniculata and Olea dioca are the most common species occurring in 4 localities each with highest IVI. Xylia xylocarpa dominates in 3 localities. For each 3 species IVI is high in 2 localities, and other 5 species have high IVI in only one locality each (Table 5).
Table 4. Trees with highest Important Value Index (IVI) in different localities
| Sl |
Locality |
Species |
IVI |
Pielou |
| 1 |
Jambehallli |
Xylia xylocarpa |
140.37 |
0.714 |
| 2 |
Kelaginamane |
Xylia xylocarpa |
114.25 |
0.676 |
| 3 |
Kalmetlu-2 |
Lophopetalum wightianum |
87.94 |
0.895 |
| 4 |
Jamburmane |
Terminalia paniculata |
67.65 |
0.828 |
| 5 |
Munglimane-2 |
Terminalia paniculata |
65.51 |
0.868 |
| 6 |
Kudurur |
Olea dioca |
59.16 |
0.855 |
| 7 |
Hugadi |
Xylia xylocarpa |
58.92 |
0.855 |
| 8 |
Kanmane |
Terminalia paniculata |
58.38 |
0.820 |
| 9 |
Bellenne-2 |
Olea dioca |
55.07 |
0.908 |
| 10 |
Bellenne-1 |
Lagerstroemia lanceolata |
51.39 |
0.901 |
| 11 |
Hongod |
Aglaia anamallayana |
51.34 |
0.817 |
| 12 |
Kalmetlu-1 |
Lophopetalum wightianum |
48.07 |
0.934 |
| 13 |
Thekale |
Aglaia anamallayana |
47.91 |
0.809 |
| 14 |
Manjagalale |
Canarium strictum |
47.25 |
0.884 |
| 15 |
Maithe |
Terminalia paniculata |
47.09 |
0.902 |
| 16 |
Choudimane |
Diospyros assymilis |
40.07 |
0.906 |
| 17 |
Munglimane-1 |
Olea dioca |
39.06 |
0.924 |
| 18 |
H.kallukoppa |
Artocarpus hirsutus |
38.55 |
0.901 |
| 19 |
Mugimane |
Holigarna annottiana |
34.97 |
0.920 |
| 20 |
Varamballi |
Artocarpus hirsutus |
31.30 |
0.934 |
| 21 |
Adur |
Mimosops elengi |
30.58 |
0.903 |
| 22 |
Kadakod |
Olea dioca |
23.82 |
0.913 |
Table 5. Number of localities having same species with highest IVI
| Sl.No |
Species |
Localities |
| 1 |
Terminalia paniculata |
4 |
| 2 |
Olea dioca |
4 |
| 3 |
Xylia xylocarpa |
3 |
| 4 |
Lophopetalum wightianum |
2 |
| 5 |
Artocarpus hirsutus |
2 |
| 6 |
Aglaia anamallayana |
2 |
| 7 |
Mimosops elengi |
1 |
| 8 |
Lagerstroemia lanceolata |
1 |
| 9 |
Holigarna annottiana |
1 |
| 10 |
Diospyros assymilis |
1 |
| 11 |
Canarium strictum |
1 |
Shrub layer
PEv was calculated considering only the tree saplings in shrub layer. The PEv was more in shrub layer compared to tree layer in most of the localities showing that the forests are still supporting good regeneration of evergreens. Highest PEv was seen in Mugimane and Bellene-2 with only evergreen tree saplings with no deciduous species (Figure 3). In 13 localities PEv was more than 80 % compared to 6 in tree layer. In deciduous forests of Jamburmane, Kelaginamane and Jambehalli the PEv is less than 15 %. In Maithe there are no evergreen juveniles compared to 32 % PEv in tree layer. Percentage endemism and diversity was calculated for shrub layer, which included all shrubs and tree saplings. Results show that 17 localities of tree layer had more PEn than shrub layer (5 localities) (Figure 4). This shows that though the regeneration of evergreens is high in shrub layer most of them are nonendemics and hardy evergreen species. In Jamburmane, Kelaginamane, Jambehalli and Maithe both the PEv and diversity are very less. Except in Varamballi, Kalmetlu, Munglimane-2 and Jambehalli, tree layer has a higher Shannon diversity compared to shrub layer (Figure 5). This may be due to high dominance of some shrubs such as Psycotria flavida, Eupatorium sp, Dichapetalum gelonoides etc in shrub layer. As seen from Figure 6 diversity decreases as dominance increases with highest dominance in Bellene-2.
Figure 3. Percentage evergreen in Tree and Shrub layer
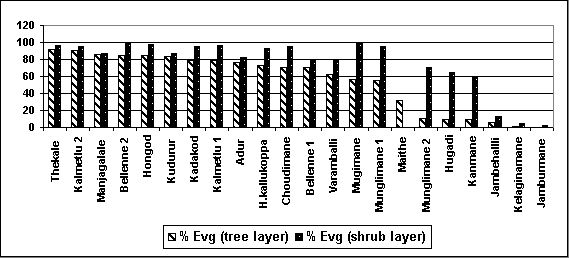
Figure 4. Percentage Endemism of Tree and Shrub layer in different localities
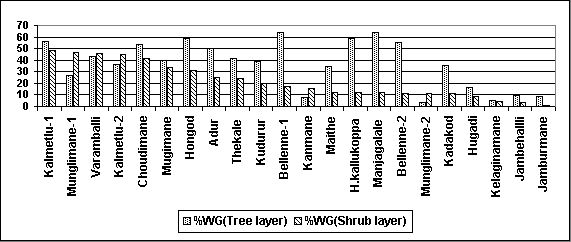
Figure 5. Shannon-Weiner’s diversity index for tree, shrub and herb layers.

Figure 6. Simpson’s Diversity, Dominance and Pielou’s Evenness for shrub layer

Herb Layer
Herb layer consisting of tree seedlings, shrub seedlings and other herb species shows a richer diversity compared to tree or shrub layer. 17 localities have more than 2.5 Shannon diversity compared to tree layer with 16 localities and 7 localities in shrub layer. Mugimane has the highest Shannon and Simpson diversities, and lowest Simpson dominance. Evenness value is also high next to Munglimane-2 (Table 6).
Table 6. Species richness, H’, D, Simpson dominance and Pielou's evenness for herb layer
| Sl |
Locality |
Sps.rich |
H’ |
Sim dom |
D |
Pielou |
| 1 |
Adur |
7.56 |
3.06 |
0.073 |
0.927 |
0.813 |
| 2 |
Bellenne-1 |
5.44 |
2.79 |
0.089 |
0.911 |
0.858 |
| 3 |
Bellenne-2 |
3.85 |
2.53 |
0.095 |
0.905 |
0.914 |
| 4 |
Choudimane |
6.77 |
3.12 |
0.067 |
0.933 |
0.871 |
| 5 |
H.kallukoppa |
7.67 |
2.84 |
0.108 |
0.892 |
0.743 |
| 6 |
Hongod |
6.49 |
3.00 |
0.078 |
0.922 |
0.850 |
| 7 |
Hugadi |
6.28 |
2.94 |
0.079 |
0.921 |
0.840 |
| 8 |
Jambehallli |
6.17 |
2.38 |
0.178 |
0.822 |
0.664 |
| 9 |
Jamburmane |
5.89 |
2.76 |
0.108 |
0.892 |
0.769 |
| 10 |
Kadakod |
7.68 |
2.97 |
0.088 |
0.912 |
0.789 |
| 11 |
Kalmetlu-1 |
6.37 |
2.84 |
0.102 |
0.898 |
0.834 |
| 12 |
Kalmetlu-2 |
5.77 |
2.78 |
0.093 |
0.907 |
0.898 |
| 13 |
Kanmane |
5.12 |
2.76 |
0.093 |
0.907 |
0.821 |
| 14 |
Kelaginamane |
2.30 |
1.89 |
0.195 |
0.805 |
0.819 |
| 15 |
Kudurur |
5.64 |
2.33 |
0.213 |
0.787 |
0.679 |
| 16 |
Maithe |
4.77 |
2.24 |
0.186 |
0.814 |
0.659 |
| 17 |
Manjagalale |
5.31 |
2.69 |
0.095 |
0.905 |
0.809 |
| 18 |
Mugimane |
7.41 |
3.34 |
0.045 |
0.955 |
0.924 |
| 19 |
Munglimane-1 |
6.43 |
3.11 |
0.056 |
0.944 |
0.913 |
| 20 |
Munglimane-2 |
4.82 |
2.79 |
0.069 |
0.931 |
0.949 |
| 21 |
Thekale |
4.86 |
2.39 |
0.171 |
0.829 |
0.711 |
| 22 |
Varamballi |
6.14 |
2.84 |
0.090 |
0.910 |
0.805 |
Note: H’ = Shanon Weiner diversity index, D: Simpson diversity index