|
Results
Land use Land Cover dynamics:
1. Vegetation cover analysis: Vegetation cover of the study area assessed through NDVI . Figure 3a for Mysore shows that area under vegetation has declined to 9.24% (2009) from 51.09% (1973). Figure 3b for Shimoga shows that vegetation decreased from 89% in 1992 to 66 % in 2010.Figure 3c and 3d shows the results for Hubli and Dharwad, which shows decrease in vegetative cover by 20%. Temporal NDVI values are listed in Table IV.
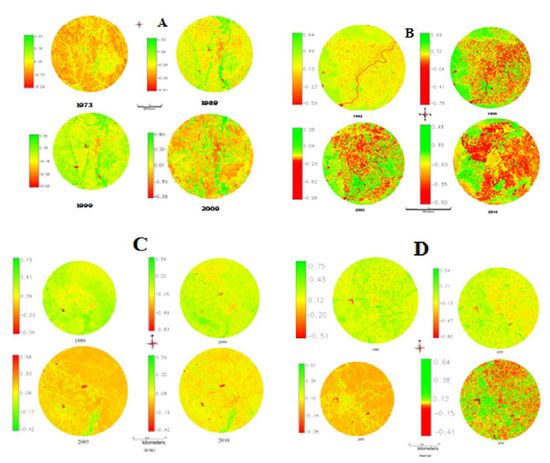
Figure 3: Temporal Land cover changes
Table IV: Temporal Land cover details
| Mysore |
Shimoga |
| Year |
Vegetation
% |
Non vegetation % |
Year |
Vegetation
% |
Non vegetation % |
| 1973 |
51.09 |
48.81 |
1992 |
10.65 |
10.65 |
| 1989 |
57.58 |
42.42 |
1999 |
21.08 |
21.08 |
| 1999 |
44.65 |
55.35 |
2005 |
25.16 |
25.16 |
| 2009 |
09.24 |
90.76 |
2010 |
33.28 |
33.28 |
| Hubli |
Dharwad |
| Year |
Vegetation % |
Non vegetation % |
Year |
Vegetation % |
Non vegetation % |
| 1989 |
97.0 |
3.0 |
1989 |
98.12 |
1.88 |
| 2000 |
94.35 |
5.65 |
2000 |
96.48 |
3.52 |
| 2005 |
89.73 |
10.27 |
2005 |
92.21 |
7.79 |
| 2010 |
78.31 |
21.69 |
2010 |
86.43 |
13.57 |
2. Land use analysis: Land use in Mysore was assessed for the period 1973 to 2009 using Gaussian Maximum Likelihood Classifier (MLC) and results for temporal period are listed in Table V and the same is depicted in figure 4A. The overall accuracy of the classification ranges from 75% (1973), 79% (1989), 83% (1999) to 88% (2009) respectively. There has been a significant increase in built-up area during the last decade evident from 514% increase in urban area. Other category also had an enormous increase and covers 166 % of the land use. Consequent to these, vegetation cover has declined drastically during the past four decades. The water spread area has increased due to the commissioning of waste water treatment plants (ex. Vidyaranyapura, Rayankere, Kesare) during late 90’s and early 2000. In Shimoga Urban category has increased from 13% (1992) to 33% (2010) (figure 4B), which is about 253 times during the last two decades. Notable factor is that the Cultivation which is the major land use in the study region has increased to a small extent. Vegetation had decreased drastically over last two decades from 30% (1992) to about 6% (2010). Hubli showed a drastic increase in urban area which grew by 14 % in past 4 decades. Dharwad also showed a sharp increase in urban area by over 6%, All these results indicated that the water body and the watershed regions are decreasing every decade.
Table V: Temporal land use details
| Mysore |
Shimoga |
| Land use |
Urban
% |
Vegetation
% |
Water
% |
Others
% |
Land use |
Urban
% |
Vegetation
% |
Water
% |
Cultivation
% |
| Year |
Year |
| 1973 |
1.1 |
53.23 |
0.61 |
45.06 |
1992 |
13.58 |
30.94 |
1.52 |
53.95 |
| 1989 |
1.2 |
65.89 |
0.39 |
32.60 |
1999 |
25.32 |
24.82 |
1.51 |
48.35 |
| 1999 |
3.6 |
41.57 |
0.58 |
54.2 |
2005 |
28.16 |
10.09 |
1.12 |
60.62 |
| 2009 |
18.68 |
5.76 |
0.12 |
74.84 |
2010 |
33.56 |
5.52 |
1.2 |
59.72 |
| Hubli |
Dharwad |
| Land use |
Urban
% |
Vegetation
% |
Water
% |
Others
% |
Land use |
Urban
% |
Vegetation
% |
Water
% |
Cultivation
% |
| Year |
Year |
| 1989 |
1.08 |
0.22 |
0.64 |
98.06 |
1989 |
0.62 |
1.43 |
0.51 |
97.45 |
| 2000 |
2.25 |
0.45 |
0.98 |
96.31 |
2000 |
1.93 |
1.41 |
1.13 |
95.52 |
| 2005 |
9.85 |
0.71 |
0.74 |
88.70 |
2005 |
3.75 |
1.29 |
0.25 |
94.71 |
| 2010 |
14.62 |
0.42 |
0.65 |
84.30 |
2010 |
6.47 |
0.69 |
0.47 |
92.36 |
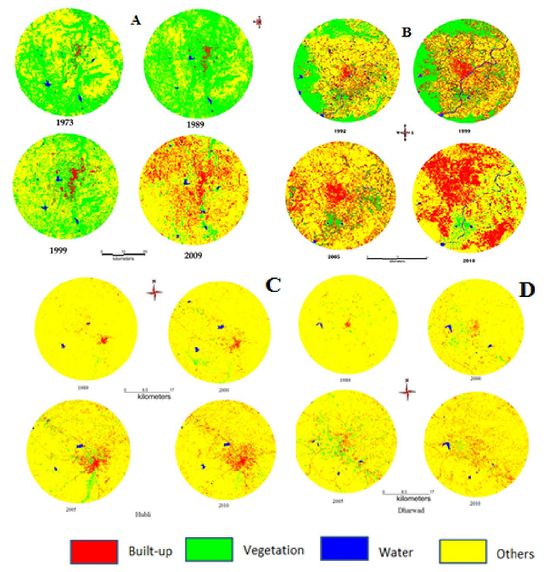
Figure 4:.Land use Changes observed temporally
3. Urban sprawl analysis: Shannon entropy computed using temporal data are listed in Table VI. Mysore in recent times exhibit the dispersed growth as values are gradually picking up and the threshold value (log (8) = 0.9). However, the region experienced dispersed growth in 90’s reaching higher values of 0.452 (NE), 0.441 (NW) in 2009 during post 2000’s. The entropy computed for the city (without buffer regions) shows the sprawl phenomenon at outskirts. Shannon's entropy values of recent time confirms of fragmented dispersed urban growth in the city. This also illustrates and establishes the influence of drivers of urbanization in various directions. The Shimoga analysis show of sprawl in the North West, while significant growth was observed in North East, South East and South west but fragmented due to presence of cultivable land in these regions. The threshold value being (log (12) = 1.079). Hubli analysis showed the sprawl is high is the south east and south west regions with a value close to 0.5, threshold value being 1.079 and Dharwad also has growth over past 4 decade, which also shows that the value as high as 0.2, where the threshold value was 0.845. The results of Shannon entropy are tabulated below (Table VII)
Table VI: Shannon Entropy Index
| Mysore |
Shimoga |
|
NE |
NW |
SE |
SW |
|
NE |
NW |
SE |
SW |
| 2009 |
0.452 |
0.441 |
0.346 |
0.305 |
1992 |
0.23 |
0.24 |
0.18 |
0.25 |
| 1999 |
0.139 |
0.043 |
0.0711 |
0.050 |
1999 |
0.39 |
0.41 |
0.34 |
0.36 |
| 1992 |
0.060 |
0.010 |
0.0292 |
0.007 |
2005 |
0.4 |
0.45 |
0.38 |
0.43 |
| 1973 |
0.067 |
0.007 |
0.0265 |
0.008 |
2010 |
0.43 |
0.7 |
0.42 |
0.47 |
| Hubli |
Dharwad |
|
NE |
NW |
SE |
SW |
|
NE |
NW |
SE |
SW |
| 1989 |
0.027 |
0.02 |
0.055 |
0.011 |
1989 |
0.011 |
0.013 |
0.008 |
0.006 |
| 2000 |
0.029 |
0.053 |
0.102 |
0.042 |
2000 |
0.016 |
0.023 |
0.014 |
0.018 |
| 2005 |
0.146 |
0.09 |
0.21 |
0.059 |
2005 |
0.08 |
0.086 |
0.09 |
0.0745 |
| 2010 |
0.369 |
0.134 |
0.49 |
0.128 |
2010 |
0.168 |
0.164 |
0.213 |
0.216 |
4. Spatial patterns of urbanisation: In order to understand the spatial pattern of urbanization, Three landscape level metrics were computed zonewise for each circle. These metrics are discussed below:
Number of Urban Patches (Np) is a landscape metric indicates the level of fragmentation and ranges from 0 (fragment) to 100 (clumpiness). Figure 5A, for Mysore illustrates that the city is becoming clumped patch at the center, while outskirts are relatively fragmented. Clumped patches are more prominent in NE and NW directions and patches are agglomerating to a single urban patch. Shimoga show that center is in the verge of clumping especially accelerated in 2005 and 2010 (figure 5B), while the outskirts remain fragmented and are highly fragmented during 2005 and 2010 in North east, south east and south west directions. North west zone is losing its vegetation and cultivation class and this zone is highly fragmented in the outskirts during 2005 but is now in the verge of forming a single built up class. Figure 5C and 5D explains the state of land use in Hubli and Dharwad. Hubli and Dharwad also like other cities is tending to clumped center growth, while outskirts are highly fragmented.
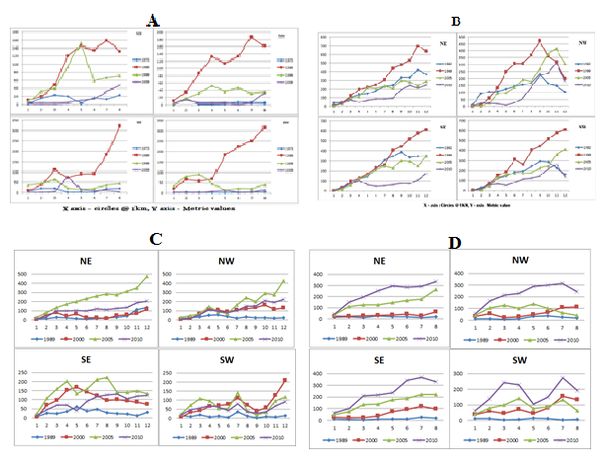
Figure 5: Number of urban patches (zonewise, circlewise)
Normalized Landscape Shape Index (NLSI): NLSI is 0 when the landscape consists of single square or maximally compact almost square, it increases as patch types becomes increasingly disaggregated and is 1 when the patch type is maximally disaggregated. Figure 6A indicates that the landscape had a highly fragmented urban class, which became further fragmented during 80’s and started clumping to form a single square in late 90’s especially in NE and NW direction in all circle and few inner circles in SE and SW directions. Figure 6B indicate that the urban area is almost clumped in all directions and gradients especially in north east and north west directions. It shows a small degree of fragmentation in the buffer regions in south west and south east direction. The core area is in the process of becoming maximally square in all directions. Figure 6C and 6D is the results of analysis of Hubli Dharwad region, which indicates that the city center is tensing to simple shaped compact growth, while outskirts are convoluted and fragmented.
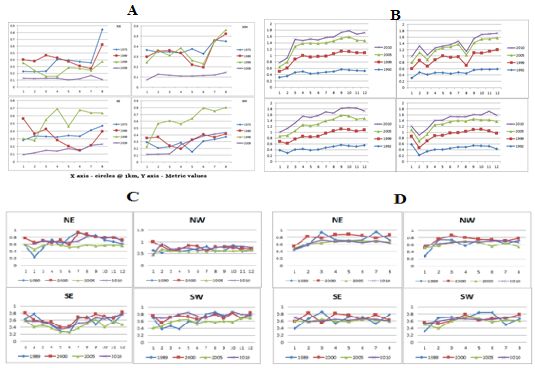
Figure 6: Normalised landscape shape index
Clumpiness index equals 0 when the patches are distributed randomly, and approaches 1 when the patch type is maximally aggregated. Mysore analysis highlights that the center of the city is more compact in 2009 with more clumpiness and aggregation in NW and NE directions. In 1973 the results indicate that there were a small number of urban patches existing in all direction and in every circle and due to which disaggregation is more. Post 1999 and in 2009 we can observe large urban patches very close almost forming a single patch especially at the center and in NW direction in different gradients (Figure 7A). Results for Shimoga (Figure 7B) are indicative of the clumpiness of the patches at the central core and buffer region and are fragmented in the outskirts. Analysis of the Hubli (Figure 7C) region showed highly fragmented outskirts, whereas Dharwad (Figure 7D) analysis showed comparatively less fragmentation
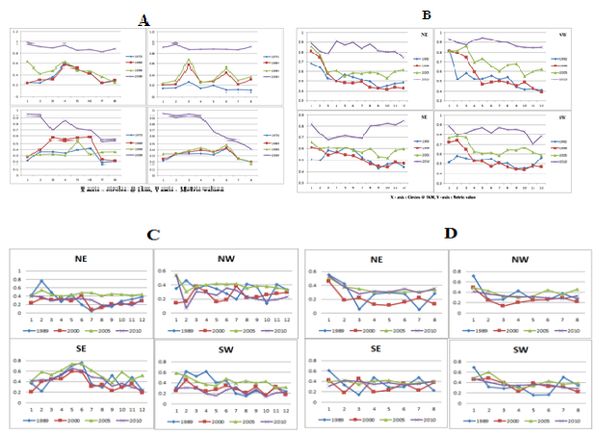
Figure 7: Clumpiness Index
|
