 |
Applications of GIS and Remote Sensing for Mangrove Management in Uttara Kannada, Karnataka State |
 |
1Energy and Wetlands Research Group, Centre for Ecological Sciences [CES], Indian Institute of Science, Bangalore – 560012, India.
*Corresponding author: cestvr@ces.iisc.ac.in
|
MATERIALS AND METHODS
Study area
Honavar forest division is located between 74° 17’ 31.83” to 74° 44’ 56.52 east long. and 13° 55’ 27.91 to 14° 41’ 20.50” north lat. and extends over an area of 1409.42 sq.km, towards the coastal zone of Uttara Kannada, a hilly and heavily wooded district in central Western Ghats (Figure 1). There are four west flowing rivers in the district which merge with the Arabian Sea forming towards their mouths estuarine areas. There are also several small creeks also with mangroves. The estuary of Aghanashini River is the largest (5236 ha), followed by Sharavathi-Badgani (3415 ha), Gangavali (817 ha) and Venkatapur (219 ha).
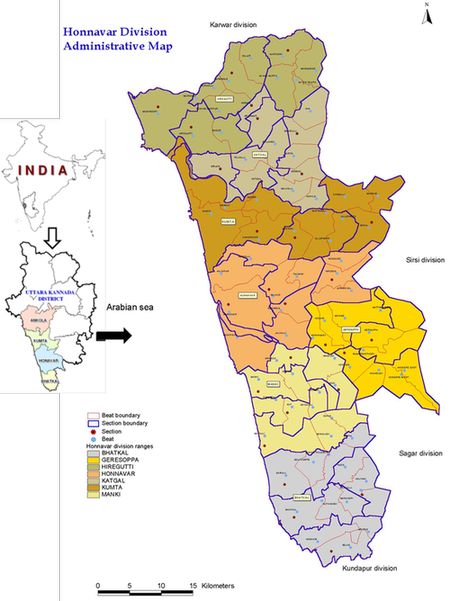
Figure 1 : Location of Study area
Method
Estuarine area with mangrove areas and potential areas available for planting in four river estuaries and several minor creeks in the Honavar Forest Division were digitized using open source GIS software (QGIS). Google Earth & Bing Earth Tile images were used for depicting the estuaries, mangrove areas and potential areas for planting. Mangrove areas were identified and mapped in the field using GPS readings and their areas estimated in ha. The mangrove areas and potential areas for planting are depicted on the administrative maps of the forest division to the smallest unit, the beat, for the convenience of the beat guard. The estuaries were gridded and sample surveys were made in selected grids for mangrove species composition and tree density. Estuarine water post monsoon salinity was measured and depicted on maps as high (>15 ppt), medium (5-15 ppt) and low (<5 ppt). Mangrove species composition in any specific grid was correlated to salinity status of the grid. In general mangrove species of the study region were brought under three categories namely high, medium and low salinity mangroves. The GPS readings of mangrove tree species which covers minimum 5X5 meter canopy area were recorded and species-wise area under tree mangrove distribution was estimated with the help of the RS data 2010 IRS p6 L4 MX 5M having resolution of 5 m, using remote sensing software (GRASS). Using images of estuaries during low tides and with the help of bathymetric maps areas suitable for mangrove planting was also estimated.
|
|
Citation : Prakash N. Mesta, Settur Bharath, Vishnu D.M., Mahima Bhat, Subash Chandran M.D. and Ramachandra. T.V, 2012. Applications of GIS and Remote Sensing for Mangrove Management in Uttara Kannada, Karnataka State., Proceedings of the LAKE 2012: National Conference on Conservation and Management of Wetland Ecosystems, 06th - 09th November 2012, School of Environmental Sciences, Mahatma Gandhi University, Kottayam, Kerala, pp. 1-9.
|