|
RESULTS AND DISUSSION
Drinking water quality
The summary of descriptive analytical results of the 98(n) well samples for various physiochemical and biological parameters are presented in table 2. Among 98 samples phycico-chemical and biological parameters of only nine sample's Attathodu, Pampa Valley, Athikayam, Vadaserikara, Pandalam (Pathinamthita district), Kandiyoor (Alapuzha), Kattachal (Kollam), Pazhayidam (Kottayam) and Nedumangadu (Thiruvananthapuram) were within desirable limit as per BIS.
Table 2: Summary of physical, chemical and biological properties of groundwater.
| Parameters |
Units |
Average |
Median |
Minimum |
Maximum |
SD |
| pH |
- |
6.3 |
6.3 |
4.3 |
8.2 |
0.7 |
| WT |
ºC |
29.9 |
29.9 |
23.2 |
36.2 |
2.1 |
| Salinity |
ppm |
352.9 |
192.1 |
14.8 |
4310.0 |
651.3 |
| EC |
µS |
694.9 |
375.7 |
2.5 |
8640.0 |
1307.0 |
| TDS |
ppm |
488.7 |
266.5 |
22.2 |
6060.0 |
913.6 |
| DO |
mg/l |
3.3 |
3.2 |
0.0 |
7.5 |
1.5 |
| NO3¯ |
mg/l |
10.7 |
7.4 |
0.1 |
50.0 |
10.5 |
| Alk |
mg/l |
69.1 |
38.0 |
4.0 |
408.0 |
78.4 |
| HCO3¯ |
mg/l |
83.0 |
45.6 |
4.8 |
489.6 |
94.1 |
| Cl¯ |
mg/l |
64.6 |
41.0 |
17.0 |
921.0 |
99.5 |
| Hardness |
mg/l |
97.9 |
64.0 |
12.0 |
700.0 |
111.1 |
| Ca2+ |
mg/l |
25.0 |
18.4 |
1.6 |
157.1 |
25.7 |
| Mg2+ |
mg/l |
17.8 |
11.2 |
0.2 |
141.5 |
22.8 |
| Na+ |
mg/l |
63.2 |
28.7 |
2.6 |
1203.2 |
165.2 |
| K+ |
mg/l |
13.6 |
5.4 |
0.6 |
160.7 |
24.1 |
| F¯ |
mg/l |
0.4 |
0.4 |
0.2 |
1.6 |
0.2 |
| SO42¯ |
mg/l |
18.8 |
9.2 |
0.0 |
200.7 |
30.4 |
| PO43¯ |
mg/l |
0.1 |
0.1 |
0.0 |
1.3 |
0.2 |
| Faecal coliform |
MPN/100ml |
72.79 |
17 |
0 |
1600 |
204.48 |
WT - water temperature, TDS - total dissolved solids, EC - electrical conductivity, DO - dissolved oxygen, SD - standard deviation.
The places having many parameters out of desirable limit are Fort Cochin (Ernakulam district), Placimada and Kollengode (Palakkad) and Koodungalur (Thrissur). The parameters exceeding the desirable limit in each district is given in table 3. Among the parameters analysed MPN and pH was the out of desirable limit in many samples via. 66 and 61 samples respectively. Overall, 89 samples are affected by one or more parameters, thereby, causing the 90.82% of groundwater in the study area unsuitable for drinking.
Table 3: Number of parameters exceeding the desirable limit per district
| District |
No. of samples analysed |
No. of samples exceeding the DL with one or more parameters |
Parameters exceeding the DL |
| Alappuzha |
7 |
6 |
pH, NO3¯, F¯, TDS, sal, MPN |
| Ernakulam |
8 |
8 |
pH, alk, har, Ca2+, Mg2+, TDS, sal, MPN |
| Idukki |
5 |
5 |
pH, NO3¯, Mg2+, MPN |
| Kannur |
5 |
5 |
pH, Mg2+, MPN |
| Kasargod |
11 |
11 |
pH, MPN |
| Kollam |
6 |
5 |
pH, Mg2+, TDS, MPN |
| Kottayam |
7 |
6 |
pH, MPN |
| Kozhikode |
7 |
7 |
pH, MPN |
| Malappuram |
6 |
6 |
pH, Ca2+, TDS, MPN |
| Palakkad |
8 |
8 |
pH, alk, Cl¯, har, Mg2+, F¯, TDS, sal, MPN |
| Pathanamthitta |
7 |
2 |
pH |
| Thiruvananthapuram |
7 |
6 |
pH, TDS, MPN |
| Thrissur |
9 |
9 |
pH, alk, Cl¯, har, Ca2+, Mg2+, SO42¯, TDS, sal, MPN |
| Wayanad |
5 |
5 |
pH, MPN |
Sal - salinity, TDS - total dissolved solids, Alk - alkalinity, Har - hardness, DL - desirable limit.
Physico-chemical parameters analysed to characterize the water based on BIS standards are:
pH
Most of the groundwater samples n=86 were acidic in nature remaining 12 samples were alkaline. Among 86 samples, 61 were found to have pH (4.32-6.46) less than the desirable limit (6.5–8.5). It is shown spatially in the Fig. 2. The low pH of groundwater may be the result of sulphide oxidation (Weiner 2000), acidic nature of the soil or due to aquifer origin (Harikumar and Kokkal 2009). This can be curbed by adding clam or oyster shells to drinking water in the wide-mouthed barrels (Bordalo and Savva-Bordalo 2007). Low pH was observed in the Idukki, (Rejith et al. 2009), Kottayam (Vijith and Satheeshm 2007), Muvattupuzha (Gopinath and Seralathan 2006; Laluraj and Gopinath 2006) districts and Kabbini, Periyar and Neyyar river basins (Harikumar and Kokkal 2009).
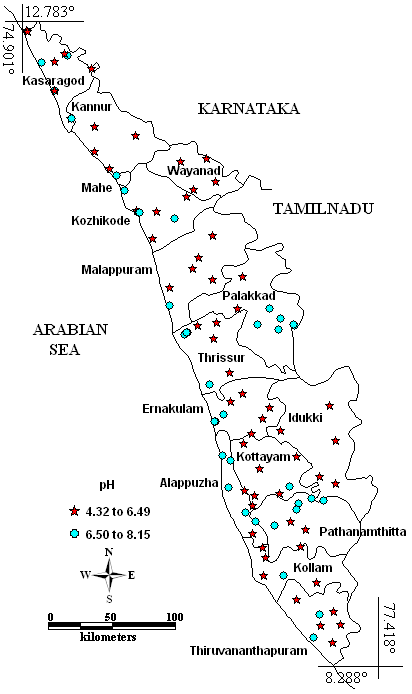
Fig. 2 – Spatial variation of pH
Salinity
Most of the samples (89 out of 98) were lying within the fresh water salinity range (< 500 ppm). Salinity was found higher in the Aluva (2900 ppm) and Kothamangalam (3000 ppm) of Ernakulam district and in Guruvayoor (3180 ppm) well used by municipal and Koodungalur (4310 ppm) in Thrissur district. This may be due to the addition of more chlorides in municipal well for disinfection purpose or sea water intrusion. Comparatively, another sample from Guruvayoor near a pilgrimage site had very less salinity (590 ppm) than that of Guruvayoor municipal well. Other samples having more salinity were from Palakkad (Kollengode and Placimada), Thrissur (Chavakkad and Koodungalur) and Alapuzha (Veeyapuram) districts, had salinity between 600 to 900 ppm.
TDS
The TDS range was 22.2 to 6060 ppm. The highest value 6060 ppm was found in Koodungalur (Thrissur district). The TDS was more than desirable limit of 500 ppm in Thrissur (eight samples), Ernakulam (four), Palakkad (three), Malappuram (one), Alapuzha (one), Kollam (one) and Thiruvananthapuram (one) districts. Evaporation, groundwater movement through solute mineral containing rocks, untreated sewage, waste deposits and agrochemicals are the main contributors to high TDS value. The difference in the taste of non potable and potable water is often due to the presence of high TDS level in water addition to certain metals, particularly iron, copper, manganese and zinc (Weiner 2000). The high TDS values were observed by Shaji et al. (2009) in Chavara, Quilon district and Harikumar and Kokkal (2009) from Kabbini, Periyar and Neyyar river basins.
Magnesium
Magnesium was more than desirable limit of 30 mg/l in many places at Palakkad and the highest value was found at Koodungalur (Thrissur)141.46 mg/l. Magnesium mainly comes from the ferromagnesium minerals in igneous rocks and magnesium carbonates in sedimentary rocks than the anthropogenic sources (Weiner 2000). Concentrations greater than 125 mg/l can have a cathartic and diuretic effect (APHA 1995). Magnesium contamination was found more in Palakkad (five samples) followed by Thrissur (three), Ernakulam (one), Idukki (one), Kollam (one) and Kannur (one). The majority of samples were with in the desirable limit, which indicates that the Mg2+ is contributed by the natural precesses. The study conducted by Harikumar and Kokkal (2009) also found high value in Periyar and Neyyar river basins.
Hardness
Five out of 98 samples exceeded the desirable limit 300 mg/l. In this, three samples were from the Palakkad and rest of the samples from the Ernakulam and Thrissur districts. Among these districts Thrissur (Kodungallur)() had the highest value 700 mg/l of hardness. The principal sources of hard water are calcium and magnesium carbonates (Weiner 2000). Harikumar and Kokkal (2009) also found hardness values lying beyond the desirable limit in the Kabbini, Periyar and Neyyar river basins (Harikumar and Kokkal 2009).
Alkalinity
Alkalinity exceeded the desirable limit of 200 mg/l at Placimada (340 mg/l) and Kollengode (408 mg/l) in Palakkad, Fort Cochin (352 mg/l) and Koodungalur (304 mg/l) in Ernakulam and Thrissur districts respectively. The important constituents contributing alkalinity are bicarbonate (HCO3¯), carbonates (CO32-), and hydroxyl (OH¯) anions (Weiner 2000). The highest value of alkalinity was observed by Harikumar and Kokkal (2009) in the Neyyar river basin.
Chlorides
Chlorides exceeded the desirable limit of 250 mg/l at Placimada 314.35 mg/l, Kollengode 268.29 mg/l in Palakkad district and Koodungalur 921.01 mg/l in Thrissur district. All other samples (n=95) were with in the desirable limit. In natural waters, chloride comes from weathering of chloride minerals. People having heart and kidney problems have high risk when exposed to high amount of chlorides (Weiner 2000). Laluraj et al. (2005) in the coastal zone of central Kerala and Harikumar and Kokkal (2009) in the Kabbini and Neyyar river basins found the chloride values are beyond desirable limit.
Calcium
Three places out of 98 places sampled, exceeded the desirable limit of 75 mg/l, they were Fort Cochin (157.11 mg/l), Ponnani (109.02 mg/l) and Koodungalur (120.24 mg/l) in Ernakulam, Malappuram and Thrissur districts respectively. Calcium in groundwater is mainly due to the dissolution of minerals. High concentration of calcium may increase the risk of kidney stones when exposed for long periods of time (Weiner 2000). Harikumar and Kokkal (2009) found the calcium values beyond the desirable limit in the Kabbini, Periyar and Neyyar river basins.
Fluorides
Samples exceeded the desirable limit (1 mg/l) were three viz. Mullackal, 1.4 mg/l and Kalikulam Junction, 1.2 mg/l (Alapuzha district) and Kollengode, 1.6 mg/l (Palakkad distrrict) are shown in the Fig. 3. About 91.84% of samples were found to contain (0.2 to 0.5 mg/l) low F– content. Only five samples had optimum level of F– viz., 0.6 mg/l in Koodungalur (Thrissur), Muvathupuzha and Mattancherry (Ernakulam) and 0.7 mg/l in Kannimari (Palakkad) and Thiruvallam (Thiruvananthapuram). Except Kollengode all other values were with in WHO (World Health Organisation) (2008) guideline value (1.5). Fluoride comes from weathering of minerals like fluorite (CaF2), cryolite (Na3AlF6), and fluorapatite (Ca5F(PO4)3) (Weiner 2000). Low F– content (< 0.60 mg/l) causes dental caries, whereas high (>1.20 mg/l) fluoride levels causes fluorosis (ISI 1983). Fluoride contamination was observed by George and Prakasam (2008) in the Edamulackkal Grama Panchayat, Kollam District, Harikumar et al. (2000) from the Thrissur, Palakkad, and Alappuzha Districts, and Shaji et al. (2007) in Palghat District.
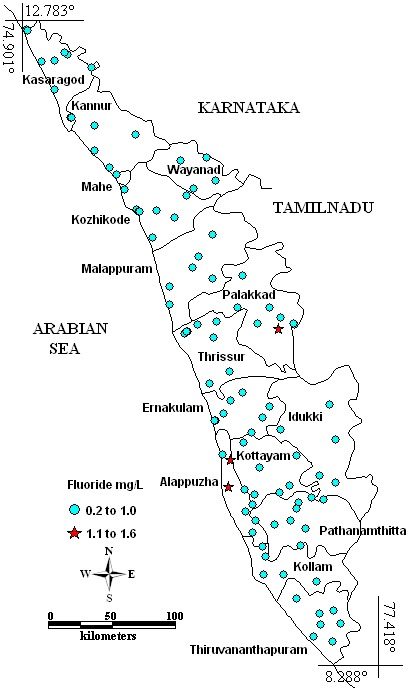
Fig. 3 – Spatial variation of Fluoride
Nitrates
Except two samples which contain 45.3 mg/l and 50 mg/l Kayamkulam ( Alapuzha) Old Munnar (Idukki), all samples were within desirable limit of 45 mg/l (Fig. 4). According to WHO (2008) all samples were with in guideline value (50 mg/l). This indicates that the anthropogenic influence is minimal in ground water. Fertilizers, animal waste and human sewage are the main sources for nitrates. High concentration (>1-2 mg/l) of nitrate in groundwater may be the result of manure seepage and the fertilizers through agricultural activities (Weiner 2000). High nitrate content causes gastric carcinomas and blue baby diseases/methaemoglobinaemia incase of children (Comly 1945; Gilly et al. 1984).
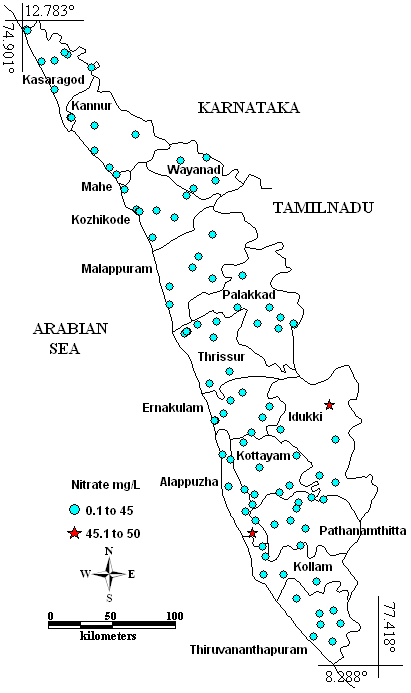
Fig. 4 –Spatial distribution of Nitrate in Kerala
Sulphates
In nature, SO42¯ may come from sedimentary rocks, sulphate deposits as gypsum (CaSO4.2H4O) and anhydrite (CaSO4). According to Weiner (2000), high concentration of SO42¯ leads to diarrhea. In this study area all the samples were under the desirable limit (200 mg/l) except from Koodungalur, 200.7 mg/l (Thrissur). Even in Koodungalur just 0.7 mg/l was more than the desirable limit, which indicates that the origin of SO42¯ is mainly from natural sources.
MPN
Faecal coliform contamination was observed from all districts except Pathanamthitta (Fig. 5). The highest value for coliform count was found in the Thrissur (n=1600). The groundwater bacterial contamination may be due to improper disposal of organic garbage or leachates from the tanks or pits (Harikumar and Kokkal 2009). The groundwater bacterial contamination will cause typhoid, diarrhea, cramps, nausea and headaches (http://www.epa.gov; Barrell et al. 2000). A coliform study conducted in coastal kerala (Calvert and Andersson 2000; Laluraj et al. 2005); Kottayam (Panicker et al. 2000) and Thiruvananthapuram (Varghese and Jaya 2009) districts; Chalakudy basin (Babu et al. 2007), Kabbini, Periyar and Neyyar river basins (Harikumar and Kokkal 2009) also recorded the presence of faecal coliform contamination.
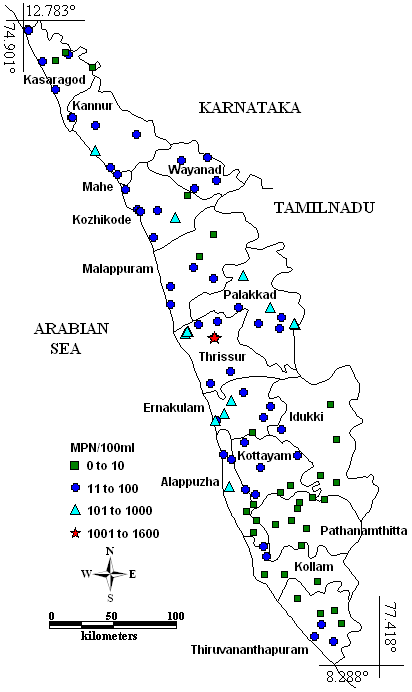
Fig. 5 – Spatial variation of MPN
Cluster analysis
Fig. 6 dendrogram of hierarchical cluster analysis (HCA) have four clusters at euclidean distance 20. Cluster I samples are characterized by unpolluted sites and sites slightly exceeding the desirable limit of BIS (1993) by one or more parameters like pH, faecal coliform, and TDS. Cluster II samples are mostly affected by pH, the other parameters exceeding the desirable limit in this group are faecal coliform, TDS, Mg2+ and NO3¯. The samples affected with many parameters along with sites exceeding the desirable limit in one or more parameters like TDS, Mg2+, F¯, Ca2+ and faecal coliform are grouped in cluster III. Cluster IV has the samples mostly affected by faecal coliform, the other parameters exceeding the desirable limit in this group are pH, TDS, Mg2+, NO3¯ and hardness. All clusters were affected by faecal coliform (anthropogenic contamination), though the quantity of anthropogenic contamination vary between clusters.
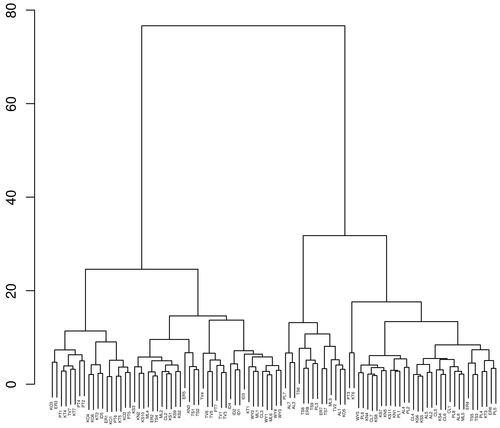
Fig. 6 - Hierarchical cluster analysis in Q mode using Ward's method showing euclidean distance in Y axis.
(AL-Alappuzha, CL-Kozhikode, ER-Ernakulam, ID-Idukki, KN-Kannur, KO-Kollam, KS-Kasaragod, KT-Kottayam, ML-Malappuram, PL-Palakkad, PT-Pathanamthitta, TS-Thrissur, TV-Thiruvananthapuram, WY-Wayanad. Number 1 to 11 indicates that the place).
Correlation of physicochemical parameters
The relationship among water quality variables were analysed by Pearson correlation coefficient at 95% confidence interval (Table 4). The strong positive correlation found between Ca2+, Mg2+, HCO3¯, alkalinity and hardness; and these variables also show positive correlation with pH, salinity, EC, TDS, Na+, K+, Cl¯, SO42¯, PO43¯, CO32¯and F¯. The correlation matrix shows that the magnesium is the main contributors for the alkalinity than the calcium. The DO and NO3¯ were not correlated with any parameters. The most of the correlated pairs are considered that the results of natural processes than the anthropogenic inputs.
Table 4: Correlation matrix showing relationship between physio-chemical variables.
| |
pH |
WT |
Sal |
EC |
TDS |
Ca2+ |
Mg2+ |
Na+ |
K+ |
HCO3¯ |
Cl¯ |
SO42¯ |
PO43¯ |
NO3¯ |
CO32¯ |
DO |
Alk |
Har |
F¯ |
| pH |
--- |
|
|
|
|
|
|
|
|
|
|
|
|
|
|
|
|
|
|
| WT |
0.16 |
--- |
|
|
|
|
|
|
|
|
|
|
|
|
|
|
|
|
|
| Sal |
0.15 |
0.17 |
--- |
|
|
|
|
|
|
|
|
|
|
|
|
|
|
|
|
| EC |
0.14 |
0.17 |
0.99* |
--- |
|
|
|
|
|
|
|
|
|
|
|
|
|
|
|
| TDS |
0.14 |
0.17 |
0.99* |
0.99* |
--- |
|
|
|
|
|
|
|
|
|
|
|
|
|
|
| Ca2+ |
0.49* |
0.13 |
0.32* |
0.31* |
0.31* |
--- |
|
|
|
|
|
|
|
|
|
|
|
|
|
| Mg2+ |
0.43* |
0.1 |
0.46* |
0.46* |
0.46* |
0.62* |
--- |
|
|
|
|
|
|
|
|
|
|
|
|
| Na+ |
0.24** |
0.13 |
0.51* |
0.51* |
0.51* |
0.57* |
0.48* |
--- |
|
|
|
|
|
|
|
|
|
|
|
| K+ |
0.19 |
0.26** |
0.43* |
0.39* |
0.39* |
0.51* |
0.38* |
0.64* |
--- |
|
|
|
|
|
|
|
|
|
|
| HCO3¯ |
0.64* |
0.12 |
0.33* |
0.33* |
0.33* |
0.66* |
0.85* |
0.29* |
0.28* |
--- |
|
|
|
|
|
|
|
|
|
| Cl¯ |
0.22** |
0.17 |
0.64* |
0.64* |
0.64* |
0.51* |
0.79* |
0.75* |
0.64* |
0.54* |
--- |
|
|
|
|
|
|
|
|
| SO42¯ |
0.34* |
0.22** |
0.59* |
0.59* |
0.59* |
0.53* |
0.58* |
0.56* |
0.51* |
0.46* |
0.67* |
--- |
|
|
|
|
|
|
|
| PO43¯ |
0.26** |
0.15 |
0.14 |
0.14 |
0.14 |
0.46* |
0.21** |
0.27* |
0.29* |
0.28* |
0.20** |
0.46* |
--- |
|
|
|
|
|
|
| NO3¯ |
0.10 |
0.07 |
-0.09 |
-0.10 |
-0.10 |
0.16 |
0.18 |
-0.03 |
0.03 |
0.14 |
0.02 |
-0.04 |
0.11 |
--- |
|
|
|
|
|
| CO32¯ |
0.50* |
-0.1 |
0.13 |
0.13 |
0.13 |
0.23** |
0.28* |
0.19 |
0.08 |
0.48* |
0.19 |
0.16 |
0.04 |
-0.05 |
--- |
|
|
|
|
| DO |
0.10 |
0.03 |
-0.07 |
-0.08 |
-0.09 |
-0.19 |
-0.16 |
-0.15 |
-0.05 |
-0.13 |
-0.16 |
-0.06 |
-0.02 |
0.08 |
0.13 |
--- |
|
|
|
| Alk |
0.64* |
0.12 |
0.33* |
0.33* |
0.33* |
0.66* |
0.85* |
0.3* |
0.28* |
1* |
0.54* |
0.46* |
0.28* |
0.14 |
0.48* |
-0.13 |
--- |
|
|
| Har |
0.48* |
0.11 |
0.46* |
0.46* |
0.46* |
0.75* |
0.98* |
0.53* |
0.44* |
0.86* |
0.78* |
0.61* |
0.28* |
0.19 |
0.28* |
-0.18 |
0.86* |
--- |
|
| F¯ |
0.25** |
0.13 |
0.08 |
0.08 |
0.08 |
0.21** |
0.43* |
0.04 |
0.07 |
0.48* |
0.25** |
0.19 |
0.33* |
0.15 |
0.13 |
-0.14 |
0.48* |
0.40* |
--- |
*Significant value at p ≤ 0.01
**Significant value at p ≤ 0.05 > 0.01WT - water temperature, Sal - salinity, TDS - total dissolved solids, EC - electrical conductivity, DO - dissolved oxygen, Alk - alkalinity, Har - hardness.
Groundwater chemistry
Groundwater types
The groundwater types were determined by plotting the major cations and anions in the piper diagram (Fig. 7). It shows that alkaline earths (Ca2+ and Mg2+) significantly exceed the alkalis (Na+ and K+) and strong acids (Cl¯ and SO42¯) significantly exceed the weak acids (HCO3¯ and CO32¯). The most of the samples were of mixed Ca-Mg-Cl type followed by Na-Cl, Ca-HCO3, Ca-Cl, mixed Ca-Na-HCO3, and Na-HCO3 types.
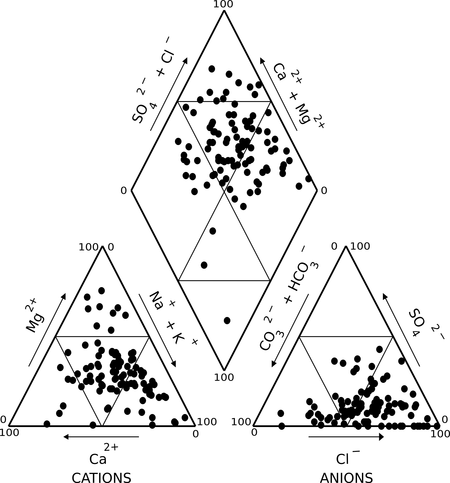
Fig. 7 - Water type chemical parameters through Piper diagram
Spatial trend in groundwater
Stiff diagram (Fig. 8) shows that the central Kerala had highest amount of major ions than the other regions of Kerala. In particular, Kodungallur (Thrissur) with Na+ plus K+ (Cations) and Cl¯ (anions) and Ponnani (Malappuram district) with Na+ plus K+. It reveals that both Kodungallur and Ponnani groundwater is influenced by weathering, sea water intrusion, and anthropogenic activities like industrial wastewater and irrigation drainage. The other places having higher amount of ions, especially cations and few places also with anions are Palakkad, Thiruvananthapuram, Ernakulam, Alappuzha, Idukki, Kottayam and Kollam districts.
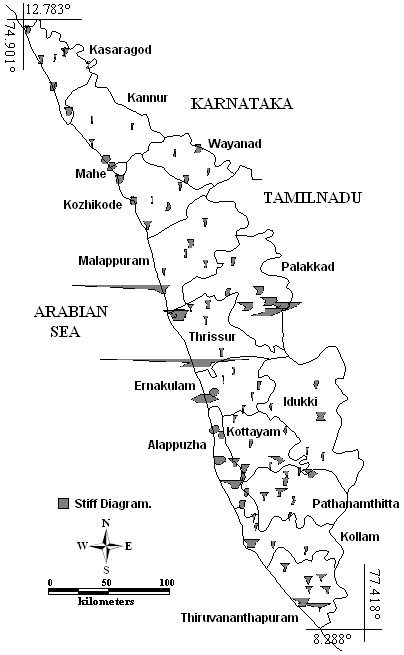
Fig. 8 - Stiff diagram reflecting the variability of major ions
|
