|
MATERIALS AND METHODS
Study area
Kerala, a coastal state in the south-west of peninsular India is situated between 8° 15'N - 12° 50'N latitude and 74° 50'E – 7° 30'E longitude. It receives rainfall from south-west monsoon (June - September) and north-east monsoon (October – November). According to the 2001 census Kerala's population is 31,841,374 persons, with population density being 819 people per square kilometer (http://censusindia.gov.in). Kerala has a geographical area of 38,863 sq. km (http://www.kerala.gov.in) with a diverse topography, from the low- lands adjoining the sea on the west, the landscape ascends steadily towards the east to the midlands and further on to the highlands sloping from the Western Ghats.
Table 1: Physico-chemical and biological parameters and the methods followed
| Parameters |
Units |
Methods |
Section no. APHA, 1995 |
| pH |
- |
Electrode Method |
4500-H+ B |
| WT |
ºC |
2550 B |
| Salinity |
ppm |
2520 B |
| TDS |
ppm |
2540 B |
| EC |
µS |
2510 B |
| DO |
mg/l |
Iodometric method |
4500-O B |
| Alkalinity |
mg/l |
HCl Titrimetric Method |
2320 B |
| Cl¯ |
mg/l |
Argentometric Method |
4500-Cl ¯ B |
| Hardness |
mg/l |
EDTA Titrimetric Method |
2340 C |
| Ca2+ |
mg/l |
EDTA Titrimetric Method |
3500-Ca B |
| Mg2+ |
mg/l |
Calculation Method |
3500-Mg B |
| Na+ |
mg/l |
Flame Emission Photometric Method |
3500-Na B |
| K+ |
mg/l |
Flame Emission Photometric Method |
3500-K B |
| F¯ |
mg/l |
SPADNS method |
4500-F ¯ D |
| NO3¯ |
mg/l |
Nitrate Electrode method |
4500-NO3¯ D |
| SO42¯ |
mg/l |
Turbidimetric method |
4500-SO42¯ E |
| PO43¯ |
mg/l |
Stannous Chloride Method |
4500-P D |
| Faecal coliform |
MPN/100ml |
Multiple Tube Fermentation Technique |
9221 B |
WT - water temperature, TDS - total dissolved solids, EC - electrical conductivity, DO - dissolved oxygen.
Sample collection
Stratified random sampling was adopted to collect groundwater samples from 98 wells covering all districts (Fig. 1) during the summer period (April - May 2007). Summer season was chosen for water quality analysis as the water situation in most parts of Kerala is acute during that period. A minimum of four samples and maximum of 11 samples were collected from each district of Kerala. Samples were collected in disinfected 2.5 litre plastic containers. After collection, the samples were labeled with sample number; date of collection, latitude and longitude (retrieved from Garmin GPS).
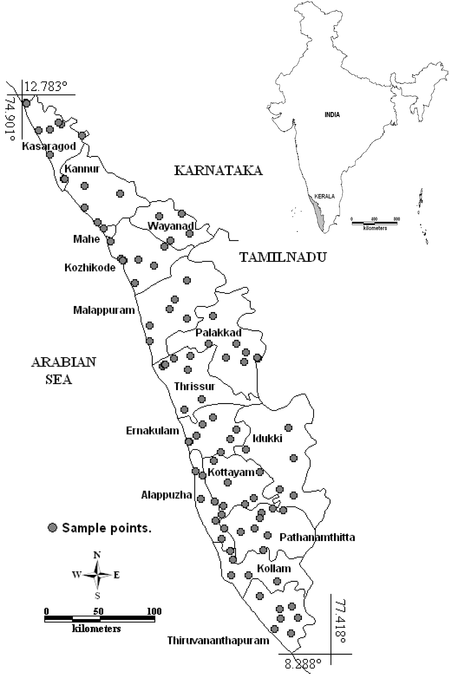
Fig. 1 - Locations for groundwater sampling
Physical, chemical and biological analysis
In situ measurements of pH, water temperature, salinity, total dissolved solids and electrical conductivity were recorded with EXTECH COMBO electrode (EC500) and Nitrates by using Orion Ion Selective Electrode. Alkalinity, chloride, hardness, calcium, magnesium, sodium, potassium, fluoride, sulphate, phosphates and coliform bacteria were analyzed at Environment Chemistry laboratory, Centre for Ecological Sciences as per the standard procedure given in APHA (1995). Bicarbonate and carbonate were calculated by using the formula given by Russell (2006). Coliform bacteria were estimated by using standard Multiple Tube Fermentation Technique (MTFT), nine multiple tube dilution technique using double and single strength Bromo-Cresol Purple, MacConkey medium and Membrane filter techniques by using M-EC test agar and MPN Index was calculated from MPN table (APHA (1995)). Indian standard specification for drinking water IS: 10500, 1992 (Reaffirmed 1993) were adopted in this study.
Data analysis
Correlation
Correlations among variables were determined using Pearson product movement coefficient through RLPlot version 1.4. Value of correlation coefficient greater than or equal to -0.50 or +0.50 is statistically significant at a 95% confidence level (Einax et al. 1997).
Cluster analysis
Hierarchical Cluster Analysis (HCA) was carried out using R version 2.7.1 (R Development Core Team 2008). This has been done in Q mode (classification of samples according to their parameters) to cluster the samples into groups, using Euclidean distance with Ward's method. HCA groups the samples that have similar characteristics (Guler et al. 2002). Twenty variables were used in this analysis viz. Ca2+, Mg2+, Na+, K+, CO32¯, HCO3¯, SO42¯, PO43¯, NO3¯, TDS, pH, water temperature, salinity, electrical conductivity, dissolved oxygen, alkalinity, hardness, fluoride and coliform. Prior to HCA, data were log transformed in PAST version 1.98 (Hammer et al. 2001) and standardized z-score was computed to give equal weight to all variables.
Piper diagram
To understand geochemical evolution, ground water type, mixing of water from different sources and physiochemical processes of groundwater in the watershed, Piper (1944) diagram has been used (Freeze and Cherry 1979; Guler et al. 2002). In the diagram, a point on the left triangular part for a particular location or sample, represents the major cations like Ca2+, Mg2+ and Na+ plus K+ and a point on the right one represents the major anions like SO42¯, Cl¯, CO32¯ plus HCO3¯. Both these points projected together in the diamond shaped part as a single point. This point explains the overall chemical character of the groundwater of that particular location The parameters value were plotted as mg/l in piper diagram by using GWChart Version 1.22.1.0 (Winston 2000).
Spatial distribution
The spatial distribution pattern of major ions can be explained by using geostiff diagram, that is georeferenced stiff diagram. Stiff diagram shows the concentration of major cations (left side) and anions (right side) of a particular place in a single diagram. Geostiff diagram allows to plot one or more stiff diagrams spatially in a single diagram. The major cations and anions used to prepare geostiff diagram were Ca2+, Mg2+, K+, Na+, CO32¯, HCO3¯, Cl¯ and SO42¯ along with TDS, in mg/l. The geostiffdiagram was prepared in the shape file format by using geostiff version 1.0. Then the shape file was imported in QGIS version 1.4.0-Enceladus and the final image format was prepared using MapInfo version 6.0.
|
