 |
Diatom Based Pollution Monitoring in Urban Wetlands
|
 |
1 Energy and Wetlands Research Group, Centre for Ecological Sciences,
Indian Institute of Science, Bangalore – 560 012, INDIA
2 Department of Botany, Yuvaraja College, Mysore University, Mysore
Methods and Materials
Study Area
Coimbatore known popularly as “Manchester of India” is an important industrial city, located in Tamil Nadu (10°55’ - 11°10’ N, and 77°10’ - 76°50’ E) at an average altitude of 470m, ranking 11th in terms of population (Figure 1). There are more than 30,000 small, medium and large industries including textile mills and foundries in the city employing about 40% of the population. The growing industrial sector and ensuing immigration of people pose heavy burden on the city infrastructure that did not grow in proportion. The city does not have facilities for treatment of industrial, municipal and domestic wastes. Wetlands and Noyyal River have been used for disposal of wastes of the city. Natural drainage networks have been converted to storm water drains for letting the sewerage into wetlands without any treatment. In Coimbatore city there are 28 wetlands, mostly fed by the river Noyyal. The river, flowing through the city on its south, originates in the Vellingiri hills in Western Ghats, located on the south-western side of the city. Wetlands in Coimbatore are seasonal and have also been used as dumping yard for garbage and industrial wastes during dry period (Mohan Raj et al., 2000). During the monsoon, with the inflow of water, this activity leads to contamination of groundwater sources. Six wetlands selected for biomonitoring (Figure 1) are: Vedapatti (VP), Pallapalayam (PP), Sundakamuthur (SM), Perur (PR), Noyyal (NL) and Singanallur (SN).
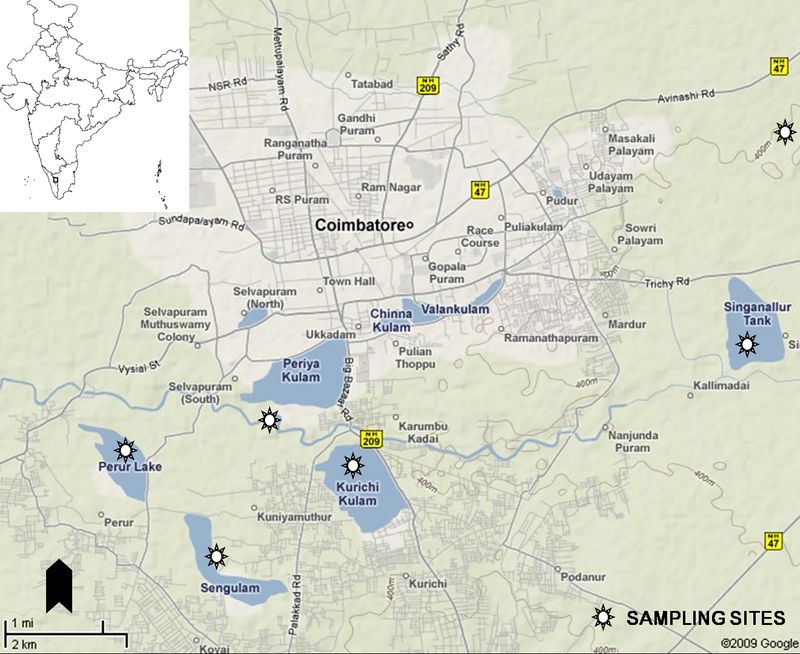
Figure 1. Coimbatore city map with the sampling points marked. Inset study area marked in India (Maps Courtesy: Google)
Water and Diatom sampling
Water samples were collected from all sampling sites in the sterilised polythene bottles. Physical variables like pH, temperature, electric conductivity, salinity and total dissolved solids were measured on site using EXTECH combo probe. Diatom samples were collected simultaneously during water sampling from 3 habitats such as cobbles (epilithic), aquatic plants (epiphytic) and sediment (episammic) during September 2007. All samples were reserved in 70% ethanol.
In laboratory, samples were processed by KMnO4 + hot HCl method, and slides were prepared using standard methods of Taylor et al., 2005. Diatom communities were then analysed by counting 400 to 450 valves. During enumeration the dimensions of diatom valve characteristics, like length, width and striae densities in 10 µm were measured. Identification of diatoms, to the least possible taxonomic level was carried out using taxonomic guides (Gandhi, 1957 1959a, 1959b, 1961, 1962, 1964, 1967, 1998; Lange-Bertalot, 2001; Krammer, 2002; Taylor, 2007; Karthick et al., 2008). Ecological diversity was calculated for each sample using diversity indices (Magurran, 2004) on PAST version 1.89 (Hammer et al., 2001). Diatom specific indices (Table 1) were calculated from community counts in OMNIDIA version5.3. Canonical correspondence analysis (CCA) using PAST was performed to examine the taxa distribution across sampling sites with reference to environmental variables. CCA mainly focuses on those taxa that vary with measured environmental variables. Only those taxa which are present at least in one sampling site with % relative abundance of 10% are included in the CCA analysis.
Table 1: Diatom Indices used in this study
| Abbreviation |
Full name |
Reference |
| IPS |
Specific Pollution Sensitivity Metric |
(Coste, 1987) |
| SLAD |
Sládeček’s pollution metric |
(Sládeček, 1986) |
| DESCY |
Descy’s pollution metric |
(Descy, 1979) |
| L&M |
Leclercq and Maquet’s pollution metric |
(Leclerq and Maquet, 1987) |
| SHE |
Steinberg and Schiefele trophic metric |
(Steinberg and Schiefele, 1988) |
| WAT |
Watanabe et al. pollution metric |
(Lecointe et al.1993) |
| TDI |
Trophic Diatom metric |
(Kelly and Whitton, 1995) |
| EPI-D |
Pollution metric based on diatoms |
(Dell’Uomo, 1996) |
| ROTT |
Trophic metric |
(Rott et al.1999) |
| IDG |
Generic Diatom Metric |
(Lecointe et al. 2003) |
| CEE |
Commission for Economical Community metric |
(Descy and Coste, 1991) |
| IBD |
Biological Diatom Metric |
(Prygiel and Coste, 1999) |
| IDAP |
Indice Diatomique Artois Picardie |
(Lecointe et al. 2003) |
| IDP |
Pampean Diatom Index (IDP) |
(Gómez and Licursi, 2001) |
Citation: Alakananda B., Karthick B., Mahesh M. K. and Ramachandra T. V., 2011, Diatom Based Pollution Monitoring in Urban Wetlands, The IUP Journal of Soil and Water Sciences, Vol. 4, No. 2, pp. 33 – 52.
Alakananda B.Research Scholar, Energy and Wetlands Research Group, Centre for Ecological Sciences, Indian Institute of Science, Bangalore – 560 012, India
E-mail:
alka@ces.iisc.ac.in
Karthick B.Post Doctoral Fellow, Energy and Wetlands Research Group, Centre for Ecological Sciences, Indian Institute of Science, Bangalore – 560 012, India
E-mail:
karthick@ces.iisc.ac.in
Mahesh M. K.Faculty, Department of Botany, Yuvaraja College, Mysore University, Mysore
E-mail:
maheshkapanaiah@yahoo.co.in
Dr. T.V. Ramachandra
Energy & Wetlands Research Group,
Centre for Ecological Sciences, Indian Institute of Science, Bangalore – 560 012, INDIA.
E-mail : cestvr@ces.iisc.ac.in
Mohanraj R, Sathishkumar M, Azeez P A and Sivakumar R (2000), “Pollution Status of Wetlands in Urban Coimbatore, Tamilnadu, India”, Bulletin of Environmental Contamination and Toxicology, Vol. 64(5), pp.638-643.
- Gandhi H P (1957), "A contribution to our knowledge of the diatom genus Pinnularia”, Journal of the Bombay Natural History Society, Vol. 54, pp. 845-853.
- Gandhi H P (1959a), “Freshwater diatoms from Sagar in the Mysore State”, Journal of the Indian Botanical Society, Vol. 38, pp. 305-331.
- Gandhi H P (1959b), “Notes on the Diatomaceae from Ahmedabad and its environs-II. On the diatom flora of fountain reservoirs of the Victoria Gardens”, Hydrobiologia, Vol. 14, pp. 130-146.
- Gandhi H P (1961), “Notes on the Diatomaceae of Ahmedabad and its environs”, Hydrobiologia, Vol. 17, pp. 218-236.
- Gandhi H P (1962), “Notes on the Diatomaceae from Ahmedabad and its environs-IV The diatom communities of some freshwater pools and ditches along Sarkhej Road”, Phykos, Vol. 1, pp. 115-127.
- Gandhi H P (1964), “The diatom flora of Chandola and Kankaria Lakes”, Nova Hedwigia, Vol. 8, pp. 347-402.
- Gandhi H P (1967), “Notes on Diatomaceae from Ahmedabad and its environs. VI. On some diatoms from fountain reservoirs of Seth Sarabhai's Garden”, Hydrobiologia, Vol. 30, pp. 248-272.
- Gandhi H P (1998), “Freshwater Diatoms of Central Gujarat. Bishen Singh Mahendra Pal Singh. Dehra Dun”.
Lange-Bertalot H (2001), “Navicula sensu strict. 10 Genera separated from Navicula sensu lato-frustulia”. In: Diatoms of Europe. Diatoms of the European Inland waters and comparable Habitats (H. Lange-Bertalot, ed). A.R.G. Gantner Verlag K.G. Ruggell, Vol. 1, pp. 526.
Krammer K (2002), “Diatoms of Europe. Diatoms of the European Inland Waters and Comparable Habitats”, Vol. 3, Cymbella. A R G Gantner Verlag K G Ruggell, pp. 584.
Taylor J C, Harding W R and Archibald C G M (2007), “An Illustrated Guide to Some Common Diatom Species from South Africa”, WRC Report TT 282/07, Water Research Commission. Pretoria.
Karthick B, Krithika H and Alakananda B (2008), “Short Guide to common freshwater Diatom Genera”, (Poster), Energy and Wetlands Research Group, CES, IISc, Bangalore.
Magurran A E (2004), “Measuring Biological Diversity”, Blackwell Publishing, Oxford, UK, Vol. 7, pp. +256.
Hammer Ø, Harper D A T and Ryan P D (2001), “PAST: Paleontological Statistics Software Package for Education and Data Analysis”, Palaeontologia Electronica, Vol. 4(1), pp. 9, http://palaeo-electronica.org /2001_1/past/issue1_01.htm.
Coste M (1987), “Etude des méthods biologique quantitative d’appréciation de la qualitédes eaux”, Rapport Division Qualitédes Eaux Lyon, Agence de l’Eau Rhône, pp28.
Sládeĉ¡ek V (1986), “Diatoms as indicators of organic pollution”, Acta Hydrochimica et Hydrobiologica, Vol. 14, pp. 555–566.
Descy J P (1979), “A new approach to water quality estimation using diatoms”, Nova Hedwigia, Vol. 64, pp. 305–323.
Leclerq L and Maquet B (1987), “Deux nouveaux indices chimique et diatomique de qualite´ d’eau courante. Application au Samson et àses affluents (bassin de la Meuse belge). Comparaison avec d’autres indices chimiques, bioce´notiques et diatomiques”, Institute Royal des Sciences Naturelles de Belgique, documentde travail, pp. 28.
Steinberg C and Schiefele S (1988), “Biological indication of trophy and pollution of running waters”, Zeitschrift für Wasserund Abwasser-Forschung, Vol. 21, pp. 227–234.
Lecointe C, Coste M and Prygiel J (1993), ‘‘Omnidia: Software for taxonomy, calculation of diatom indices and inventories management”, Hydrobiology, Vol. 269/270, pp. 509–513.
Kelly M G and Whitton B A (1995), “The Trophic Diatom Index: a new index for monitoring Eutrophication in rivers”, Journal of Applied Phycology, Vol. 7, pp. 433-444.
Dell’Uomo A (1996), “Assessment of water quality of an Apennine river as a pilot study”, In Whitton, B. A. and E. Rott (eds), Use of Algae for Monitoring Rivers II. Institut für Botanik, Universität Innsbruck, pp.65–73.
Rott E, Pfister P, Van Dam H, Pipp E, Pall K, Binder N and Ortler K (1999), “Indikationslisten für aufwuchsalgen”, Wien. Bundesministerium für Landund Forstwirtschaft 248.
Lecointe C, Coste M and Prygiel J (2003), “Omnidia 3.2. Diatom Index Software Including Diatom Database with Taxonomic Names, References and Codes of 11645 Diatom Taxa”.
Descy J P and Coste M (1991), “A test of methods for assessing water quality based on diatoms”, Verhandlung Internationale Vereingung de Limnologie, Vol. 24, pp. 2112–2116.
Prygiel J and Coste M (1999), “Progress in the use of diatoms for monitoring rivers in France”, In Prygiel, J., B. A. Whitton & J. Bukowska (eds), Use of Algae for Monitoring Rivers III. Douai, Agence de l’Eau Artois-Picardie, pp. 165–179.
Lecointe C, Coste M and Prygiel J (2003), “Omnidia 3.2. Diatom Index Software Including Diatom Database with Taxonomic Names, References and Codes of 11645 Diatom Taxa”.
Gómez N and Licursi M (2001), “The Pampean Diatom Index (IDP) for assessment of rivers and streams in Argentina”, Aquatic Ecology, Vol. 35, pp. 173–181.

 PDF
PDF